GeoDAR: georeferenced global dams and reservoirs dataset for bridging attributes and geolocations
←
→
Page content transcription
If your browser does not render page correctly, please read the page content below
Earth Syst. Sci. Data, 14, 1869–1899, 2022
https://doi.org/10.5194/essd-14-1869-2022
© Author(s) 2022. This work is distributed under
the Creative Commons Attribution 4.0 License.

           GeoDAR: georeferenced global dams and reservoirs
             dataset for bridging attributes and geolocations
         Jida Wang1 , Blake A. Walter1 , Fangfang Yao2 , Chunqiao Song3 , Meng Ding1 , Abu Sayeed Maroof1 ,
       Jingying Zhu3 , Chenyu Fan3 , Jordan M. McAlister4 , Safat Sikder1 , Yongwei Sheng5 , George H. Allen6 ,
                                   Jean-François Crétaux7 , and Yoshihide Wada8
          1 Department   of Geography and Geospatial Sciences, Kansas State University, Manhattan, Kansas, USA
                           2 Cooperative Institute for Research in Environmental Sciences (CIRES),

                                   University of Colorado Boulder, Boulder, Colorado, USA
              3 Nanjing Institute of Geography and Limnology, Chinese Academy of Sciences, Nanjing, China
                    4 Department of Geography, Oklahoma State University, Stillwater, Oklahoma, USA
         5 Department of Geography, University of California, Los Angeles (UCLA), Los Angeles, California, USA
                      6 Department of Geography, Texas A&M University, College Station, Texas, USA
                        7 Laboratoire d’Études en Géophysique et Océanographie Spatiales (LEGOS),

                                 Centre National d’Études Spatiales (CNES), Toulouse, France
                     8 International Institute for Applied Systems Analysis (IIASA), Laxenburg, Austria

                                      Correspondence: Jida Wang (jidawang@ksu.edu)

                                   Received: 24 February 2021 – Discussion started: 24 March 2021
                         Revised: 20 February 2022 – Accepted: 21 February 2022 – Published: 21 April 2022

      Abstract. Dams and reservoirs are among the most widespread human-made infrastructures on Earth. Despite
      their societal and environmental significance, spatial inventories of dams and reservoirs, even for the large ones,
      are insufficient. A dilemma of the existing georeferenced dam datasets is the polarized focus on either dam
      quantity and spatial coverage (e.g., GlObal geOreferenced Database of Dams, GOODD) or detailed attributes for
      a limited dam quantity or region (e.g., GRanD (Global Reservoir and Dam database) and national inventories).
      One of the most comprehensive datasets, the World Register of Dams (WRD), maintained by the International
      Commission on Large Dams (ICOLD), documents nearly 60 000 dams with an extensive suite of attributes.
      Unfortunately, the WRD records provide no geographic coordinates, limiting the benefits of their attributes
      for spatially explicit applications. To bridge the gap between attribute accessibility and spatial explicitness, we
      introduce the Georeferenced global Dams And Reservoirs (GeoDAR) dataset, created by utilizing the Google
      Maps geocoding application programming interface (API) and multi-source inventories. We release GeoDAR in
      two successive versions (v1.0 and v1.1) at https://doi.org/10.5281/zenodo.6163413 (Wang et al., 2022). GeoDAR
      v1.0 holds 22 560 dam points georeferenced from the WRD, whereas v1.1 consists of (a) 24 783 dam points
      after a harmonization between GeoDAR v1.0 and GRanD v1.3 and (b) 21 515 reservoir polygons retrieved from
      high-resolution water masks based on a one-to-one relationship between dams and reservoirs. Due to geocoding
      challenges, GeoDAR spatially resolved ∼ 40 % of the records in the WRD, which, however, comprise over
      90 % of the total reservoir area, catchment area, and reservoir storage capacity. GeoDAR does not release the
      proprietary WRD attributes, but upon individual user requests we may provide assistance in associating GeoDAR
      spatial features with the WRD attribute information that users have acquired from ICOLD. Despite this limit,
      GeoDAR, with a dam quantity triple that of GRanD, significantly enhances the spatial details of smaller but
      more widespread dams and reservoirs and complements other existing global dam inventories. Along with its
      extended attribute accessibility, GeoDAR is expected to benefit a broad range of applications in hydrologic
      modeling, water resource management, ecosystem health, and energy planning.

Published by Copernicus Publications.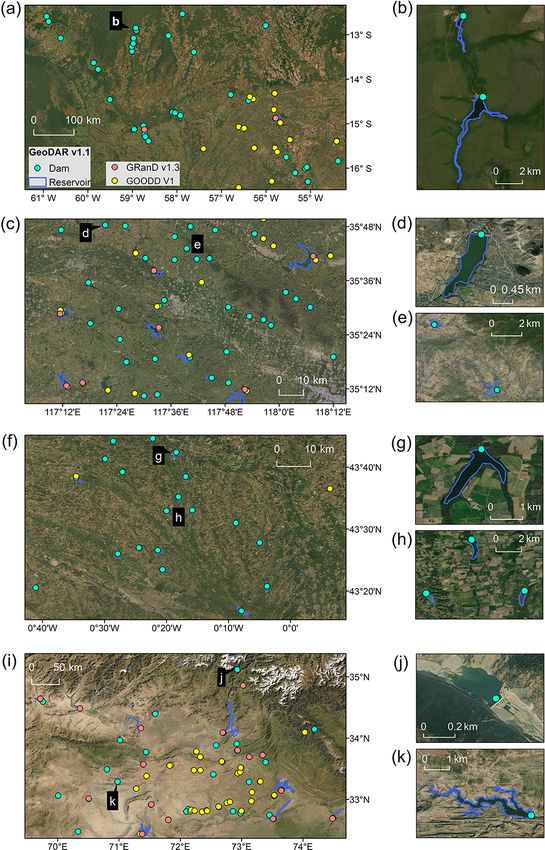
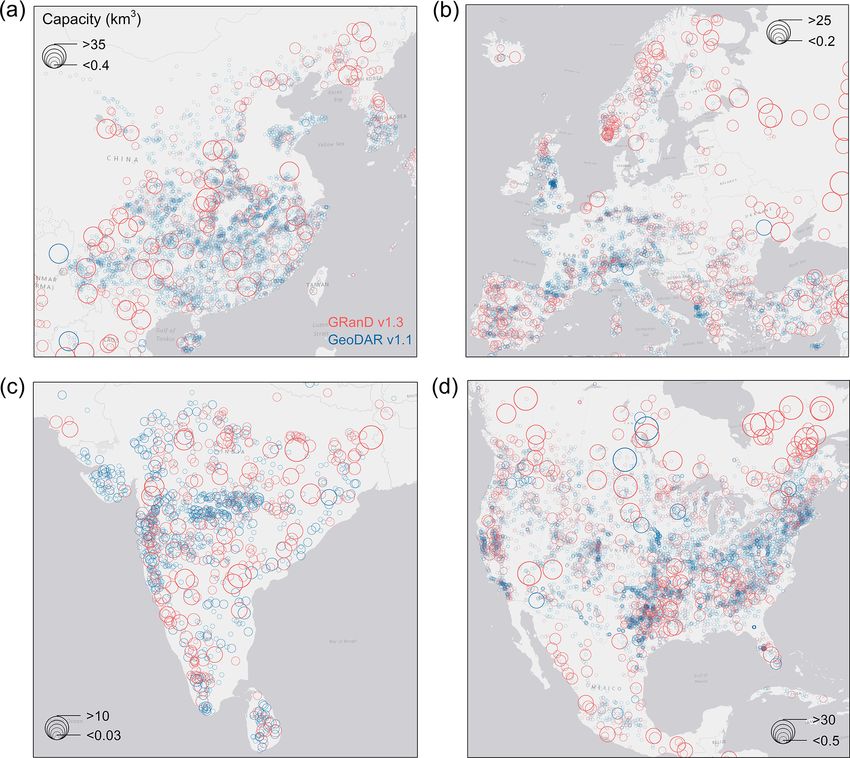
1870                                                                                                    J. Wang et al.: GeoDAR

1   Introduction                                                  is the recently published GlObal geOreferenced Database of
                                                                  Dams (GOODD V1) (Mulligan et al., 2020), which contains
                                                                  38 667 dam points digitized from Google Earth imagery and
Since around the 1950s, the world has seen an unprecedented       their associated catchments delineated from digital elevation
boom in large dam construction as a response to the ever-         models (DEMs). Despite this dam quantity, GOODD pro-
growing human demands for water and energy (Chao et al.,          vides no other attribute information. Another inventory, the
2008; Wada et al., 2017). Today, dams and their impounded         Global River Obstruction Database (GROD) (Whittemore et
reservoirs are ubiquitous across many global basins, provid-      al., 2020; Yang et al., 2022), located more than 30 500 flow
ing multiple services that range from hydropower and flood        obstructions along rivers wider than 30 m as mapped in the
control to water supply and navigation (Belletti et al., 2020;    Global River Width from Landsat (GRWL) database (Allen
Biemans et al., 2011; Boulange et al., 2021; Döll et al., 2009;   and Pavelsky, 2018). The current attributes are mainly lim-
Grill et al., 2019). These benefits were, however, often gained   ited to obstruction types such as locks, weirs, and multiple
at the cost of fragmenting river systems, submerging arable       types of dams. In addition, GRWL was tailored for the forth-
lands, displacing population, and disturbing climate regimes      coming Surface Water and Ocean Topography (SWOT) satel-
(Carpenter et al., 2011; Crétaux et al., 2015; Degu et al.,       lite mission, which was designed to observe river reaches
2011; Grill et al., 2019; Latrubesse et al., 2017; Nilsson and    wider than 50–100 m (Biancamaria et al., 2016). While these
Berggren, 2000; Tilt et al., 2009; Vörösmarty et al., 2003;       rivers are sufficiently captured by GRWL, the obstruction
Wang et al., 2017).                                               infrastructure identified along the river mask in GRWL ex-
   Despite such environmental and societal significance, our      cludes many large dams on rivers narrower than 30 m. In
spatial inventory of global dams and reservoirs, even for the     the US, for instance, there are about 9020 NID-registered
large ones (such as those with a surface area > 1 km2 ), has      large dams according to ICOLD criteria, but only ∼ 9 %
been insufficient. We still lack a thorough and authoritative     of them intersect with GRWL (calculated with variable dis-
dataset that documents both geographic coordinates (latitude      tance tolerance being the maximum river widths (attribute
and longitude) and standard attributes (e.g., purpose, reser-     “width_max”) of the GRWL lines).
voir storage capacity, and hydropower capacity) of the ex-           Among the few global dam or reservoir datasets that pro-
isting large dams. One of the most comprehensive datasets,        vide both georeferenced locations and essential attributes
the World Register of Dams (WRD), is regularly updated            are the United Nations Food and Agricultural Organization
by the International Commission on Large Dams (ICOLD;             (FAO) AQUASTAT (Li et al., 2011) and the Global Reservoir
https://www.icold-cigb.org, last access: 13 March 2019), a        and Dam database (GRanD) (Lehner et al., 2011). GRanD
non-governmental organization dedicated to the global shar-       was constructed by harmonizing AQUASTAT and a wide
ing of professional dam or reservoir information. The re-         range of regional gazetteers and inventories. Its latest ver-
cent version of the ICOLD WRD documents nearly 60 000             sion, v1.3, contains 7320 dams as well as their reservoir
“large” dams, defined as those with a wall higher than 15 m       boundaries and over 50 attributes, with a cumulative stor-
or between 5 and 15 m but with a reservoir storage greater        age capacity of 6881 km3 . Since its publication, GRanD has
than 3×10⁶ m3 (mcm). These WRD records are considered             been applied extensively by a variety of studies, although its
to be “complete” to the extent of contributions from willing      focus is on the world’s largest dams (e.g., > 0.1 km3 ), and
nations and water authorities (Wada et al., 2017).                its quantity (7320 dams) is a fraction of the ∼ 59 000 dams
   While the ICOLD WRD provides more than 40 attributes           documented in the WRD. A spatially resolved inclusion of
(e.g., reservoir storage capacity, dam height, and reservoir      additional large dams, such as those in compliance with the
purpose), the dam locations are, unfortunately, either not        ICOLD definition, has been increasingly desired by the hy-
georeferenced or inaccessible to the public. Despite the avail-   drology community and encouraged by growing collabo-
ability of many essential attributes, missing geographic coor-    rations from multiple disciplines such as biogeochemistry,
dinates have severely limited the applications of the WRD,        ecology, energy planning, and infrastructure management
including for hydrological modeling and hydropower plan-          (Belletti et al., 2020; Boulange et al., 2021; Grill et al., 2019;
ning (Yassin et al., 2019), which require the dam records         Lin et al., 2019; Wada et al., 2017).
to be spatially explicit. This dilemma may be partially re-          Here, we present the initial versions of the Georeferenced
solved by using georeferenced regional registers such as          global Dams And Reservoirs dataset, or GeoDAR. We built
the United States National Inventory of Dams (US NID;             GeoDAR by leveraging multi-source dam and reservoir in-
https://nid.sec.usace.army.mil, last access: 20 March 2021).      ventories and the Google Maps geocoding application pro-
Nevertheless, such regional registers are not always publicly     gramming interface (API). Our goal is to tackle the limita-
available, especially in developing nations, where dam con-       tions of existing datasets by offering a dam inventory that is
struction is still booming (Zarfl et al., 2015).                  both spatially resolved and has an extended ability to access
   Other global dam and reservoir datasets that are georefer-     important attributes. As summarized in Table 1, GeoDAR
enced, however, often lack essential attributes. An example

Earth Syst. Sci. Data, 14, 1869–1899, 2022                                         https://doi.org/10.5194/essd-14-1869-2022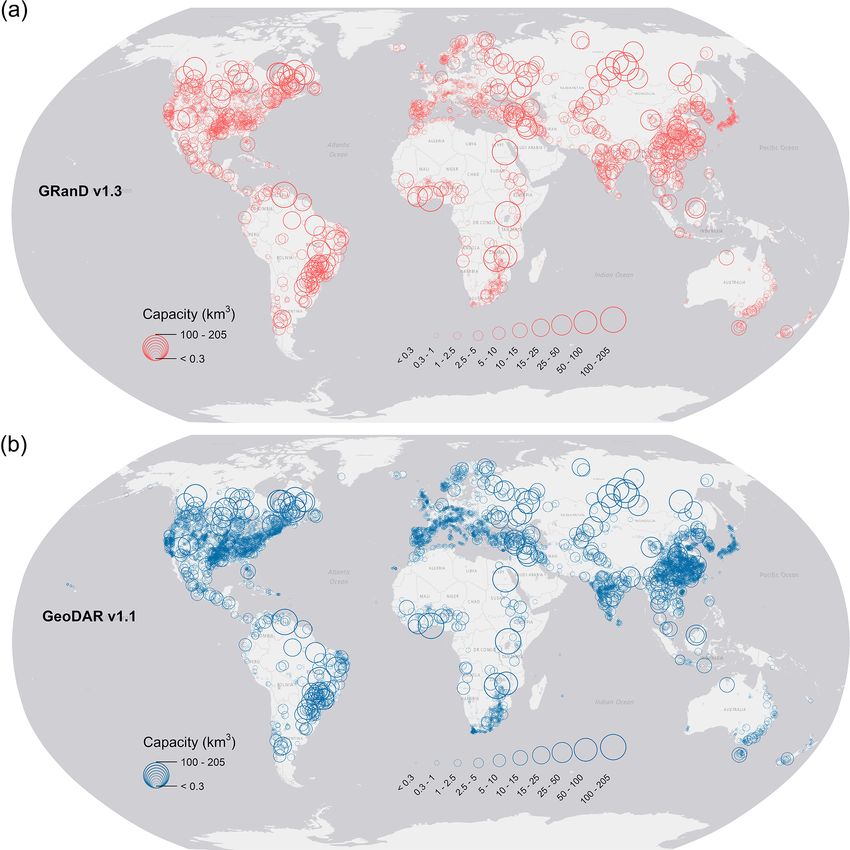
J. Wang et al.: GeoDAR                                                                                                    1871

includes two successive versions. GeoDAR v1.0 is essen-           from the ∼ 59 000 dams listed in the original ICOLD WRD
tially a georeferenced subset of the ICOLD WRD. It contains       (accessed in March 2019). Here “duplicates” are defined as
22 560 dam points, each indexed by an identifier (ID) that is     the dams that are either (a) repeatedly recorded with iden-
associated with a unique WRD record, allowing for potential       tical (or highly similar) attribute information or (b) differ-
retrieval of all its 40+ proprietary attributes from ICOLD.       ent dam structures but associated with the same reservoir.
GeoDAR v1.1 consists of (a) nearly 25 000 dam points which        Examples of the second scenario include a reservoir’s pri-
harmonized v1.0 and GRanD for an expanded inclusion of            mary and secondary or auxiliary dams such as the Boon-
the largest dams and (b) the reservoir boundaries for most        ton Dam and the Parsippany Dike (40.884◦ N, 74.408◦ W)
(87 %) of the dam points based on a one-to-one relationship       in New Jersey and multiple controls for one reservoir such as
between dams and reservoirs. Due to geocoding challenges,         Veersedam and Zandkreekdam for Veerse Meer (51.549◦ N,
GeoDAR v1.0 spatially resolved about 40 % of the dams             3.678◦ E) in the Netherlands. Although “duplicates” in this
in the WRD. However, these georeferenced locations were           scenario refer to different dam bodies, including them could
quality controlled, and after the harmonization with GRanD,       lead to double or multiple counting of the storage capacity of
v1.1 captures a total storage capacity of 7384 km3 , a mag-       the same reservoir, and similar to the production of GRanD,
nitude comparable to the full storage capacity of the WRD.        our goal was to link one reservoir to one dam (if possible).
While GeoDAR v1.1 can be considered to be a version that          After removing the identified duplicates, the cleaned WRD
supersedes v1.0, the latter was, in principle, georeferenced      contains 56 815 unique dams or reservoirs. These dams have
independently from GRanD. We opted to release both ver-           an accumulative storage capacity of 7328 km3 based on the
sions so users have the flexibility to decide whichever works     original WRD attribute values (which are occasionally miss-
better for their cases and potentially improve the harmoniza-     ing or erroneous) or 7720 km3 after replacement or correc-
tion.                                                             tion by Wada et al. (2017) and GRanD (see Sect. 2.4). Un-
   Due to proprietary restrictions, neither GeoDAR version        less otherwise described, the ICOLD WRD mentioned in the
releases any WRD attributes. Instead, we offer an option          following text refers to the version after duplicate removal.
for users if they need to acquire the attributes: upon indi-      We acknowledge that owing to the challenges of lacking ex-
vidual request we may assist the user who has purchased           plicit spatial information and occasional attribute errors in
the WRD (https://www.icold-cigb.org/GB/world_register/            the WRD, our duplicate removal is not perfect and may have
world_register_of_dams.asp, last access: 13 March 2019) to        misidentified or missed some duplicate dams.
associate the GeoDAR ID with the ICOLD “International                We then compared the unique ICOLD WRD records
Code”, through which WRD attributes can be linked to each         against a collection of georeferenced dam registers we ac-
GeoDAR feature (see Sects. 3.3 and 6 for more details). Even      quired from regional water authorities and agencies. When
without the proprietary WRD attributes, GeoDAR offers one         the attribute information of a WRD dam matched that in
of the most extensive and spatially resolved global inventory     a regional register, the spatial coordinates from the latter
of dams and reservoirs, which may benefit a variety of appli-     were “borrowed” to the WRD record. We term this pro-
cations in hydrology, hydropower planning, and ecology.           cess “geo-matching”, which resulted in the georeferencing
                                                                  of 13 190 WRD dams. For the remaining dams in the WRD,
                                                                  we applied the alternative approach, “geocoding”, which
2     Methods
                                                                  transforms a nominal location (such as the dam or reser-
2.1    Definitions and overview
                                                                  voir address formulated by ICOLD attribute information)
                                                                  to a pair of spatial coordinates. The tool we used to im-
We aim to georeference (i.e., acquire the latitude and longi-     plement geocoding was the Google Maps geocoding API
tude of) each dam listed in the ICOLD WRD by using the            (http://developers.google.com/maps, last access: 14 Febru-
nominal location (e.g., a descriptive address for a dam or        ary 2022). The geocoding process successfully retrieved the
reservoir) available in the WRD attributes. Examples of the       spatial coordinates of another 9338 WRD dams. The com-
attributes that are important for georeferencing include the      bined output from both geo-matching and geocoding were
names of the dam and reservoir, the administrative divisions      next collated with the spatial coordinates and reservoir stor-
the dam is affiliated with, and the name of the impounded         age capacities of 133 WRD dams larger than 10 km3 as doc-
river. Using such attribute information, spatial coordinates of   umented in Wada et al. (2017). These processes resulted in
a dam may be either (a) queried from an existing register         GeoDAR v1.0, a total of 22 560 georeferenced WRD dam
or inventory where dam records were already georeferenced         points with an accumulative storage capacity of 6441 km3
and verified or (b) estimated through a geocoding service that    (accounting for more than 80 % of that in the ICOLD WRD).
can convert nominal locations to numeric spatial coordinates.     The Venn diagram in Fig. 2a provides an overview of the log-
Our preference was the former when possible to optimize the       ical relations among the georeferencing sources and methods
georeferencing accuracy.                                          for GeoDAR v1.0.
   The schematic procedure of GeoDAR production is illus-            To further improve our spatial inventory of the world’s
trated in Fig. 1. We started by removing duplicate records        largest dams, we performed a harmonization between the

https://doi.org/10.5194/essd-14-1869-2022                                        Earth Syst. Sci. Data, 14, 1869–1899, 2022
1872                                                                                                        J. Wang et al.: GeoDAR

Table 1. GeoDAR product versions and components.

     Version    Description       Component         Acquisition sources            Count    Storage capacity   Reservoir polygon
                                                    and methods                                       (km3 )          area (km2 )
     v1.0       Georeferenced     Dam points        Geo-matched via regional      13 149             1308.2                     –
                ICOLD                               registers
                                                    Geocoded via Google Maps        9278             1232.4                     –
                                                    API
                                                    Supplemented by Wada et          133             3900.0                     –
                                                    al. (2017)
                                                    Total                         22 560             6440.6                     –
     v1.1       Harmonized        Dam points        GeoDAR v1.0 alone             17 480               507.2                    –
                ICOLD and                           (excluding overlap with
                GRanD                               GRanD v1.3)
                                                    GRanD v1.3 and GeoDAR           5080             6006.0                     –
                                                    v1.0 (overlap between the
                                                    two)
                                                    GRanD v1.3 and other            1414               603.0                    –
                                                    ICOLD (not georeferenced
                                                    in GeoDAR v1.0)
                                                    GRanD v1.3 alone (exclud-        809               267.7                    –
                                                    ing overlap with the ICOLD
                                                    WRD)
                                                    Total                         24 783             7383.8                     –
                                  Reservoir         GRanD v1.3 reservoirs           7120             6717.7             446 525.2
                                  polygons
                                                    HydroLAKES v1.0                 7184               259.8             13 661.9
                                                    UCLA Circa 2015 Lake In-        7211               238.5             36 126.6
                                                    ventory
                                                    Total                         21 515             7216.1             496 313.8

Figure 1. Schematic flowchart of GeoDAR production. Text in roman indicates applied or produced datasets, and text in italics indicates
methods or procedures.

dam points in GeoDAR v1.0 and GRanD v1.3. The harmo-                  2223 dam points, including 1414 associated with the WRD
nization aimed at merging both datasets, removing duplicates          but not georeferenced in GeoDAR v1.0. With removal of du-
in the overlapped portion between them, and when possi-               plicates, this harmonization led to a total number of 24 783
ble associating new dams supplemented by GRanD with the               georeferenced dam points, with an accumulative storage ca-
corresponding WRD records. This process identified another            pacity of 7384 km3 . An overview of this harmonization pro-

Earth Syst. Sci. Data, 14, 1869–1899, 2022                                            https://doi.org/10.5194/essd-14-1869-2022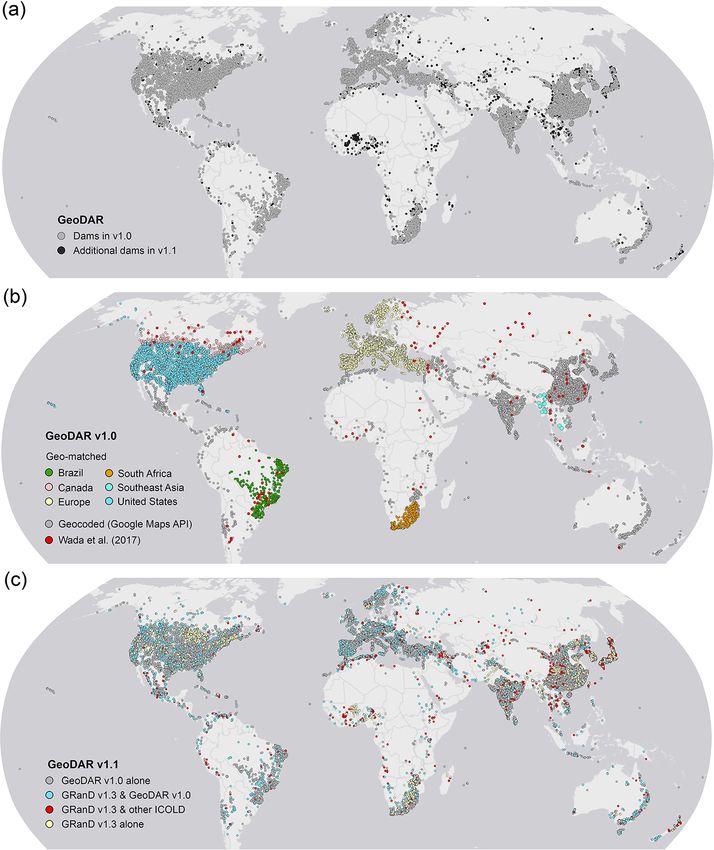
J. Wang et al.: GeoDAR                                                                                                        1873

                                                                    2.2   Geo-matching regional registers

                                                                    The ICOLD WRD was a collective contribution from more
                                                                    than 100 member nations, some of which also release de-
                                                                    tailed and publicly accessible dam registers that have been
                                                                    georeferenced. These regional and local registers, with reli-
                                                                    able spatial coordinates already provided for each dam, were
                                                                    our preferred sources for georeferencing the WRD. Since
                                                                    this type of register is not available for most countries, we
                                                                    searched several water authority and project websites and
                                                                    collected seven georeferenced regional registers or invento-
                                                                    ries that are open-access. Their names, sources, and numbers
                                                                    of documented dams are summarized in Table 2.
                                                                       These seven registers and inventories cover Brazil,
                                                                    Canada, the United States, 31 European countries (includ-
                                                                    ing part of Russia), South Africa, and part of Southeast Asia
                                                                    (Cambodia and Myanmar), with a total dam count of more
                                                                    than 126 000. Besides spatial coordinates, each of these reg-
                                                                    isters also provides attributes for their documented dams,
                                                                    which were required by the geo-matching process. While
                                                                    other dam inventories could be available, our geo-matching
                                                                    effort for GeoDAR v1.0 was focused on these collected ones.
                                                                    However, we referred to additional registers or inventories
                                                                    from China, India, and Japan (Table 2) for the validation
                                                                    of our WRD geocoding (see “Validation”). For these addi-
                                                                    tional regional registers, it was either inconvenient to bulk-
                                                                    download the dam records, or we were legally restricted from
                                                                    releasing their dam coordinates. Therefore, we only used
                                                                    these registers for the purpose of validation.
                                                                       The procedure of geo-matching is illustrated in Fig. 3.
                                                                    Given each regional register, our goal was to find its match-
                                                                    ing records from the subset of the ICOLD WRD for the same
Figure 2. Venn diagrams illustrating the logical relations among
                                                                    region, by cross-checking value similarities for several key
georeferencing data sources and methods for GeoDAR. (a) Geo-        attributes between the two datasets. On one hand, the com-
DAR v1.0 and (b) GeoDAR v1.1 (dams only). Boxes indicate the        pared attributes must be mutually available in both datasets.
final subsets in each GeoDAR version, and the arrows point to the   On the other hand, the attributes should cover various themes
georeferencing sources or methods. Topology of the shapes illus-    so that in combination, they are able to disambiguate records
trates logical relations among the data and methods (shape sizes    that represent different dams but may coincide in certain at-
were not drawn to scale of the data volumes).                       tributes. Taking both requirements into account, the key at-
                                                                    tributes used include the dam and reservoir names, multiple
                                                                    levels of administrative or political divisions for the dam, and
                                                                    the dam’s completion year. The river on which the dam was
                                                                    constructed was also considered for all regions except Cam-
cess is illustrated by the Venn diagram in Fig. 2b. Finally,        bodia as the register does not contain such an attribute. For
the reservoir polygons for each of the georeferenced dams           each of the key attributes, we considered values in the WRD
were retrieved as thoroughly as possible from three global          and the regional register agreeing with each other if the sim-
water body datasets: GRanD v1.3 reservoirs (Lehner et al.,          ilarity score between the value sequences exceeded ∼ 85 %
2011), HydroLAKES v1.0 (Messager et al., 2016), and the             (meaning that there are more than eight pairs of identical el-
Landsat-based UCLA Circa 2015 Lake Inventory (Sheng et              ements, with consideration of their orders, between two 10-
al., 2016). These nearly 25 000 dam points and their associ-        character sequences). This similarity threshold tolerated mi-
ated reservoir polygons constitute GeoDAR v1.1. Details of          nor variations in spelling that may occur among different data
production processes, including quality assurance and qual-         sources. If an agreement was not reached between the two
ity control (QA/QC), are included in the following method           full sequences (e.g., “Maharashtra Pradesh” and “Maharash-
sections.                                                           tra”), the similarity was then tested at the level of the main

https://doi.org/10.5194/essd-14-1869-2022                                          Earth Syst. Sci. Data, 14, 1869–1899, 2022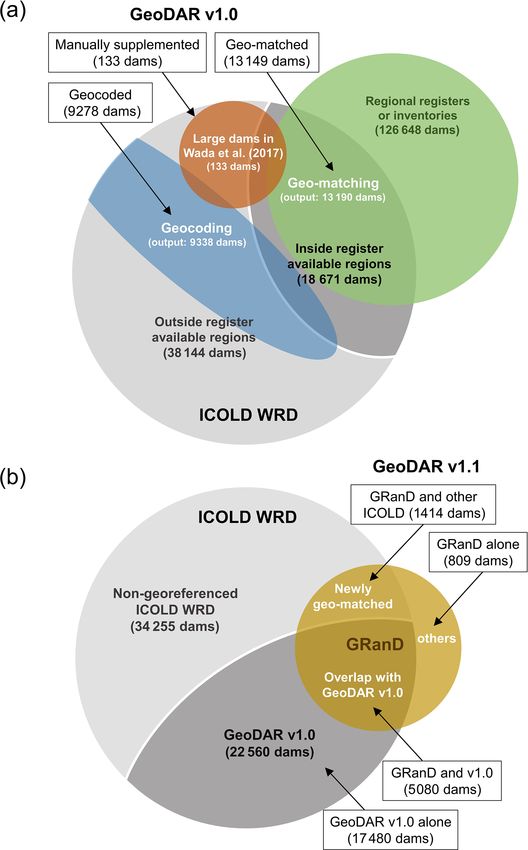
1874                                                                                                                                      J. Wang et al.: GeoDAR

Table 2. Regional registers or inventories for geo-matching and the validation of geocoding.

                       Region               Register or source                                         Dam count
                                                                             Regional register         ICOLD WRD              Geo-matched
                       Geo-matching
                       Brazil               RSB (SNISB, 2017)                             23 630                   1345          668 (50 %)
                       Cambodia             ODC (2015)                                        73                      7            3 (43 %)
                       Canada               CanVec (NRC, 2017)                               843                    648          435 (67 %)
                       Europe               MARS (2017)                                    5043                    6671         3981 (60 %)
                       Myanmar              ODM (2018)                                       254                     33           14 (42 %)
                       South Africa         LRD (DWS, 2019)                                5592                    1105          842 (76 %)
                       United States        NID (USACE, 2018)                             91 213                   8862         7247 (82 %)
                       Total                                                             126 648                 18 671       13 190 (71 %)
                       Geocoding validation
                       China                NPCGIS (2021)                          Not counted                   23 783                       –
                       India                NRLD (2019)                                  5723                     5074                        –
                       Japan                JDF (2021)                                   2349                     3089                        –
                     Register or source abbreviations are as follows: Relatório de Segurança de Barragens (RSB; Dams Safety Report of Brazil),
                     Open Development Cambodia (ODC), Managing Aquatic ecosystems and water Resources under multiple Stress project
                     (MARS), Open Development Myanmar (ODM), List of Registered Dams (LRD) of South Africa, National Inventory of
                     Dams (NID) of the US, National Platform for Common Geospatial Information Services (NPCGIS) of China, National
                     Register of Large Dams (NRLD) of India, and Japan Dam Foundation (JDF). Regional inventories were collected with
                     partial reference to the Global Dam Watch website (http://globaldamwatch.org, last access: 1 March 2022; Mulligan et al.,
                     2021). Statistics for regional registers are based on records with valid geographic coordinates, and statistics for the ICOLD
                     WRD are based on records after duplicate removal. See full registers, references, and download links in the reference list.

subsets of the sequences in order to increase the matching                             ple, high confidence would require a unanimous agreement
success.                                                                               on all key attributes. However, this ideal scenario was often
   One of the geo-matching challenges was that the levels of                           unnecessary and sometimes impossible. One of the reasons is
political or administrative divisions are not always compara-                          that the key attributes do not always have valid values. In the
ble or consistent between the WRD and the regional regis-                              WRD, for instance, the values of “nearest town” for nearly all
ters. In the WRD, the divisions were provided at the levels                            (> 99 %) US dams are missing. While this attribute is avail-
of country, state/province, and the nearest town/city, which                           able for many other dams, the nearest town/city is not neces-
are inconsistent with some of the registers. For example, the                          sarily the division administrating or containing the dam. An-
register for Brazil (Dams Safety Report in 2017) provides                              other reason is that our collected multi-source datasets were
the finest division at the county level, whereas the European                          not collated by a universal standard. As a result, inherent dis-
inventory (from the MARS (Managing Aquatic ecosystems                                  crepancies of the attribute definitions and/or values may exist
and water Resources under multiple Stress) project) docu-                              among the datasets. One example is the dam’s “completion
ments no divisions below the national level. To improve the                            year”, which could be ambiguous between the year when the
feasibility in division comparison, we performed a “reverse                            dam construction was concluded and the year when the dam
geocoding” for each georeferenced regional register using                              operation was initiated or commissioned. These two defini-
the Google Maps geocoding API. Opposite to regular (or                                 tions do not necessarily lead to the same year. To address
“forward”) geocoding, which converts a nominal location                                such inconsistencies, we defined a baseline scenario that re-
to numeric spatial coordinates, this reverse geocoding con-                            quired any pair of matched WRD and regional records to
verted the spatial coordinates of each dam documented in the                           agree on the following:
register to a parsed address that contains administrative di-
                                                                                           – dam or reservoir name;
visions at consecutive levels. These multi-level divisions and
subdivisions were appended to the original regional registers                              – country and state/province if values are valid; and
(Fig. 3), thus enabling a more flexible and complete compar-
ison with the WRD attributes and thus an increased success                                 – at a minimum, either (a) completion year or river if the
rate of geo-matching.                                                                        town/city values disagree or are invalid or (b) town/city
   We considered a WRD record to match a regional record if                                  when completion years and rivers do not both disagree.
their agreements on the key attributes warranted reasonable                            In compliance with this baseline, we implemented an auto-
confidence that the two records are the same dam. In princi-                           mated QA to filter out any matching errors and optimize the

Earth Syst. Sci. Data, 14, 1869–1899, 2022                                                                   https://doi.org/10.5194/essd-14-1869-2022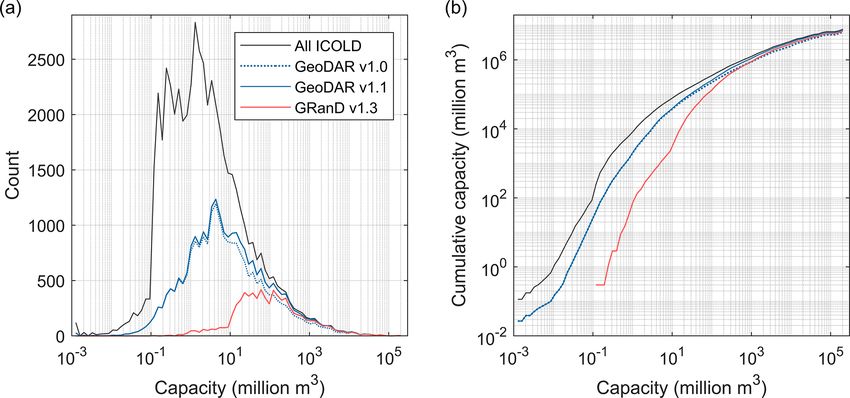
J. Wang et al.: GeoDAR                                                                                                               1875

Figure 3. Schematic procedure of geo-matching regional registers. Text in roman indicates applied or produced datasets, and text in italics
indicates methods or procedures.

matching accuracy for each WRD record. In brief, any match              to observe any water infrastructure at the location of a correct
that did not meet the baseline scenario was removed, and                match, we took a conservative action and removed the match.
the remaining geo-matched pairs were ranked to three dis-               We admit that this might mistakenly delete some of the struc-
crete QA levels (M1, M2, and M3) according to the qual-                 tures (e.g., small run-of-the-river hydropower stations, weirs,
ity of attribute agreements (see definitions in Table S1 in             and diversions) that are too small to be visible from Google
the Supplement). As the QA rank increases (from M3 to                   Map imagery. Our manual QC identified ∼ 4 % error in the
M1), agreements on the key attributes improved from the                 geo-matched WRD records, most of which came from QA
baseline to the ideal scenario (i.e., a unanimous agreement).           rank M3. After removing these errors, the geo-matching pro-
If a WRD record was matched to multiple records in the                  cess concluded with a total of 13 190 WRD records georefer-
regional register, the QA selected the match with the best              enced (Fig. 3), including 3238, 6987, and 2965 for QA ranks
rank. This way, each georeferenced WRD record was only                  M1, M2, and M3, respectively (Table S1 in the Supplement).
matched to the best-ranking regional record. Users may refer            The success rate, i.e., the number of geo-matched dams as a
to the provided QA ranks as a measure of the reliability of             percentage of the number of WRD records, varies from about
each geo-matched location. It is worth noting that our geo-             40 % in Southeast Asia to about 80 % in South Africa and
matching purpose was to acquire the spatial coordinates of              the US (Table 2), with an overall success of 71 % in all geo-
any matched WRD record from the regional register rather                matched regions (Fig. 3).
than collating or correcting any existing attribute values. In
other words, some of the WRD and regional records may                   2.3   Geocoding via Google Maps
actually refer to the same dams but were matched unsuc-
cessfully due to major discrepancies between their attribute            The subset of the ICOLD WRD that was not geo-matched in-
values. This led to a conservative success rate in our auto-            cludes the remaining 5481 (29 %) dams in the geo-matched
mated geo-matching. More technical details about QA are                 regions and the entire 38 144 dams in the other regions of
given in our Python scripts at https://github.com/surf-hydro/           the world (Fig. 2a). For these dams, we applied the Google
georeferencing-ICOLD-dams-and-reservoirs (last access:                  Maps geocoding API, a sophisticated cloud-based geocod-
13 March 2021).                                                         ing service, to retrieve the spatial coordinates of each dam as
   Following the automated QA, we performed a manual QC                 thoroughly and accurately as possible. To do so, we designed
to reassure the accuracy of the geo-matching results. We                a recursive geocoding procedure that implemented three pri-
went through each geo-matched WRD record to examine                     mary steps on each dam: forward geocoding, reverse geocod-
whether its attributes (e.g., dam or reservoir name, admin-             ing, and QA filtering. The purpose of each of the steps and
istrative locations, river name, construction year, and storage         their logical relations are illustrated in Fig. 4.
capacity) indeed agreed with those of the regional source. If              The forward geocoding (see Sect. 2.1 for definition) used
an evident discrepancy was identified, the “match” was re-              the text address of each dam as the input, which we format-
moved or corrected in the final product. Although we made               ted by concatenating the WRD attribute values, to output the
every endeavor to be as rigorous as possible, remnant match-            latitude and longitude of the dam. The WRD attributes used
ing errors may still exist due to the challenges of incomplete-         for address formatting include dam name, reservoir name,
ness and possible errors in the attribute information (refer to         state/province, and country. “Nearest town” was excluded
Sect. 4 for accuracies). For occasional cases that a dam was            because it is not always the township administrating the dam
matched correctly to the register attributes but misplaced due          or reservoir. Together with the spatial coordinates, the for-
to poorer quality of the spatial coordinates in the register, we        ward geocoding also returned a Google Maps address asso-
tried to adjust or, if possible, correct the register’s spatial co-     ciated with the coordinates, which was parsed to individual
ordinates using the best possible resources (such as Google             components including feature name, street name, and polit-
Maps and other open-source documents). If we were unable                ical divisions. These output address components, in return,
                                                                        provided valuable information for QA: if the geocoded coor-

https://doi.org/10.5194/essd-14-1869-2022                                               Earth Syst. Sci. Data, 14, 1869–1899, 2022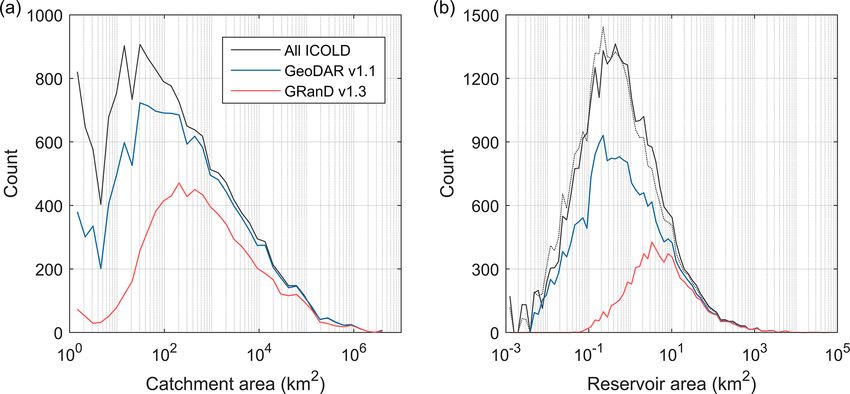
1876                                                                                                               J. Wang et al.: GeoDAR

Figure 4. Schematic procedure of geocoding using Google Maps API. Text in roman indicates applied or produced datasets, and text in
italics indicates methods or procedures. The dashed line arrow indicates that this step is not always necessary.

dinates are correct, the associated output address components             a unanimous agreement on all address components. How-
should agree well with those of the WRD input. However, we                ever, the minimum rank (C5) only required the agreement on
noticed that address components from forwarding geocod-                   the feature name, which is a more flexible baseline in com-
ing are often limited in terms of division levels. To comple-             parison with that for geo-matching. This was because some
ment this limitation, we also utilized reverse geocoding (see             of the large reservoirs, particularly those on or near politi-
Sect. 2.2 for definition) to convert the coordinates from for-            cal boundaries, have shared or ambiguous divisions, and the
ward geocoding to an updated address (sometimes with more                 ambiguity might be further amplified by the output coordi-
complete division levels). The address components from both               nates, which could fall in anywhere from the dam to across
forward and reverse geocoding were combined and are here-                 the reservoir water surface. In addition, some of the outputs,
after referred to as the “output address”.                                regardless of agreement on the address components, are not
   Similar to geo-matching, we employed a QA filter to ap-                dams or reservoirs. We therefore included another baseline
proach the optimal geocoding result. This process first ar-               filter which aimed to remove such errors by analyzing the
ranged the attributes of each WRD record to several address               feature type information in the geocoding output (see scripts
formats as they could result in different geocoding outputs.              in “Code availability”). Although the QA process was de-
The address arrangements are listed in Table S2 in the Sup-               signed to be automated, we still manually enforced hundreds
plement, and their preference order is rationalized in the Sup-           of the initial outputs, many of which had returned feature
plement. Each of these WRD addresses was used iteratively                 names in native languages, to pass the baseline filters. As a
for both forward and reverse geocoding (as described above).              result, our QA process yielded more than 16 000 geocoded
Their geocoded spatial coordinates were then ranked to five               WRD records, each with the optimal spatial coordinates and
discrete QA levels based on how well the input and output                 the corresponding QA rank.
addresses agree with each other (C1 to C5 in Table S3 in the                  To complement the QA process, we then conducted a rig-
Supplement). The iteration could be terminated if the highest             orous QC to correct and/or remove the remaining geocod-
QA rank was achieved; otherwise, the coordinates that ren-                ing errors. We considered a geocoding error to be a location
dered the best possible QA rank were used as the geocoding                where (a) no dam or reservoir could be visibly verified from
result.                                                                   Google Earth or Esri images, or (b) the WRD attribute in-
   As explained in Table S3 in the Supplement, the compared               formation is inconsistent with the feature or division labels
address components include the name of the feature and its                on Google Maps. In such cases, we usually first attempted
affiliated political divisions from town/city to country levels.          to re-geocode the dam manually (such as by directly using
Consistent with geo-matching, we considered a component                   the Google Maps interface) before deleting this error. It is
to be agreed on if the similarity of its values from both input           important to clarify that the georeferenced coordinates, al-
and output addresses exceeds ∼ 85 %. Since the nearest town               though referred to as ”dam points” in our data product, do not
in the WRD was not used for forward geocoding, we treated                 always fall on the dam bodies. While the geo-matched coor-
it as an “independent reference” for validating the township              dinates from regional registers are usually on or close to the
component in the output address. Although the town or city                dams, the geocoded coordinates, depending on the address
near the dam (from the WRD) does not always coincide                      input (Table S2 in the Supplement) and the available Google
with that administrating the dam (from the geocoding out-                 Maps information, could be located on the associated reser-
put), their occasional agreement would strengthen our confi-              voir. Note that the latter case was not considered an error,
dence of the geocoded coordinates if other components were                but for improved locations, we manually adjusted some of
also well matched between the WRD input and the geocod-                   the georeferenced coordinates more towards the dams. Due
ing output. For this reason, we opted to include the town-                to China’s GPS shift problem (e.g., misalignment between
ship comparison as a supplementary criterion in the geocod-               the street maps and satellite imagery on Google Maps), the
ing QA process. The highest QA rank (C1) corresponds to                   geocoded points across mainland China often exhibit system-

Earth Syst. Sci. Data, 14, 1869–1899, 2022                                                  https://doi.org/10.5194/essd-14-1869-2022
J. Wang et al.: GeoDAR                                                                                                      1877

atic offsets of roughly 500 m or more from their actual dam or         We next compared the storage capacities of each of the
reservoir features. For such Chinese dams, we tried to reduce       133 dams in Wada et al. (2017) with those in the WRD and
their geocoding offsets by manually relocating the coordinate       identified 21 of them exhibiting substantial discrepancies be-
points to their correct dams or reservoirs. Our QC process          tween the two datasets (including 3 dams without capacity
ended up removing about 42 % of the originally geocoded             values in the WRD). We then collated their storage capacities
dams, most of which stemmed from relatively low QA ranks            with other documents (e.g., regional inventories, GRanD, and
(see statistics in Table S3 in the Supplement). The com-            Wikipedia) and concluded that WRD may supersede Wada
plete geocoding procedure resulted in 9338 georeferenced            et al. (2017) in the accuracy of storage capacity for 5 of the
and quality-controlled WRD records, with an overall success         21 dams. Except these five dams, the original WRD capaci-
rate of 21 %.                                                       ties were replaced by those in Wada et al. (2017). More de-
                                                                    tailed data collation and verification for Wada et al. (2017)
2.4     Supplementation with other global inventories
                                                                    are given in Table S4 in the Supplement (full spreadsheet
                                                                    available at https://doi.org/10.5281/zenodo.6163413; Wang
The outputs from both geo-matching and geocoding, a to-             et al., 2022). The entire supplementation process, includ-
tal of 22 528 georeferenced ICOLD WRD records (Fig. 2a),            ing adding new dams, updating existing dam coordinates,
were further supplemented or harmonized by two global               and correcting reservoir storage capacities, increased the to-
dam or reservoir inventories to improve our inclusion of the        tal storage capacity of our georeferenced dams by 15 %, and
world’s largest dams. We considered this process necessary          70 % of the capacity increase comes from the 32 added large
for two reasons. First, our georeferencing process, particu-        dams. For improved clarity, it is worth reiterating that all
larly geocoding via Google Maps API, did not warrant an             dams supplemented by Wada et al. (2017) were also docu-
exhaustive inclusion of the largest dams. This is particularly      mented in the ICOLD WRD. The combined results of geo-
evident for regions where the address and label information         matching and geocoding, after the supplementation from
in Google Maps is either lacking or difficult to pass the au-       Wada et al. (2017), define GeoDAR v1.0, which contains
tomated QA due to language ambiguity or naming discrep-             22 560 georeferenced records in the ICOLD WRD.
ancies. Second, through cross-referencing we noted that the
attribute values of reservoir storage capacity (as well as reser-   2.4.2   Harmonization with GRanD: forming GeoDAR
voir surface area) provided in the ICOLD WRD are occa-                      v1.1
sionally erroneous (also noted by Mulligan et al., 2020), e.g.,
by a factor of 1000, probably caused by unit confusion in           While GeoDAR v1.0 largely exceeds GRanD in dam count, a
WRD compilation. As part of the supplementation and har-            visual comparison of their spatial distributions revealed that
monization process, we also reduced the errors in WRD by            the latter is often complementary to (instead of completely
verifying storage capacities of some of the largest reservoirs      duplicated by) the former in many regions of the world. This
and replacing the WRD capacity values by those of the two           motivated us to perform a systematic harmonization between
global inventories.                                                 the two datasets. The merged version, which we entitled Geo-
                                                                    DAR v1.1, combines the merits of GRanD in documenting
2.4.1    Supplementation with Wada et al. (2017): forming
                                                                    the world’s largest dams and GeoDAR v1.0 in providing ex-
         GeoDAR v1.0
                                                                    tensive spatial details of smaller but more widespread dams.
                                                                       We assumed that GRanD, by having collated multiple
Wada et al. (2017) compiled a list of all 144 large dams with       data sources, is superior to GeoDAR v1.0 in the accu-
a reservoir storage capacity larger than 10 km3 in the world.       racies of both spatial locations and attribute values (par-
Among them, 139 dams were provided with spatial coordi-             ticularly reservoir storage capacity) of the world’s largest
nates. We verified each of the dam locations and made mi-           dams. While this may be true for most cases, we identified
nor adjustments to further assure the quality. The attributes       at least 88 dams in GRanD with possible location errors.
of these 139 dams were then manually compared with those            With the help of several references such as regional reg-
in the ICOLD WRD. We found that 133 of them were                    isters (Table 2), the recently published Dataset of Georef-
unique records also documented in the WRD, but 32 of them           erenced Dams in South America (DDSA) (Paredes-Beltran
were georeferenced unsuccessfully in our geo-matching or            et al., 2021), Google Maps, and other literature and open-
geocoding procedure. Therefore, we borrowed the spatial co-         access documents, we were able to correct the locations of
ordinates of these 32 large dams in Wada et al. (2017) to sup-      76 of these dams and absorbed the corrected coordinates to
plement what we had georeferenced. The coordinates of the           the harmonization. The other 12 GRanD dams, including 3
other 101 large dams, which we georeferenced successfully           duplicates with other dams and 9 we were unable to cor-
(41 from geo-matching and 60 from geocoding), were also             rect the locations for, were excluded from the harmonization.
overwritten by those in Wada et al. (2017) to double-assure         What was also excluded are another five dams in GranD that
and improve their spatial accuracies. This supplementation is       were subsumed or replaced by newer dams. For user conve-
illustrated by the Venn diagram in Fig. 2a.                         nience, we released these ∼ 90 GranD dams together with

https://doi.org/10.5194/essd-14-1869-2022                                          Earth Syst. Sci. Data, 14, 1869–1899, 2022
1878 J. Wang et al.: GeoDAR
the identified issues and suggested coordinates (if possible) Wada et al. (2017) were overwritten by those of the overlap-
in Table S5 in the Supplement (full spreadsheet available at ping dams in GRanD (if the GRanD values are valid). This
https://doi.org/10.5281/zenodo.6163413; Wang et al., 2022). correction led to a minor increase of 86 km3 (1.2 %) in the to-
Using the adjusted GRanD data (7303 points), the harmo- tal reservoir storage capacity. Eventually, the remaining 809
nization (Fig. 5) aimed at (a) improving spatial coordinates dams in GRanD, which were not found in the WRD, were ap-
of the dam points in GeoDAR v1.0, (b) adding WRD dams pended to our georeferenced WRD so that the final inventory
that are not georeferenced in GeoDAR v1.0 but are included absorbed the entirety of GRanD (excluding 17 dams we were
by GRanD, (c) reducing storage capacity errors in the geo- unable to utilize; Table S5 in the Supplement). It is worth
referenced WRD, and (d) absorbing the remaining GRanD noting that similar to geo-matching (Sect. 2.2), our attribute
dams that are not documented in the WRD. Detailed pro- association could be conservative, meaning that some of the
cessing for each of the objectives is given below. dams appended from GRanD might be documented in the
First, when a dam in GeoDAR v1.0 also exists in GRanD, remaining WRD (the subset not georeferenced successfully).
the spatial coordinates of the former were replaced by The complete harmonization process, combining the above
those of the latter. We implemented a two-step procedure to three steps, led to a total of 24 783 georeferenced dams in
identify the overlapping dams between GeoDAR v1.0 and GeoDAR v1.1 (Fig. 2b).
GRanD. Step 1 was based on attribute association, while
Step 2 utilized spatial query. Specifically, Step 1 detected
the matching records between the WRD and GRanD by as- 2.5 Retrieving reservoir boundaries
sessing their agreements on dam or reservoir names, admin-
istrative divisions, impounded rivers, and completion years. Reservoir polygons of the georeferenced dam points were
The similarity for reservoir storage capacity was also uti- retrieved as thoroughly as possible from three global water
lized in our manual QC. This step was essentially the same body datasets: GRanD reservoirs (Lehner et al., 2011), Hy-
as “geo-matching”, which was used to link WRD records to droLAKES v1.0 (Messager et al., 2016), and UCLA Circa
regional registers for GeoDAR v1.0 (Sect. 2.2). The associ- 2015 Lake Inventory (Sheng et al., 2016). These three water
ation results, after a meticulous QC, identified ∼ 4670 dams body datasets exhibit an increasing spatial resolution: from
in GRanD that were georeferenced in GeoDAR v1.0. For the 7000+ polygons in GRanD reservoirs provided exclusively
remaining GRanD dams, Step 2 utilized their reservoir poly- for GRanD’s dam points to millions of water body polygons,
gons to spatially intersect with the dam points in GeoDAR including both natural lakes and reservoirs, in the other two
v1.0. A distance tolerance of ∼ 5 km was applied to assist the datasets. While HydroLAKES documents 1.4 million water
spatial association and account for possible offsets in Geo- bodies larger than 0.1 km2 (10 ha), the Landsat-based UCLA
DAR v1.0. As part of the QC, the attribute values of each Circa 2015 Lake Inventory further reduced the minimum size
pair (one from GRanD and the other from the WRD) were to only 0.004 km2 (0.4 ha), resulting in another 7.7 million
manually compared to determine whether they are indeed the water bodies on the global continental surface. Accordingly,
same dam. This step identified another 400 or so overlapping we implemented a hierarchical procedure, where the three
dams between the two datasets. In total, we found that Geo- water body datasets were applied in ascending order of spa-
DAR v1.0 overlaps 5080 out of the 7303 dams in GRanD, tial resolution to retrieve the reservoir boundaries with an
and their spatial coordinates were updated to be consistent overall decreasing size.
with those in GRanD. Specifically, GRanD v1.3 provides 7162 valid reservoir
Second, for the remaining 2223 dams in GRanD that do polygons for the 7303 dam points (after coordinate correc-
not overlap GeoDAR v1.0, we assumed that at least part of tions) used for harmonization. These GRanD polygons were
them could be matched to the WRD records not georefer- first assigned to their associated dam points in GeoDAR v1.1
enced in GeoDAR v1.0. Therefore, we performed another through GRanD IDs. Reservoirs of the remaining 17 556 dam
round of attribute association between the remaining sub- points in GeoDAR v1.1, including the 76 GRanD dams with
sets of GRanD and the WRD. After QC, this process iden- corrected locations (Table S5 in the Supplement), were next
tified another 1414 WRD dams that are included by GRanD. retrieved from HydroLAKES when possible. To avoid dupli-
These additional WRD dams, with a total storage capacity of cates in the reservoirs retrieved from different data sources,
603 km3 , were then added to our inventory using the spatial we only used the subset of HydroLAKES that is spatially
coordinates in GRanD. As a result of the first two objectives, independent from (i.e., not intersecting with) GRanD reser-
GeoDAR v1.1 georeferenced 23 974 (42 %) out of the 56 815 voirs. Different from reservoir assignment using GRanD,
dams in the ICOLD WRD, including 6494 that overlap with there was no common attribute ID to pair HydroLAKES
GRanD. polygons with the remaining dam points, so their reservoir
Third, to reduce the impact of possible attribute errors in retrieval relied completely on spatial association. One major
the ICOLD WRD, we next merged the values of reservoir challenge in dam–reservoir spatial association was the ambi-
storage capacity from both the WRD and GRanD to a single guity caused by the offsets between our georeferenced dam
updated attribute, where the original values in the WRD or points and their actual reservoir polygons (see Sect. 2.3).
Earth Syst. Sci. Data, 14, 1869–1899, 2022 https://doi.org/10.5194/essd-14-1869-2022J. Wang et al.: GeoDAR 1879
Figure 5. Schematic procedure of harmonizing GeoDAR v1.0 and GRanD v1.3 to form GeoDAR v1.1 Text in roman indicates applied or
produced datasets, and text in italics indicates methods or procedures.
To tackle this challenge, we designed a procedure con- We followed the automated reservoir retrieval by a man-
taining three rounds of iteration to progressively optimize ual QC to visually confirm that each retrieved reservoir poly-
reservoir-dam association. This procedure was based on two gon was matched to the correct dam point, and if not, we
assumptions, both conditional on a reasonable spatial toler- corrected the association as thoroughly as possible. This vi-
ance. We started with 500 m to be roughly consistent with sual QC was particularly necessary for lake-dense regions,
the Google street map offsets for China. The first assumption including the case of cascade reservoirs immediately down-
was that larger reservoirs are more likely to be documented stream or upstream to each other. While some of the dams,
than smaller ones, in both the ICOLD WRD and Google such as barrages, diversion infrastructure, and dams under
Maps. Therefore, the first round of iteration assigned each construction, do not have visible impoundments (Lehner et
of the dams to the largest water body within the tolerance. al., 2011), we tried to be as meticulous as possible to ver-
This assignment might, however, lead to a situation where ify the orphan dams and recover any missing reservoirs. For
multiple dams were assigned to the same reservoir. To untan- instance, we were able to manually retrieve 10 reservoirs (in-
gle this situation, the remaining iterations assumed Tobler’s cluding 4 completed after 2000) from the UCLA Circa 2015
first law of geography (Tobler, 1970): “everything is related Lake Inventory for the ∼ 70 dams in GRanD v1.3 without
to everything else, but near things are more related than dis- reservoir polygons. We also assigned reservoirs to 68 of the
tant things” (p. 236). Accordingly, for any water body mis- 76 GRanD dams with our corrected spatial coordinates. Al-
takenly associated with multiple dams, the second round of though no new reservoirs were digitized (all original poly-
iteration reassigned the water body to its closest dam, and gons retrieved from the three water masks), we modified the
the other dam(s) within the tolerance, as a result, was/were geometries of some of the reservoirs when necessary. For ex-
left unpaired. To reduce the number of such “orphan” dams, ample, we truncated or split a polygon if we saw its original
a final, third round of iteration assigned the remaining un- extent intruding to another reservoir and dissolved several
paired dams to the next closest water body that was within polygons into a multipart feature if they cover the same reser-
the spatial tolerance and had not been previously associated voir surface. We also replaced hundreds of reservoirs initially
with any dams. If this led to multiple dams associated with retrieved from GRanD and HydroLAKES by the polygons in
one reservoir again, only the dam with the closest proximity the UCLA inventory to improve the boundary accuracy and
to the reservoir was kept. Through experimentation, we opted completeness.
to implement this three-iteration procedure twice, first using
a conservative 500 m tolerance to maximize the accuracy for 3 Product components and usage
most associations and then a 1 km tolerance to further mini-
mize the number of orphan dams. We here provide a detailed documentation of the components
This multi-iteration procedure retrieved roughly 7600 and structure of the GeoDAR versions (v1.0 and v1.1). To fa-
reservoir polygons from HydroLAKES. For the remaining cilitate the description, the two GeoDAR versions and their
dam points left unpaired, we applied the same association component statistics are explained in Table 1, and spatial dis-
procedure to continue retrieving their reservoirs from the tributions of the dam points and reservoir polygons are visu-
high-resolution UCLA Circa 2015 Lake Inventory. Similarly, alized in Figs. 6 and 7.
only the subset that does not intersect with the retrieved Hy-
droLAKES polygons was considered in order to avoid dupli- 3.1 GeoDAR v1.0: dams
cates in the retrieved reservoirs from different datasets. The
use of the UCLA Circa 2015 Lake Inventory retrieved an- GeoDAR v1.0 is a collection of 22 560 dam points georefer-
other 6700 or so reservoirs. enced exclusively for the ICOLD WRD (Fig. 6a). Among
them, 13 149 or 58 % were retrieved from geo-matching
https://doi.org/10.5194/essd-14-1869-2022 Earth Syst. Sci. Data, 14, 1869–1899, 20221880 J. Wang et al.: GeoDAR
regional dam registers, 9278 or 41 % from Google Maps which compares to ∼ 95 % of the cumulative capacity in the
geocoding API, and the remaining 133 largest dams from entire ICOLD WRD (see Sect. 5.1 for more comparisons
the spatial inventory in Wada et al. (2017) (Fig. 6b). WRD with ICOLD). As reported in Table 1, 81 % (6006 km3 ) of
storage capacities of most of these 133 large reservoirs were the total storage capacity in GeoDAR v1.1 is explained by
replaced by the values in Wada et al. (2017) (see Sect. 2.4.1), the 5080 large dams georeferenced in both GeoDAR v1.0 and
and unless stated otherwise, our following statistics on stor- GRanD. The 17 480 smaller dams from GeoDAR v1.0 alone
age capacities were calculated after this replacement. contribute only 7 % (507 km3 ) of the total storage capac-
The total reservoir storage capacity of these dams is ity, which is roughly comparable to the subset from GRanD
6441 km3 , meaning that GeoDAR v1.0 georeferenced 40 % alone (268 km3 ) or the subset from GRanD and other ICOLD
of the 56 815 WRD records but included more than 80 % of records (603 km3 ). These capacity contributions suggest that
their cumulative reservoir storage capacity. The total storage compared to GRanD, the major improvement of GeoDAR
capacity of the 133 largest dams from Wada et al. (2017), lies in the increased number of relatively small dams rather
despite being limited in number, reaches 3900 km3 or 61 % than the increase in total storage capacity of the dams (see
of the cumulative storage capacity in GeoDAR v1.0, and the Sect. 5.2 for more comparisons with GRanD).
other ∼ 40 % capacity was split almost equally between the Different from GeoDAR v1.0, version 1.1 also includes
remaining 22 000+ geo-matched and geocoded dams. Al- reservoir polygons for 21 515 or 87 % of the georeferenced
though the registers used for geo-matching are regional, the dam points (Fig. 7). Reservoir polygons for the remaining
dams in GeoDAR v1.0, as shown in Fig. 6b, are distributed 13 % of the dam points were retrieved unsuccessfully due
in 151 out of the 165 countries or territories in the WRD, to a combination of factors, including limited spatial resolu-
largely owing to our geocoding efforts through Google Maps tions of the applied water masks, missing water occurrence
API. Since the production of v1.0 was largely independent of in the masks (when the reservoir water levels are too low),
other global dam datasets such as GRanD, it can also be used and the fact that some of the dams have no evident water im-
to cross-compare, supplement, and potentially improve other poundments at all. Nevertheless, the retrieved reservoir poly-
dam datasets. Validation of our georeferencing accuracy for gons have a cumulative area of 496 314 km2 , accounting for
v1.0 is provided in Sect. 4. 98 % of the total reservoir area of all georeferenced dams in
GeoDAR v1.1 (reservoir areas without polygons are based
3.2 GeoDAR v1.1: dams and reservoirs
on documented attributes). These retrieved reservoirs corre-
spond to a cumulative storage capacity of 7216 km3 , also ac-
GeoDAR v1.1 consists of (a) 24 783 dam points (Fig. 6a) counting for nearly 98 % of the total storage capacity in v1.1.
representing a full harmonization between GeoDAR v1.0 and These statistics indicate that the reservoirs whose boundaries
GRanD v1.3 and (b) 21 515 reservoir polygons (Fig. 7) based were retrieved unsuccessfully were mostly small in area and
on a one-dam-to-one-reservoir relationship. In these nearly storage.
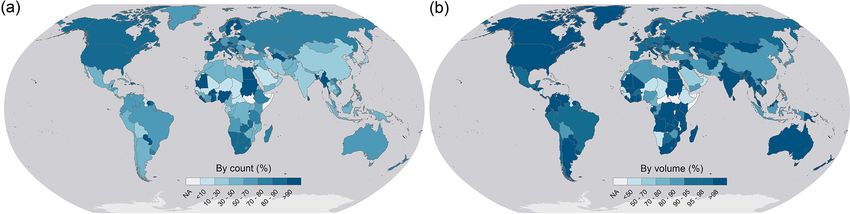
25 000 dam points, 17 480 or 71 % come from GeoDAR v1.0 The numbers of reservoir polygons retrieved from each of
alone, 6494 or 26 % are shared by the ICOLD WRD and the three water body datasets are comparable (about 7100–
GRanD, and the other 809 or 3 % are from GRanD alone 7200 each), but the total reservoir storage capacity and area
(Table 1, Fig. 6c). Among the 6494 shared dams, 5080 were generally decrease with the increasing spatial resolution of
georeferenced in both GeoDAR v1.0 and GRanD, and the the water body datasets (Table 1). As a result, the mean reser-
remaining 1414 were introduced through the harmonization voir polygon size decreased from 63 km2 for those retrieved
with GRanD. This resulted in a total of 23 974 georeferenced from GRanD to 2 km2 from HydroLAKES and 5 km2 from
WRD records (42 % of all WRD records) in GeoDAR v1.1. the UCLA Circa 2015 Lake Inventory. This result is over-
In addition to the expanded number of georeferenced WRD all consistent with the design of our hierarchical procedure
dams, GRanD supplemented another 809 dams which are ex- (Sect. 2.5), where smaller reservoirs were successively re-
clusive of the WRD. The total 2223 dams added by GRanD, trieved with the help of finer water masks. It is important
notated as “GRanD v1.3 & other ICOLD” and “GRanD v1.3 to note that the retrieved polygons do not always represent
only” in Fig. 6c, are distributed worldwide and complement the maximum water extents of the reservoirs because wa-
v1.0, particularly in regions such as Africa and central Asia, ter boundaries in the retrieval sources were not necessar-
where geocoding using Google Maps was challenging. After ily mapped in the maximum inundation periods. For exam-
this ICOLD–GRanD harmonization, the spatial coverage of ple, the UCLA Circa 2015 Lake Inventory was produced
the dam points in GeoDAR v1.1 increased to 155 out of the using Landsat images acquired during “lake-steady” peri-
165 countries in the WRD (also see Table S6 in the Supple- ods (Lyons and Sheng, 2018) and thus represents the aver-
ment). age seasonal extent of each water body (Sheng et al., 2016).
As described in Sect. 2.4.2, we substituted the reservoir Despite not always being the largest water extents, our re-
storage capacities in GRanD for the original capacity values trieved reservoir polygons enhanced the spatial details of
of their overlapping WRD dams. As a result, the total reser- global reservoir locations, using which users can further ex-
voir storage capacity in GeoDAR v1.1 reaches 7384 km3 , pand or refine the water boundaries to their specific needs.
Earth Syst. Sci. Data, 14, 1869–1899, 2022 https://doi.org/10.5194/essd-14-1869-2022You can also read