The impact of mineral dust on cloud formation during the Saharan dust event in April 2014 over Europe
←
→
Page content transcription
If your browser does not render page correctly, please read the page content below

Atmos. Chem. Phys., 18, 17545–17572, 2018
https://doi.org/10.5194/acp-18-17545-2018
© Author(s) 2018. This work is distributed under
the Creative Commons Attribution 4.0 License.

The impact of mineral dust on cloud formation during the Saharan
dust event in April 2014 over Europe
Michael Weger1 , Bernd Heinold1 , Christa Engler2,a , Ulrich Schumann6 , Axel Seifert4 , Romy Fößig3 ,
Christiane Voigt6,7 , Holger Baars1 , Ulrich Blahak4 , Stephan Borrmann7,8 , Corinna Hoose3 , Stefan Kaufmann6 ,
Martina Krämer5 , Patric Seifert1 , Fabian Senf1 , Johannes Schneider8 , and Ina Tegen1
1 Leibniz  Institute for Tropospheric Research, Leipzig, Germany
2 Leipzig  Institute for Meteorology, University of Leipzig, Leipzig, Germany
3 Institute of Meteorology and Climate Research, Karlsruhe Institute of Technology, Karlsruhe, Germany
4 Deutscher Wetterdienst, Offenbach, Germany
5 Forschungszentrum Jülich, Jülich, Germany
6 Deutsches Zentrum für Luft- und Raumfahrt, Institut für Physik der Atmosphäre, Oberpfaffenhofen, Germany
7 Johannes Gutenberg-Universität, Mainz, Germany
8 Max-Planck-Institut für Chemie, Mainz, Germany
a formerly at: Leibniz Institute for Tropospheric Research, Leipzig, Germany

Correspondence: Bernd Heinold (heinold@tropos.de)

Received: 5 July 2018 – Discussion started: 2 August 2018
Revised: 15 November 2018 – Accepted: 19 November 2018 – Published: 11 December 2018

Abstract. A regional modeling study on the impact of desert       IWC were by at least a factor of 2 higher in the relevant
dust on cloud formation is presented for a major Saharan          altitudes compared to the noninteractive model run. We at-
dust outbreak over Europe from 2 to 5 April 2014. The dust        tributed these improvements mainly to enhanced deposition
event coincided with an extensive and dense cirrus cloud          freezing in response to the high mineral dust concentrations.
layer, suggesting an influence of dust on atmospheric ice nu-     This was corroborated further in a significant decrease in
cleation. Using interactive simulation with the regional dust     ice particle radii towards more realistic values, compared to
model COSMO-MUSCAT, we investigate cloud and precip-              in situ measurements from the ML-CIRRUS aircraft cam-
itation representation in the model and test the sensitivity of   paign. By testing different empirical ice nucleation parame-
cloud parameters to dust–cloud and dust–radiation interac-        terizations, we further demonstrate that remaining uncertain-
tions of the simulated dust plume. We evaluate model re-          ties in the ice-nucleating properties of mineral dust affect the
sults with ground-based and spaceborne remote sensing mea-        model performance at least as significantly as including the
surements of aerosol and cloud properties, as well as the in      online representation of the mineral dust distribution. Dust–
situ measurements obtained during the ML-CIRRUS aircraft          radiation interactions played a secondary role for cirrus cloud
campaign. A run of the model with single-moment bulk mi-          formation, but contributed to a more realistic representation
crophysics without online dust feedback considerably under-       of precipitation by suppressing moist convection in southern
estimated cirrus cloud cover over Germany in the compari-         Germany. In addition, a too-low specific humidity in the 7 to
son with infrared satellite imagery. This was also reflected      10 km altitude range in the boundary conditions was identi-
in simulated upper-tropospheric ice water content (IWC),          fied as one of the main reasons for misrepresentation of cirrus
which accounted for only 20 % of the observed values. The         clouds in this model study.
interactive dust simulation with COSMO-MUSCAT, includ-
ing a two-moment bulk microphysics scheme and dust–cloud
as well as dust–radiation feedback, in contrast, led to sig-
nificant improvements. The modeled cirrus cloud cover and

Published by Copernicus Publications on behalf of the European Geosciences Union.
17546                                                          M. Weger et al.: The impact of mineral dust on cloud formation

1   Introduction                                                     studies using remote sensing observations that there is a ro-
                                                                     bust correlation between the presence of mineral dust and the
The Mediterranean and Europe are frequently affected by              efficiency of ice formation, as well as the ice water content
outbreaks of mineral dust, as specific atmospheric circulation       (IWC) in ice clouds (Seifert et al., 2010; Zhang et al., 2018;
patterns over northern Africa and the Mediterranean cause            Zhao et al., 2018). In addition, there is also direct observa-
wind-driven dust emissions over the Sahara and consecu-              tional evidence of mineral dust interacting with cloud mi-
tive transport to the north (e.g., Barkan et al., 2005; Salvador     crophysics and dynamics inside dust-infused baroclinic cy-
et al., 2014). Estimates of annual northern African dust emis-       clone storm clouds, as affected cirrus shields present with a
sions range from 400 to 2200 Tg (Huneeus et al., 2011), of           visible cumuliform texture, exceedingly low cloud-top tem-
which about 10 % are exported to Europe (Shao et al., 2011).         peratures and other peculiar optical properties indicative for
   Mineral dust is an important aerosol constituent (Carslaw         the presence of small ice crystals (Fromm et al., 2016). Sim-
et al., 2010), which influences atmospheric processes. The           ilar findings have emerged from model studies. For exam-
dust particles scatter and absorb solar radiation as well as ab-     ple, Lee and Penner (2010) found a positive correlation be-
sorb and re-emit terrestrial radiation (e.g., Müller et al., 2011;   tween INP concentrations and ice particle number concen-
Köhler, 2017), which alters the atmospheric stratification           trations, as well as ice water path (IWP), by considering ice
and thus can also impact cloud and precipitation formation           nucleation of dust and black carbon in the GCE (Goddard
(Chaboureau et al., 2011; Wang et al., 2013). Moreover, min-         Cumulus Ensemble) model. It is well known that dust par-
eral dust particles directly participate in cloud microphysical      ticle number concentrations can exceed the climatological
processes by acting potentially as cloud condensation nuclei         mean value by a 100-fold over a wide tropospheric height
(CCN) (Bégue et al., 2015; Karydis et al., 2011) and ice-            range during a dust event (Hande et al., 2015). In most oper-
nucleating particles (INPs) (DeMott et al., 2003, 2010; Boose        ational NWP models, however, aerosol interactions are pa-
et al., 2016).                                                       rameterized using preset aerosol concentrations and char-
   Based on numerous field and laboratory experiments, a             acteristics (e.g., the Integrated Forecast System (IFS) radi-
variety of empirical relations to describe the ice-nucleating        ation scheme uses aerosol climatology from Tegen et al.,
properties of mineral dust for application in numerical              1997, and cloud droplet and ice particle number concentra-
weather prediction (NWP) models have been developed so               tions are predefined according to an assumed aerosol back-
far (e.g., Phillips et al., 2008; Niemand et al., 2012; Hi-          ground; ECMWF, 2017). Obviously, these models are chal-
ranuma et al., 2014; DeMott et al., 2015; Ullrich et al., 2017).     lenged during those outbreaks and the forecast performance
The impact of dust particles on cloud microphysical and              is found to be significantly reduced in the presence of mineral
macrophysical properties cannot be generalized as it depends         dust (Schumann et al., 2016). In the past, studies with inter-
on the cloud type considered, the background aerosol compo-          active dust modeling approaches were conducted to quantify
sition and meteorological conditions. In mixed-phase clouds,         the effects of desert dust on weather. Smoydzin et al. (2012)
midtropospheric aerosol entrainment is important to consider         included cloud activation and ice nucleation of mineral dust
(Fridlind et al., 2004), and additional INPs likely acceler-         (diagnostically by the DeMott et al., 2010, parameterization)
ate cloud glaciation and precipitation formation and finally         in the coupled chemistry model WRF-Chem (Weather Re-
shorten cloud lifetime (DeMott et al., 2010).                        search and Forecasting model – Chemistry) to simulate east-
   Cirrus clouds form either by lifting of liquid or mixed-          ern Mediterranean dust outbreaks. Bangert et al. (2012) used
phase clouds across the homogeneous freezing threshold of            the more detailed ice nucleation scheme by Barahona and
235 K (liquid origin) or in situ by a combination of heteroge-       Nenes (2009) with INP properties from Phillips et al. (2008)
neous and homogeneous ice nucleation of super cooled liquid          to include the competition of heterogeneous and homoge-
aerosol (in situ origin) (Luebke et al., 2016; Krämer et al.,        neous ice nucleation for cirrus cloud formation in their simu-
2016). If homogeneous nucleation is primarily involved in            lations of a major dust outbreak over Europe in 2008 with the
the formation of cirrus originating in situ, ice particle con-       regional dust model COSMO-ART (Consortium for Small-
centrations are determined by this process, with a negative          scale Modeling – Aerosols and Reactive Trace gases). Both
correlation between INP concentrations and ice particle con-         studies found changes in mixed-phase cloud microphysics
centrations, cloud albedo and emissivity (negative Twomey            due to mineral dust to various degrees, e.g., more efficient
effect, e.g., Kärcher and Lohmann, 2003). If, however, lifting       cloud glaciation and a decrease in ice particle radii. Using
occurs at low vertical velocities, supersaturation over ice may      ICON-ART (Icosahedral Nonhydrostatic – Aerosols and Re-
never exceed the threshold for homogeneous freezing. In this         active Trace gases) with a similar setup to that of Bangert
case, ice nucleation is determined by deposition freezing of         et al. (2012), Rieger et al. (2017) modeled the dust outbreak
INPs, with the occurrence of the positive Twomey effect in           over Europe in early April 2014 in order to estimate the con-
cirrus originating in situ (Krämer et al., 2016).                    siderably negative impact of dust–radiation, dust–cloud and
   As a result of the various atmospheric interaction modes          combined effects on photovoltaic power generation.
of dust particles, the weather is likely affected by outbreaks          The April 2014 Saharan dust outbreak is also the subject of
of Saharan dust over Europe. It has been shown in various            this modeling study. During this event, various cloud systems

Atmos. Chem. Phys., 18, 17545–17572, 2018                                            www.atmos-chem-phys.net/18/17545/2018/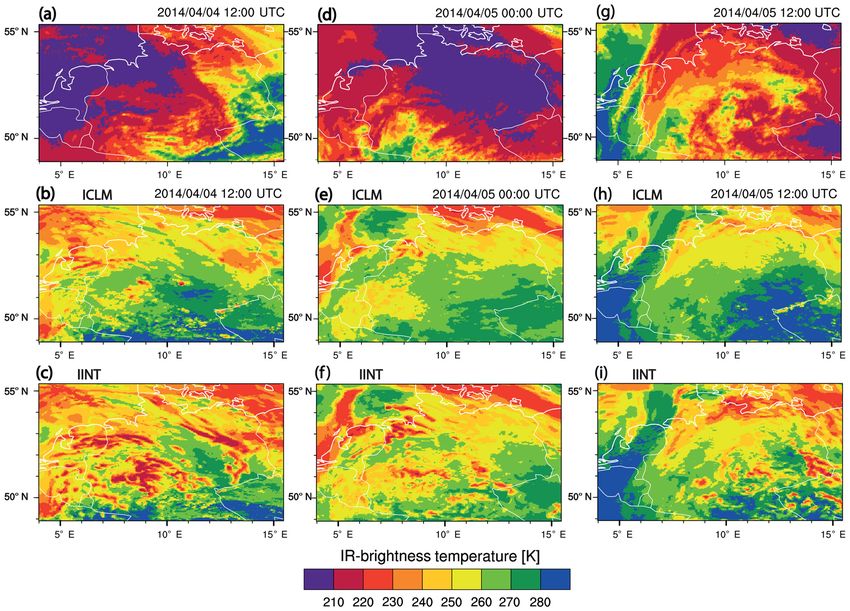
M. Weger et al.: The impact of mineral dust on cloud formation                                                              17547

were present, but most notably, an unusually extensive cirrus      in Doms (2008) and Doms et al. (2011). For the treatment
canopy occurred. The coincidence of these cloud conditions         of cloud processes and precipitation formation an efficient
with the dust plume make it an interesting case to investigate     single-moment bulk water-continuity scheme is used, which
the impact of mineral dust on cloud formation. For the inves-      considers cloud water, rain, cloud ice, snow and optionally
tigation, we use interactive regional dust transport modeling      graupel (not used here) as hydrometeor classes. Conversion
with COSMO-MUSCAT (Consortium for Small-scale Mod-                 processes between these classes, as well as cloud condensa-
eling – MUltiScale Chemistry Aerosol Transport) (Wolke             tion and ice formation, are formulated by simple and efficient
et al., 2004, 2012). Particular focus is put on the treatment      parameterizations, which do not account explicitly for the
of heterogeneous ice nucleation of mineral dust. Specifically      impact of a quantifiable aerosol concentration on these pro-
we investigate (1) how well cloudiness and precipitation are       cesses (i.e., they assume the ubiquitous presence of aerosol
represented in the COSMO model with the operational ra-            particles). As a result, cloud condensation and cloud evapo-
diation and single-moment bulk microphysics parameteriza-          ration is treated by performing saturation adjustment, which
tions without considering dust feedback, (2) whether consid-       is the redistribution of the equivalent amount of water to re-
ering dust–cloud and dust–radiation interactions with a two-       store thermodynamic equilibrium between liquid water and
moment microphysics scheme improves cloud and precipi-             water vapor. This approach is reasonable for warm clouds.
tation representation, and if so, (3) how important the role       In mixed-phase clouds, however, ice nucleation and ice par-
of isolated interaction processes therein is, and (4) how the      ticle growth occurs outside thermodynamic equilibrium, and
choice of the INP parameterization influences the model re-        both processes are therefore parameterized in more detail in
sults. Based on the answers to these questions, we further         COSMO. The underlying assumption therein is an empirical
seek to improve our understanding of cloud formation dur-          relationship between the ice particle number concentration
ing the Saharan mineral dust event. We use a comprehen-            ni and the temperature T , which is a fit to aircraft data from
sive observational data set for model evaluation. It consists of   Hobbs and Rangno (1985) and Meyers et al. (1992):
standard satellite and ground-based remote sensing, and the
unique, rich data set of the campaign ML-CIRRUS (Voigt
et al., 2017), consisting of airborne in situ measurements.        ni = 1 × 10² m−3 exp [0.2 (T − 273.15 K)] .                 (1)
The present study thus expands the work of Rieger et al.
                                                                   Equation (1) is used to diagnose ni as well as the mean diam-
(2017), as it puts the focus on a detailed evaluation of cloud
                                                                   eter Di in the growth equation (e.g., Pruppacher and Klett,
properties during the dust outbreak.
                                                                   2010) for depositional growth and to deduce an ice nucle-
   The paper is structured as follows: in Sect. 2, the inter-
                                                                   ation rate for grid cells not containing any cloud ice (qi = 0):
active dust-transport model COSMO-MUSCAT is described
together with the setup of sensitivity model runs, and an
overview of the observational data available for evaluation                      ni m0i
is given. Section 3 contains a synoptic overview of the Saha-      q̇i, nuc =           .                                      (2)
                                                                                ρair 1t
ran desert dust outbreak in April 2014. In Sect. 4, the model
results are presented in comparison with the available obser-      q̇i, nuc is the mass mixing ratio transferred from the water
vational data and a more detailed discussion of the dust im-       vapor to the ice phase due to heterogeneous ice nucleation
pact on cloud microphysics and cloud development is given.         per time step 1t and involves the assumption of an initial
Finally, in Sect. 5 the main outcomes of the study are sum-        ice particle mass m0i = 1 × 10⁻¹² kg. ρair is the density of
marized, followed by the conclusion.                               air. Equation (2) is only applied if the grid cell tempera-
                                                                   ture is lower than the onset temperature for ice formation
                                                                   Tnuc = 267.15 K. Deposition freezing is limited to temper-
2     Methodology                                                  atures lower than Td = 248.15 K, whereas for temperatures
                                                                   above Td , heterogeneous ice nucleation is the result of con-
2.1     Model description
                                                                   densation freezing, which additionally requires water satura-
For the simulations of dust transport and the effects on           tion.
cloud development, the chemistry transport model MUSCAT                Radiative transfer in COSMO is treated by a δ-two-
(Wolke et al., 2004, 2012) is used, online-coupled to the non-     stream scheme, calculating upward and downward short-
hydrostatic regional NWP model COSMO; version 5.0, of              wave and longwave fluxes in 3 and 5 spectral intervals, re-
the German Weather Service (DWD) (Doms and Baldauf,                spectively (Ritter and Geleyn, 1992). To consider the effects
2015).                                                             of clouds on radiative transfer, a cloud fraction is param-
                                                                   eterized, which encompassed contributions from grid-scale
2.1.1    Operational model configuration                           and subgrid-scale stratiform cloudiness as well as convec-
                                                                   tive cloudiness. Accordingly, modified liquid and ice water
A detailed description of the physical parameterizations ap-       mixing ratios (qsc, c and qsc, i ), containing the subgrid-scale
plied in the operational version of COSMO can be found             contributions, are derived, which are used to calculate optical

www.atmos-chem-phys.net/18/17545/2018/                                                Atmos. Chem. Phys., 18, 17545–17572, 2018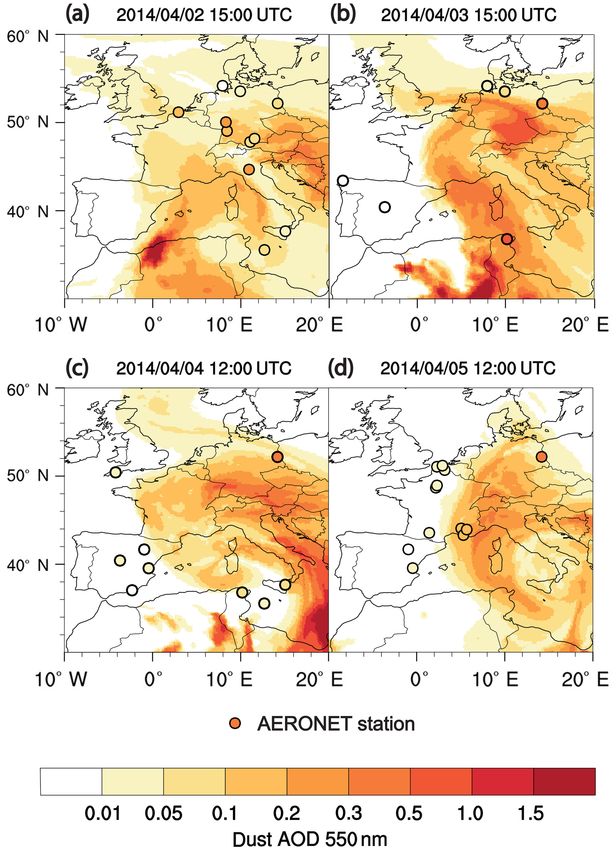
17548                                                         M. Weger et al.: The impact of mineral dust on cloud formation

properties of clouds. Most importantly, the generalized effec-      2.1.3   Dust–cloud interactions
tive diameter D ef is directly related to qsc,c/i via empirical
formulations. Radiative transfer further depends on the verti-      For the interaction of simulated dust with clouds, the
cal alignment of cloud-free and cloud-covered areas in adja-        two-moment bulk microphysics scheme of Seifert and Be-
cent layers. It is assumed that clouds have maximum overlap,        heng (2006) as also implemented in COSMO was modified
unless there is an intermediate layer without any cloudiness.       to include the effects of a variable mineral dust concentra-
In this case clouds are distributed randomly. To include the        tion on cloud activation and heterogeneous ice nucleation.
effects of aerosols, a spatially variable climatological mean       In past modeling studies, aerosol scavenging by activation
aerosol distribution is prescribed, with consideration of five      and aerosol processes inside clouds was usually not consid-
different types of aerosol optical properties (maritime, conti-     ered (e.g., Bangert et al., 2011). As a consequence, cloud
nental, urban, volcanic and background stratospheric).              freezing had to be treated stochastically only depending on
                                                                    cloud droplet number concentrations but not on a variable
2.1.2   Dust scheme                                                 aerosol concentration (Bangert et al., 2012). Field studies,
                                                                    however, have shown a variable interstitial aerosol fraction
Dust emission and transport are computed by the multiscale          increasing toward the cloud edges (Gillani et al., 1995) or in
transport model MUSCAT, including the parameterization of           the presence of ice particles (Verheggen et al., 2007). In this
dust emission and deposition fluxes given in Heinold et al.         work, for a detailed description of in-cloud droplet activa-
(2007), Heinold et al. (2011) and Schepanski et al. (2017).         tion as well as ice nucleation (immersion, contact and depo-
Mineral dust is transported as a passive tracer in five size        sition nucleation), the aerosol concentration na is partitioned
bins with the particle diameter limits at 0.2, 0.6, 1.8, 5.2, 16    into an interstitial nin and cloud-water-scavenged component
and 48 µm. For dust advection, in MUSCAT, a third-order             nsc . Aerosol species considered are mineral dust, soot and
upstream scheme is used along with an implicit–explicit inte-       organics, while the latter two classes are given by prescribed
gration scheme (Knoth and Wolke, 1998; Wolke et al., 2000).         number concentrations (see Table 2). The cloud number con-
The dust source scheme is based on the work of Tegen et al.         centration nc is used to determine nsc , and accordingly if
(2002) and includes the parameterization of the threshold           nc > na , nsc = na , otherwise nsc = nc . In the latter case, the
friction velocity u∗t for particle mobilization. u∗t is dependent   five particle size bins are partitioned by applying weighting
on the soil particle size distribution (Marticorena and Berga-      factors based on data of a case study report by Hallberg et al.
metti, 1995), which is resolved in four size classes (coarse        (1994), which prioritize the larger particle classes.
sand, medium/fine sand, silt and clay) and the surface rough-          Cloud droplet activation is parameterized according to
ness length z0 . To account for the effect of vegetation on         Abdul-Razzak and Ghan (2000) for a multi-mode aerosol,
dust emission, 27 different vegetation types are considered.        consisting of different size classes and different chemical
Vegetation cover is further parameterized according to Knorr        groups. The different chemical composition of dust, soot and
and Heimann (1995), using satellite-based normalized differ-        organics is represented by different hygroscopicity parame-
ence vegetation index (NDVI) data sets (Tucker et al., 2005).       ters κ. We use the following set of hygroscopicity parameters
Based on the vegetation type and cover as well as snow              for dust, soot and organics: 0.14, 0.308, 0.308, respectively.
cover, an effective area Aef for dust emission is calculated.       The parameterization was originally developed for droplet
Soil moisture content, derived from the hydrological fields of      activation at the cloud base, considering the competition of
COSMO, is assumed to suppress dust emission, if exceeding           the different aerosol modes in an ascending air parcel. To
99 %. The frictional velocity u∗ is calculated from COSMO           modify the parameterization for in-cloud conditions, preex-
first-layer winds using surface roughness data from satellite       isting cloud droplets are considered as an additional compet-
retrievals (Prigent et al., 2012). If u∗ > u∗t , dust emission is   ing aerosol mode with the size being the mean droplet di-
allowed and computed with a cubic function of u∗ (Heinold           ameter Dc and with κ ≈ 0. Consequently, only the interstitial
et al., 2007). The potential areas of dust emission are pre-        aerosol component is available for droplet activation.
scribed using a dust source activation frequency mask. This            Heterogeneous ice nucleation in our model is based on em-
is derived from Meteosat Second Generation (MSG) Spin-              pirical parameterizations of the aerosol surface density of ice
ning Enhanced Visible and InfraRed Imager (SEVIRI) dust             nucleation active sites (INASs) nIS (µm−2 ), presuming the
index observations (Schepanski et al., 2017). Dust removal          validity of the singular hypothesis, which assumes instanta-
is treated as dry (Zhang et al., 2001) and wet deposition,          neous ice nucleation events occurring in response to a suffi-
while the latter considers in-cloud and below-cloud scaveng-        cient increase in supersaturation, as opposed to a more de-
ing (Berge, 1993; Jacobson, 1997; Jonson et al., 1998).             tailed stochastic ice nucleation model (see for example Nie-
   Comparisons with results from field studies show that the        dermeier et al., 2011). For desert dust, we use the parame-
model provides a good representation of the different aspects       terization of Ullrich et al. (2017) as default, which can be
of the atmospheric dust cycle (e.g., Heinold et al., 2011).         considered as one of the most accurate to date. It is based
                                                                    on a comprehensive data set gathered by nucleation experi-
                                                                    ments, carried out in the Aerosol Interaction and Dynamics

Atmos. Chem. Phys., 18, 17545–17572, 2018                                           www.atmos-chem-phys.net/18/17545/2018/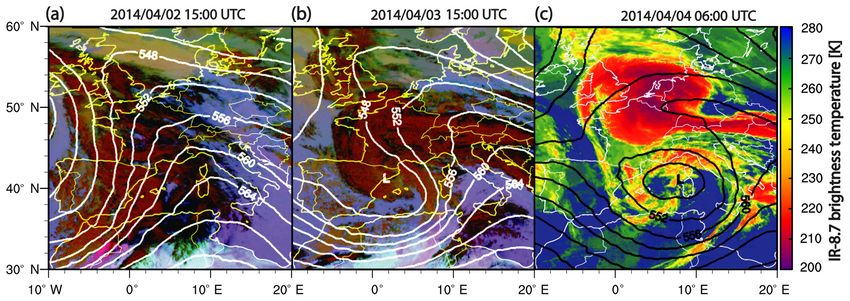
M. Weger et al.: The impact of mineral dust on cloud formation                                                               17549

in the Atmosphere (AIDA) facility (Wagner et al., 2006), and           Therein the expectation value refers to the mean number
a novel algorithm for data evaluation. It is considered to be       of INASs per particle active at temperature T and saturation
an especially reliable parameterization for deposition nucle-       over ice Si . ωk, l is the mean aerosol surface of the consid-
ation as it shows the characteristic u-shape of INAS-density        ered aerosol mode. For contact and immersion freezing, nIS
isolines, which is in accordance with more recent theoreti-         is evaluated at water saturation, as indicated by Si = Siw (T ).
cal work on deposition nucleation (Marcolli, 2014). For soot        The freezing threshold for contact freezing was found to be
and organics, we use the parameterization of Phillips et al.        about 4.5 K higher than for immersion freezing (Shaw et al.,
(2008), which is based on field studies.                            2005), thus in the case of contact freezing a correction term
   Heterogeneous cloud droplet freezing is determined by the        1Tco = 4.5 K is applied in the calculation of nIS . For con-
probability Pfr for a single cloud droplet to freeze; hence, af-    tact freezing, colliding aerosol particles are represented by
ter evolution of model time step 1t, the number of heteroge-        a population of completely inactivated aerosol particles. For
neously frozen droplets is as follows:                              immersion freezing, however, the fraction of already frozen
                                                                    INPs needs to be taken into account by calculating the in-
                                                                    crease in PIN during 1t:
1nc, het = −nc Pfr .                                         (3)

Pfr results from the combined probabilities for immersion
                                                                    1PIN (T , 1Tt ) = Max [0, PIN (T + 1T ) − PIN (T )] .       (8)
(Pim ) and contact freezing (Pco ):
                                                                       Deposition freezing of water vapor on interstitial aerosol
Pfr = 1 − (1 − Pim )(1 − Pco ).                              (4)    particles predominantly takes place in pure ice clouds at
                                                                    Si > 1 and T < 235 K. These restrictions are not explicitly
   In a first-order approximation, Pco is proportional to the       made here, as the empirical INP parameterizations for depo-
number of colliding interstitial aerosol particles with cloud       sition freezing are also valid for higher temperatures. In most
droplets during evolution of model time step 1t. To parame-         cases, however, cloud droplet freezing and deposition nucle-
                                                 l of Ovtchin-
terize the collision rate, the collision kernel 9co                 ation are not expected to occur simultaneously at significant
nikov and Kogan (2000) is used, which includes the attrac-          rates, as at water saturation and for T > 235 K deposition nu-
tive or repulsive forces of Brownian motion, thermophoresis         cleation is not efficient. The number of newly nucleated ice
and diffusiophoresis. It depends on the diameter of colliding       particles in the deposition freezing mode 1ni, dep is calcu-
particles, approximated here as the first moment of the cloud       lated diagnostically according to Seifert and Beheng (2006),
droplet particle size distribution (PSD) and the mean diam-         as a balance equation for interstitial aerosol would be needed
eter of considered aerosol particle size bin l. In Eq. (5), it is   for a prognostical treatment (in opposition to cloud droplet
summed over all aerosol indices for chemical class k and size       freezing, where there is a balance equation for nc ). Thus,
l.                                                                  1ni, dep is limited by the ice and snow particle number con-
                                                                    centrations ni and ns , respectively:
        X k, l     k, l
               l
Pco =    nin 9co PIN    1t                                   (5)
                                                                                        X k, l k, l
        k, l
                                                                    1ni, dep = Max(0,    nin PIN − ni − ns ).                   (9)
   Pim results from immersed potential INPs, which activate                             k, l
if the temperature tendency 1T = T (t + 1t) − T (t) is neg-
                                                                      Finally, the number of heterogeneously frozen ice crystals
ative, which leads to a temporal increase in INP concentra-
                                                                    due to ice nucleation 1ni, het is given as the sum of heteroge-
tions. 1T is diagnosed using the grid-scale vertical velocity
                                                                    neous cloud droplet freezing and deposition freezing:
w and the diagnostic vertical temperature gradient dT /dz,
thus neglecting horizontal temperature advection. Only the
scavenged aerosol component nsc is available for immersion
                                                                    1ni, het = −1nc, het + 1ni, dep .                          (10)
freezing:
                                                                       Homogeneous freezing of cloud droplets is treated as in
      1 X k, l    k, l                                              Seifert and Beheng (2006), with a stochastic approach and
Pim =        n 1PIN    (T , 1Tt ).                           (6)
      nc k, l sc                                                    a temperature-dependent freezing rate constant (Cotton and
                                                                    Field, 2002).
   Both Eqs. (5) and (6) contain the probability PIN of an
aerosol particle to act as an INP, which is based on a Poisson      2.1.4   Dust–radiation interactions
distribution:
                                                                    The computation of short- and longwave radiative fluxes in
                                                                    COSMO considers scattering, absorption and re-emission by
  k, l
       (T ) = 1 − exp{−nIS T , Siw (T ) ωk, l }.

PIN                                                          (7)    aerosols, cloud hydrometeors and trace gases. In interactive

www.atmos-chem-phys.net/18/17545/2018/                                            Atmos. Chem. Phys., 18, 17545–17572, 2018
17550                                                         M. Weger et al.: The impact of mineral dust on cloud formation

COSMO-MUSCAT simulations, it additionally takes into ac-            the model meteorology close to the real synoptic situation.
count the modeled size-resolved dust distribution (Helmert          One cycle consists of 24 h of meteorological simulation, fol-
et al., 2007). The model thus considers the direct radiative        lowed by another 24 h of COSMO-MUSCAT dust simula-
impact and related dynamical feedbacks of the spatially and         tion. This allows enough relaxation time for the meteorolog-
temporally varying atmospheric dust load. Dust optical thick-       ical fields after re-initialization, as only the second half of the
ness is calculated based on the modeled dust concentration          cycle is evaluated. The dust distribution of the previous cy-
by assuming spherical particles. The optical properties of Sa-      cle is used to initialize the following cycle, respectively. The
haran dust are derived from Mie theory (Mishchenko et al.,          dependency of dust emission on surface winds is highly non-
2002) using refractive indices from Sinyuk et al. (2003).           linear. The modeled dust is therefore highly sensitive to un-
   In order to make use of the more detailed two-moment             certainties in surface and soil properties as well as predicted
microphysics information, the single-moment microphysics            wind speed. In order to match satellite- and ground-based ob-
approach of parameterizing cloud optical properties in Ritter       servations of dust optical thickness, the threshold velocity for
and Geleyn (1992) was revised by Dipu et al. (2017). This           dust mobilization is reduced by a factor of 0.63.
way the impact of the spatially and temporally varying size            For the simulation of dust–cloud interactions over cen-
of cloud droplets and ice crystals on cloud optical depth and       tral Europe, COSMO-MUSCAT is run on the inner domain
reflectivity is also accounted for, by using the prognostic ver-    D2 with 2.8 km resolution and with 50 vertical layers. The
sion of the effective diameter D ef of cloud droplets and ice       area spans the coordinate range enclosed within 48.3◦ N,
crystals. For cloud ice, Dief is defined by                         4.0◦ E and 55.3◦ N, 13.0◦ E. The simulation is started on
                                                                    3 April 2014 at 00:00 UTC and run for 60 h without restart.
                                                                    COSMO is initialized and driven with hourly analysis data
         3 IWC
Dief =                                                      (11)    from the operational COSMO-DE run provided by DWD in
         2 ρi σi                                                    order to use driving conditions that are closest to the actual
(e.g., Mitchell et al., 2011), with the specific mass of ice ρi ,   weather situation and benefit from the finer grid spacing. The
the water content IWC and the mean particle cross section           simulated dust fields of D1 are interpolated onto the D2 grid
σi . Assuming shape parameters for ice particles, IWC and σi        and used for initialization of the dust fields of D2, as well
are directly computed from the prognostic variables ni and qi       as for the 6-hourly updated lateral boundary conditions. The
(and similarly for cloud water content LWC from nc and qc ),        horizontal resolution of domain D2 is high enough to resolve
which should lead to a much more accurate representation of         moist deep convection. Nevertheless, subgrid-scale shallow
dust–cloud radiation effects in the model.                          convection needs to be parameterized by the restricted appli-
                                                                    cation of the scheme on this type of convection only, which
2.2   Simulation setup                                              is a common approach at this scale.
                                                                       One D2 model run is performed with the single-moment
COSMO-MUSCAT is applied on 2-fold nested domains, as                bulk microphysics scheme as for D1. To ensure numerical
depicted in Fig. 1, to simulate the Saharan dust outbreak in        stability of the microphysics schemes, the model integration
early April 2014 over Europe. The outer domain D1, which            time step is lowered to 10 s compared to the 25 s standard.
covers Europe and northern Africa, provides the emission            Model evaluation is started after a model spin-up time of 24 h
and long-range transport of Saharan dust toward Europe,             on 4 April 2014 at 00:00 UTC, which roughly coincides with
while the inner domain D2 is used for investigating the repre-      the appearance of the dense cirrus canopy over Germany in
sentation of cloudiness and precipitation over Germany. Do-         the satellite images.
main D1 has a horizontal resolution of 14 km, is divided into          To evaluate the effects of the dust plume on cloud activa-
40 vertical layers up to an altitude of 20 km, and spans the        tion, ice nucleation and radiation, four additional model runs
area enclosed within 20◦ N, 20◦ W and 61.5◦ N, 39◦ E. In this       are carried out on D2, deploying the two-moment scheme by
simulation, COSMO-MUSCAT is run with the operational                Seifert and Beheng (2006) with the modifications to allow
single-moment bulk water continuity microphysics scheme             for the online feedback of dust on cloud activation and ice
and without dust–cloud interactions. However, interactive           nucleation. For ice nucleation of desert dust, the most up-to-
dust–radiation interactions according to Heinold et al. (2007)      date INAS density parameterization of Ullrich et al. (2017)
were considered. A Tiedtke (1989) convection scheme was             is chosen as default, while for the climatological background
used to treat subgrid-scale cloud and precipitation processes,      aerosol of soot and organics we rely on the parameterization
related to moist convection, as horizontal resolution is not        of Phillips et al. (2008). A summary of the sensitivity model
sufficient to explicitly resolve these processes. The dust sim-     runs is given in Table 1, and parameters of the climatologi-
ulation is run for the period 27 March to 6 April, in order         cal mean aerosol PSD are listed in Table 2. The run ICLM is
to cover associated dust emissions and the development and          used to represent a climatological background dust scenario
evolution of the dust plume. COSMO is driven by initial and         with two-moment microphysics, while IINT uses the simu-
boundary fields from analysis of the global GME model of            lated dust fields instead of the constant prescribed dust PSD.
DWD. The simulations are re-initialized every 48 h to keep          In RCLM and CCLM dust–radiation and dust–cloud activa-

Atmos. Chem. Phys., 18, 17545–17572, 2018                                            www.atmos-chem-phys.net/18/17545/2018/
M. Weger et al.: The impact of mineral dust on cloud formation                                                                      17551

Figure 1. (a) Model simulation domain D1 with 14 km grid spacing showing dust AOD fields by COSMO-MUSCAT. (b) Inner model
domain D2 with 2.8 km grid spacing showing simulated infrared brightness temperatures of a COSMO-MUSCAT run with interactive dust
effects on cloud microphysics.

Table 1. Overview of the model runs performed in this study to investigate dust–cloud interactions (DCI) and dust–radiation interactions
(DRI). CLM denotes the spatially and temporally fixed climatological mean dust concentration, INT indicates the interactively simulated
dust concentration. U17 refers to the parameterization of Ullrich et al. (2017), and P08 to the parameterization of Phillips et al. (2008).

                   Run         Purpose                                          Dust INAS    Dust    Dust     Dust
                                                                                density      INP     CCN      radiation
                   SMBLK       Reference, without DCI and RCI                   –            –       –        –
                   ICLM        DCI and DRI at normal low dust conditions        U17          CLM     CLM      CLM
                   IINT        DCI and DRI of simulated dust outbreak           U17          INT     INT      INT
                   RCLM        Evaluate DRI of climatological dust              U17          INT     INT      CLM
                   CCLM        Evaluate CCN effect of climatological dust       U17          INT     CLM      INT
                   IAIP        Test alternative ice parameterization for dust   P08          INT     INT      INT

tion is computed using the prescribed climatological mean                   Observational data comprise a vertical cross section
dust concentration (modeled dust PSD, but with dust amount               of IWC along a CloudSat satellite overpass on 4 April
reduced to a spatially uniform low average value), respec-               at 12:30 UTC (granules: 12 457–42 209) with a horizontal
tively, in order to disentangle those effects of the simulated           along-track resolution of 1.7 km (data product 2B-CWC-
dust plume from the fully interactive effects seen in IINT.              RO P_R04, Austin et al., 2009). To compare these data to
Finally IAIP is analogous to IINT, but uses the parameteriza-            model results, overflown grid cells are extracted from the
tion of P08 for ice nucleation of mineral dust.                          D2 domain and observations are interpolated onto this ar-
                                                                         ray. Furthermore, vertical coordinate transformation to the 51
2.3     Observational data                                               layer boundary heights of COSMO-MUSCAT is carried out,
                                                                         by averaging over all observations located within the corre-
2.3.1    Cloud radar observations                                        sponding model layer. Finally, horizontal grid-cell averages
                                                                         are computed for both observational and model data.
                                                                            In addition to the CloudSat profile, a time series of vertical
To evaluate the modeled IWC, 94 GHz spaceborne and
                                                                         profiles of IWC retrieved from the 35 GHz zenith pointing
35 GHz ground-based cloud radar observations are used.
                                                                         radar at Leibniz Institute for Tropospheric Research (TRO-
From the model side, the mixing ratios of cloud ice (qi ), snow
                                                                         POS) (51.3◦ N, 12.3◦ E) is available. The cloud radar of type
(qs ), graupel (qg ) and the subgrid-scale ice (qi, sc ) have to
                                                                         Mira-35 (Görsdorf et al., 2015) is operated within the Leipzig
be included. qi, sc is parameterized with a relative humidity
                                                                         Aerosol and Cloud Observations System (LACROS, Bühl
scheme and the stratiform cloud fraction. By using the den-
                                                                         et al., 2013), which comprises in addition an extensive set of
sity of air, the values are converted to units (g m−3 ).

www.atmos-chem-phys.net/18/17545/2018/                                                 Atmos. Chem. Phys., 18, 17545–17572, 2018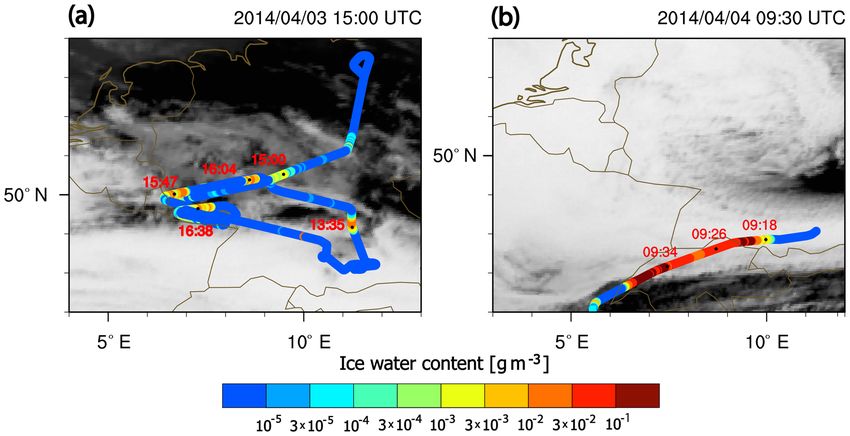
17552                                                             M. Weger et al.: The impact of mineral dust on cloud formation

Table 2. Aerosol size distribution for dust, soot and organics used     temperature of optically dense clouds, and further as a mea-
in COSMO-MUSCAT for the climatological mean background. The             sure of cloud-top height.
number concentrations for dust are based on the temporal and spa-
tial mean of simulated dust fields of a model run carried out on do-    2.3.3       Precipitation records
main D2. The values for soot and organics are taken from Phillips
et al. (2008), and accredited to the smallest size bin. The size bins   For Germany and closely surrounding areas, hourly precip-
are distributed logarithmically with a relative standard deviation of   itation totals are available for a total of 970 stations. The
σ = 2.                                                                  data are provided by the Climate Data Center (CDC) of
                                                                        the German weather service DWD (http://www.dwd.de/cdc,
 Size    Mean volume             Number concentration (m−3 )
                                                                        last access: 9 May 2017). The data were integrated over the
 bin     diameter (µm)    Dust            Soot         Organics         model evaluation period from 4 April 2014 at 00:00 UTC to
 1                0.39    1.10 × 10⁵      1.50 × 10⁷   1.77 × 10⁸       5 April 2014 at 12:00 UTC and are used to evaluate the mod-
 2                1.17    5.02 × 10⁴      –            –                eled precipitation amount for the different model runs.
 3                3.53    2.00 × 10³      –            –
 4               10.65    2.18 × 10²      –            –                2.3.4       Cloud microphysical measurements
 5               32.16    2.36 × 10⁻⁶     –            –
                                                                        During the ML-CIRRUS campaign (Voigt et al., 2017), 16
                                                                        flights were performed from 26 March to 15 April 2014
                                                                        with the High Altitude and Long Range Research Aircraft
active and passive ground-based remote sensing instrumen-               (HALO). The campaign had the scope to investigate cirrus
tation, such as lidar (PollyXT, Engelmann et al., 2016), a mi-          and contrail cirrus above Germany and western Europe with
crowave radiometer (HATPRO, Rose et al., 2005) and an op-               a novel in situ and remote sensing payload. For model eval-
tical disdrometer. The observations of LACROS are automat-              uation, the flights conducted on 3 and 4 April provide valu-
ically processed within Cloudnet (Illingworth et al., 2007)             able information on cloud microphysical and thermodynamic
based on which a hydrometeor and aerosol target categoriza-             properties.
tion is derived. Cloudnet provides output with a temporal and              Cloud particle number concentrations for 3 April were
vertical resolution of 30 s and 30 m, respectively. The Cloud-          measured with the particle spectrometer NIXE-CAPS
net target classification builds the basis for the retrieval of         (Baumgardner et al., 2001; Meyer, 2013), which consists of
products such as liquid water content and ice water content.            the cloud and aerosol spectrometer NIXE-CAS to measure
The ice water content is derived for all identified ice-only            size and concentration of particles in the diameter range be-
measurement points based on a parameterization of Hogan                 tween 0.61 to 50 µm, and the optical particle counter NIXE-
et al. (2006) that uses an empirical relationship between ice           CIP to measure particles in the diameter range of 15 to
water content, temperature and radar reflectivity factor. In or-        945 µm with 15 µm resolution. On 4 April, data were not
der to compare these data to equivalent model results, in a             available for the NIXE-CIP instrument. For particle diame-
first step the original data set is averaged over variable time         ters larger than 25 µm, we therefore used available measure-
periods around the dates of the model output with 15 min in-            ments from the Cloud Combination Probe (CCP) instrument
tervals. The number of measurements to include in a single              (Weigel et al., 2016). In the size range d < 3 µm the PSD con-
averaging procedure is given by horizontal advection and is             tains mostly aerosol particles, while for the larger sizes ice
therefore calculated based on the horizontal grid spacing of            particles dominate. Thus, we select this cutoff size to limit
2.8 km and the modeled horizontal wind speed. After vertical            the ice PSD, but retain the smaller bins as useful aerosol
coordinate transformation, the obtained data sets are time av-          measurements. According to the aircraft altitude, measure-
eraged over the period from 4 April at 00:00 UTC to 5 April             ments were assigned to the corresponding vertical layer of
at 12:00 UTC.                                                           COSMO-MUSCAT on D2. For each layer the horizontally
                                                                        averaged PSD was calculated. Measurements with nonsignif-
2.3.2   Infrared satellite imagery                                      icant particle concentrations (ni < 1 m−3 ) were not consid-
                                                                        ered. IWC was retrieved from the measured PSD, assuming
Model output fields of the hydrometeor mixing ratios, as well           empirical mass–diameter relationships according to Krämer
as thermodynamic variables, are supplied to an infrared (IR)            et al. (2016) and using the arithmetic mean of the size bin
forward simulation (see Appendix A for a detailed descrip-              limits. For a measurement, the sphere-equivalent mean di-
tion). Resulting synthetic infrared images can be compared to           ameter Di can be obtained simply by
satellite images obtained with the Spinning Enhanced Visible
and Infrared Imager (SEVIRI) instrument aboard Meteosat
Second Generation (MSG) satellite and provided by EU-                                      1
                                                                                    IWC      3
METSAT (https://www.eumetsat.int, last access: 5 Decem-                 Di =                     .                               (12)
                                                                                    ni ρi
ber 2017). For the atmospheric window channel at 8.7 µm,
brightness temperature is used as a proxy for the cloud-top

Atmos. Chem. Phys., 18, 17545–17572, 2018                                                    www.atmos-chem-phys.net/18/17545/2018/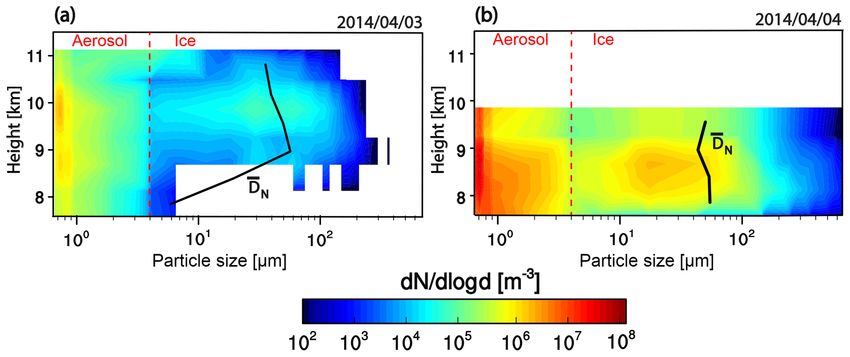
M. Weger et al.: The impact of mineral dust on cloud formation                                                                17553

  The number-averaged diameter D N of an ensemble of                   is estimated with 5 % of relative humidity according to Milo-
measurements is then defined by                                        shevich et al. (2008). After conversion to specific humidity
                                                                       (kg kg−1 ), the data are considered to have similar accuracy
        X             X                                                to the AIMS measurements, at least for temperatures higher
DN =        Di ni /       ni ,                                 (13)    than 213.15 K.

and similarly the IWC-averaged D IWC is defined by                     2.3.6   Dust aerosol observations

          X                 X                                          For dust model evaluation, a rich data set consisting of air-
D IWC =       Di IWC/            IWC.                          (14)    craft measurements with an optical particle counter (OPC
                                                                       GRIMM model 1.129) aboard HALO for the days 3
    To find comparable model data, for each HALO measure-
                                                                       and 4 April, as well as sun photometer observations of
ment a horizontal circle with radius r = 100 km around the
                                                                       aerosol optical depth (AOD) at 40 Aerosol Robotic Net-
aircraft position is defined. The selection of this radius is jus-
                                                                       work (AERONET) (https://aeronet.gsfc.nasa.gov, last ac-
tified, when considering the large impact of randomness on
                                                                       cess: 12 March 2018, Holben et al., 1998) stations located
the distribution of clouds in the model at this length scale.
                                                                       in northern Africa and Europe is provided. In addition, at the
Within this circle and at the model layer in which the air-
                                                                       TROPOS site, lidar measurements were conducted for the
craft is situated, the closest grid cell to the aircraft position is
                                                                       model time period, from which dust particle extinction pro-
taken, which further has a grid-cell average IWC value in the
                                                                       files could be retrieved for 5 April (Baars et al., 2016). For
same order of magnitude as that of the respective measure-
                                                                       the other days, cloudiness and other more complex aerosol
ment. For the comparison of IWC, both measured and mod-
                                                                       layers prevented a reliable retrieval.
eled IWC, containing contributions from qi and qs , are dis-
                                                                          Like the cloud microphysical measurements, OPC mea-
cretized in nine levels. If there is no grid cell meeting this cri-
                                                                       surements are also available for the flights on 3 April after-
terion, the respective measurement is excluded from a direct
                                                                       noon and 4 April morning and are considered for the same
comparison with model results. By this approach, the code-
                                                                       time period.
pendence of Di on IWC is taken into account, as well as to
                                                                          The OPC detects particles in a diameter range from
some extent the geographical codependence, which increases
                                                                       250 nm to 20 µm, although the upper size range is limited
the significance of the comparison. For different model runs,
                                                                       by the aircraft inlet to about 5 µm. Here, we use the number
however, the resulting number of data pairs can be different,
                                                                       concentration of particles larger than 500 nm as a proxy for
as clouds are differently distributed in the model runs. For
                                                                       the presence of mineral dust particles. This implies that only
the ML-CIRRUS flight on 4 April, this approach cannot be
                                                                       the four largest size bins of the modeled dust PSD are used
applied, as the HALO flight-track is located completely out-
                                                                       in the comparison.
side of the domain D2. Nevertheless, these observations are
                                                                          Similarly, sun photometer measurements are affected by
useful for comparison with data from the ML-CIRRUS flight
                                                                       all types of aerosol, while COSMO-MUSCAT AODs only
conducted on 3 April.
                                                                       consider dust. Therefore, the coarse-mode AOD product
2.3.5   Humidity measurements                                          (particle diameter > 500 nm, level 2.0 quality) of AERONET
                                                                       (O’Neill et al., 2003) predominantly represents the dust frac-
To evaluate atmospheric water vapor content in the model,              tion and is thus commonly used for evaluating dust-only
humidity measurements from the airborne mass spectrome-                model results. Modeled mass extinction coefficients are de-
ter (AIMS) (Kaufmann et al., 2018) aboard HALO aircraft                rived from the dust PSDs by using refractive indices of
during ML-CIRRUS flight of 3 April are available. AIMS                 Sinyuk et al. (2003) based on Mie theory. With further verti-
data provide an accuracy of between 7 % and 15 %. In addi-             cal integration of the mass extinction coefficients, dust AOD
tion, for 4 April at 00:00 UTC, 4 April at 12:00 UTC and               values are obtained for comparison with AERONET data.
5 April at 00:00 UTC, data sets of atmospheric soundings
(source: University of Wyoming; http://weather.uwyo.edu/
upperair/sounding.html, last access: 8 September 2017) are             3   Dust outbreak April 2014
used from the stations Essen (51.40◦ N, 6.97◦ E), Norderney
(53.71◦ N, 7.15◦ E), Schleswig (54.53◦ N, 9.55◦ E), Greif-             In early April 2014, a pronounced trough of low pressure
swald (54.10◦ N, 13.40◦ E), Bergen (52.81◦ N, 9.93◦ E), Lin-           was situated over the eastern Atlantic Ocean, placing west-
denberg (52.21◦ N, 14.12◦ E), Kümmersbruck (49.43◦ N,                  ern Europe under a recurrent southerly flow pattern. On
11.90◦ E), Meiningen (50.56◦ N, 10.38◦ E) and Idar-                    2 April, the trough propagated eastward, with the associated
Oberstein (49.70◦ N, 7.33◦ E). As of 2014, radiosondes of the          cold front reaching the Atlas Mountains at the Moroccan–
type Vasaila RS92-SGP had been operationally used in Ger-              Algerian border, where it initiated a small lee cyclone to
many, before they were replaced by the predecessor RS41 in             the south of the mountain range. Consecutively, high sur-
2017. The uncertainty of RS92-SGP for bias-corrected data              face winds caused large dust emissions in the afternoon on

www.atmos-chem-phys.net/18/17545/2018/                                               Atmos. Chem. Phys., 18, 17545–17572, 2018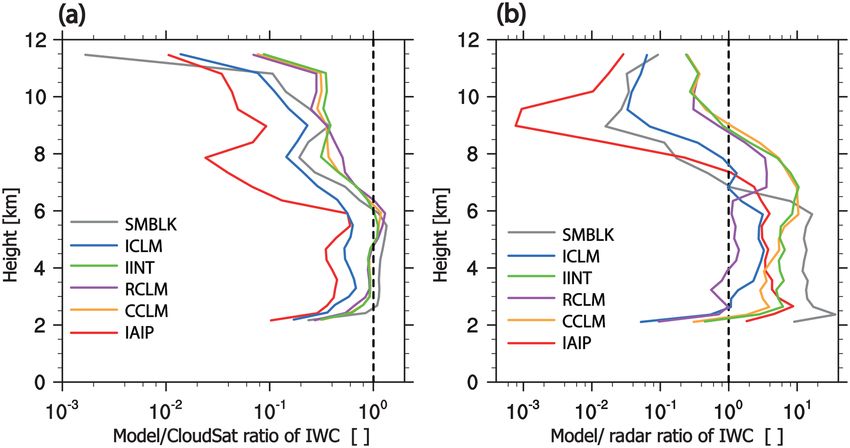
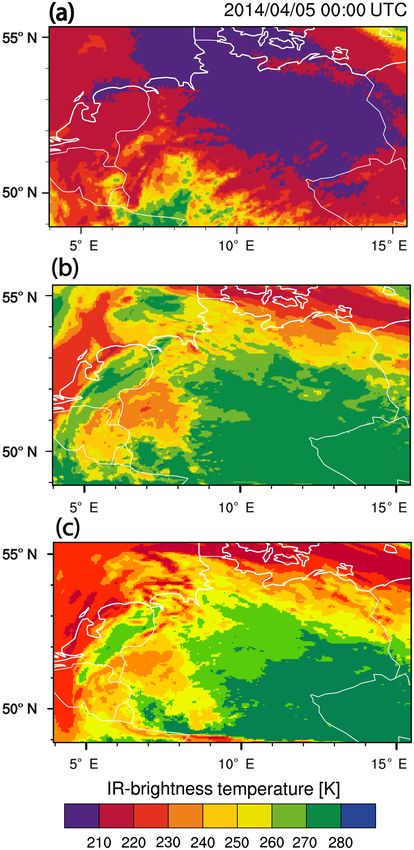
17554                                                        M. Weger et al.: The impact of mineral dust on cloud formation

Figure 2. (a, b) Meteosat Second Generation (MSG) SEVIRI dust composite images for 2 April at 15:00 UTC and 3 April at 15:00 UTC,
respectively. (c) MSG SEVIRI IR-8.7 brightness temperature for 4 April at 06:00 UTC. All images are overlaid with 500 hPa geopotential
height contour lines from COSMO-MUSCAT (14 km) with 4 dam spacing.

2 April. Figure 2a shows the MSG IR false color dust in-             of the high atmospheric mineral dust concentrations to this
dex indicating dust presence by magenta and purple colored           cloud development seems likely, as desert dust has excellent
shadings. In addition, isolines of 500 hPa geopotential height       ice-nucleating abilities and furthermore it can destabilize the
illustrate the synoptic situation at this time. The associated       thermodynamic stratification of the atmosphere at the upper
intense dust plume can be clearly identified from the ma-            edge of the dust plume through interaction with radiation.
genta coloring over the Moroccan–Algerian border. Further-           Weak anticyclonic currents over central Europe kept the dust
more, the 500 hPa geopotential height contour lines indicate         air mass and the associated cloudiness trapped until 5 April.
air mass transport toward the western Mediterranean basin.           In the evening hour an eastward-moving Atlantic cold front
Inside the warm conveyor belt (WCB), which closely goes              finally marked the end of the dust event, as skies cleared up
ahead of the cold front, strong lifting caused the Saharan dust      due to the replacement of the dust air mass by subsiding clean
to eventually reach the upper troposphere, where it was fur-         air mass.
ther transported eastward behind the pronounced ridge axis.             In the MSG imagery, cloud cover obscured most of the
This transport mechanism was recently identified for a very          dust transport towards Europe. The horizontal dust distribu-
similar case by Caffrey et al. (2018). Based on this analysis, a     tion is better seen in the dust AOD maps (Fig. 3) from the
destination of the lifted dust over western and central Europe       COSMO-MUSCAT simulation at 14 km horizontal resolu-
can be expected.                                                     tion. Figure 3a shows an intense dust plume with AOD ex-
   Over the next day, the eastward traveling cold front caused       ceeding 1.5 at the Moroccan–Algerian border on 2 April at
nearly continuous dust emissions (albeit weaker than the             15:00 UTC, which corresponds to the magenta dust signa-
event in the afternoon on 2 April) over the desert in Alge-          ture in the corresponding MSG IR image. Obviously, at this
ria and Tunisia (see purple features in Fig. 2b). The persis-        time, Europe was still affected by the remnants of a previous
tence of the aforementioned flow pattern also favored most           dust outbreak which occurred in late March 2014. In the con-
of this dust eventually reaching Europe on 3 April. With the         secutive image (Fig. 3b), the dust transport towards Europe
development of an upper-level cutoff low over the western            is clearly depicted within the s-shaped conveyor belt. The
Mediterranean Sea and with its eastward movement, upper-             initial dust plume is now located over Germany, with AOD
level winds over south-central Europe became more and                values still reaching up to 1.5. Furthermore, the model repro-
more easterly on 4 April and, as a consequence, dust export          duces the significant dust emissions in terms of dust AOD
from northern Africa to central Europe was not further sup-          over the desert in Algeria and Tunisia in association with the
ported. Ongoing upper-level lifting, especially at the north-        eastward traveling cold front. In Fig. 3c, the closed circula-
ern boundary of the advancing Saharan mineral dust-rich air          tion centered over Sardinia is clearly seen, with the freshly
mass caused the development of extensive cirrus cloudiness.          emitted dust over Libya being steered increasingly in a cy-
The horizontal extension as well as the high optical density         clonic gyre over the Mediterranean. Meanwhile the dust over
of the cirrus shield became striking in the morning hours            central Europe is kept trapped, with the highest dust load
of 4 April, as associated cloud-top temperatures reached be-         found over Austria and southern Germany at AOD values up
low 210 K over a large area, covering parts of France, Great         to 1. On 5 April at 12:00 UTC (Fig. 3d) the dust AOD over
Britain, the Benelux States and Germany (see Fig. 2c). A link

Atmos. Chem. Phys., 18, 17545–17572, 2018                                             www.atmos-chem-phys.net/18/17545/2018/
M. Weger et al.: The impact of mineral dust on cloud formation                                                                  17555

                                                                  Figure 4. Scatter plot of observed 500 nm coarse-mode AOD and
                                                                  modeled dust AOD from the 14 km COSMO-MUSCAT run for all
                                                                  available AERONET stations within domain D1 (see Fig. 1). The
                                                                  data pool was gathered over the period from 2 April at 00:00 UTC
                                                                  to 6 April at 00:00 UTC by taking hourly model outputs and
                                                                  AERONET observations available within ±0.5 h of corresponding
                                                                  time frames into account. Parameters printed are number of data
                                                                  points in each set (N), correlation coefficient between both data sets
                                                                  (corr), mean of the observations (xm) and mean of modeled values
                                                                  (ym).

                                                                     A statistical evaluation, taking AERONET coarse-mode
Figure 3. Maps of dust AOD at 550 nm as simulated with the dust   AOD data of level 2.0 quality and corresponding modeled
transport model COSMO-MUSCAT on the D1 grid for 2 April           values at the nearest geographical position into account, is
at 15:00 UTC, 3 April at 15:00 UTC, 4 April at 12:00 UTC and
                                                                  shown by the scatter plot in Fig. 4. The data set considered
5 April at 12:00 UTC, respectively. AERONET observations of
                                                                  contains 301 observation–model pairs collected over the pe-
coarse-mode AOD at 500 nm are marked by colored circles.
                                                                  riod 2 April at 00:00 UTC to 6 April at 00:00 UTC. Correla-
                                                                  tion between observational and model data is 0.57. One has
                                                                  to note, however, that the number of observations directly af-
Germany is markedly decreased but locally still reaches up        fected by the dust plume was supposedly lower than usual,
to 0.5.                                                           due to the extensive cloud cover. The mean AOD of both ob-
   The available AOD observations of AERONET stations             servations and model data does not differ significantly, as it
(550 nm coarse mode, quality level 2.0) are depicted by col-      is 0.07 ± 0.06 and 0.06 ± 0.07 respectively.
ored circles in Fig. 3 for dust model evaluation. On 2 April         Concerning the vertical distribution of mineral dust, mod-
at 15:00 UTC, observed AOD over Europe is already signif-         eled dust fields are extracted along the flight paths of the
icantly raised (up to 0.5), which is similar to the model re-     HALO missions on 3 April afternoon and 4 April morn-
sults. On 3 April at 15:00 UTC, observations show a strong        ing and compared to the OPC measurements in Fig. 5. On
zonal gradient in AOD, with strongly elevated values in Tu-       3 April, a layer of aerosol with particles larger than 500 nm is
nis and Lindenberg (Germany) (AOD up to 1) and moder-             located just below 7 km, with particle number concentrations
ately elevated values in northern Germany (AOD up to 0.3),        reaching up to 107 m−3 . Above this height, aerosol concen-
while the Iberian peninsula was obviously not affected by         trations are mostly below the climatological mean dust con-
dust (AOD< 0.01). This is in very good agreement with the         centration, showing that the dust plume did not expand into
simulation. Over the next 2 days, there is a lack of obser-       the upper troposphere on this day. The model shows simi-
vations over central Europe due to the obscuring cloudiness.      lar high dust concentrations below 6 km altitude, but is not
However, the AERONET station at Lindenberg shows AOD              able to reproduce realistic dust concentrations above, as the
values up to 0.5 on both 4 and 5 April at 12:00 UTC, which        upper edge of the dust plume is located above 9 km altitude.
is higher than in the model, where the highest dust loads are     Supposedly, the model meteorology caused a too fast trans-
displaced more to the south.                                      port of the dust plume in the upper troposphere, as on the

www.atmos-chem-phys.net/18/17545/2018/                                            Atmos. Chem. Phys., 18, 17545–17572, 2018
17556 M. Weger et al.: The impact of mineral dust on cloud formation
Figure 5. Vertical profiles of particle number concentration (d > Figure 6. Vertical profile of aerosol extinction coefficient retrieved
500 nm as a proxy for dust) retrieved from aircraft measurements from lidar observations obtained at TROPOS in Leipzig on 5 April
using an OPC and extracted model data along the flight paths shown at 21:00 UTC, and calculated from the modeled dust fields at the
in Fig. 14. Grey lines show data from 3 April 2014, black lines from nearest grid point.
4 April 2014.
potential incorporation of anthropogenic air pollutants within
the boundary layer. COSMO-MUSCAT, on the other hand,
following day, measured aerosol concentrations caught up to
only considers eolian mineral dust.
typical values of a dust outbreak of 8 × 10⁶ m−3 , leading to
a much better agreement between model and measurements.
On the other hand, larger discrepancies persist in the lower 4 Results
and middle troposphere. However, here we have to note that
the aircraft was in ascent and thus could not sample these 4.1 Reference model run SMBLK
altitudes over an adequate geographical distance in order to
obtain a representative amount of data. We first compare the model run SMBLK (see Table 1) with
For 5 April, towards the end of the dust event, a verti- single-moment bulk microphysics and without dust feed-
cal particle extinction coefficient profile, retrieved from lidar back on clouds and radiation with the available observational
measurements (Baars et al., 2016) at TROPOS in Leipzig, data for an initial assessment of the representation of cloud
provides further valuable information for dust model eval- cover, cloud microphysics and precipitation. For qualitative
uation (Fig. 6). Although it was averaged only for a short cloud cover comparison, we derived synthetic infrared satel-
time period around 5 April at 21:00 UTC, when the dust lite images by the application of the infrared forward simu-
plume was moving eastward, it still shows mineral dust up lator (see Appendix A) on the model data. Figure 7 shows
to an altitude of 7 km. Above this altitude, clean air had al- maps of brightness temperature from MSG SEVIRI and the
ready subsided. According to the lidar particle extinction re- model run SMBLK over a 24 h period, starting on 4 April at
trievals, the dust was located in two distinct layers. Associ- 12:00 UTC. An extensive and optically dense shield of cir-
ated peak values are well over 100 times the corresponding rus clouds traverses the domain in the satellite images. In
climatological mean value (see blue vertical line). The sim- some areas the associated cloud-top temperatures reach be-
ulated extinction coefficient profile, which is computed from low 210 K, which corresponds to the tropopause level. Most
COSMO-MUSCAT dust concentrations using refractive in- of this cloudiness is not present in the synthetic images of
dices taken from Sinyuk et al. (2003), is in good agreement, the model data, where it is mostly limited to the western
as it shows peak values of the same magnitude as well as the and northern boundaries. These regions are strongly influ-
strong decline of mineral dust extinction above 6 km altitude. enced by the driving boundary fields, as winds mostly pre-
However, the layered structure is not well reproduced. Partly, vailed from the west and north. Moreover, cloud-top temper-
this can be attributed to black carbon aerosol incorporation, atures of cloud fields present in the model are about 20 K too
which has very similar absorbing properties to mineral dust, warm in comparison with the satellite images. In Fig. 7d and
in the lidar observations, which is not considered in the dust f, clouds are completely missing in the southeastern parts of
simulations by COSMO-MUSCAT. To a large extent, how- the domain in the model results.
ever, this is likely due to a too-strong vertical mixing and the
Atmos. Chem. Phys., 18, 17545–17572, 2018 www.atmos-chem-phys.net/18/17545/2018/You can also read