Generation and network analysis of an RNA-seq transcriptional atlas for the rat
←
→
Page content transcription
If your browser does not render page correctly, please read the page content below
Published online 7 March 2022                                                       NAR Genomics and Bioinformatics, 2022, Vol. 4, No. 1 1
                                                                                                    https://doi.org/10.1093/nargab/lqac017

Generation and network analysis of an RNA-seq
transcriptional atlas for the rat
Kim M. Summers1,*,† , Stephen J. Bush2,† , Chunlei Wu                                          3                                      1,*,†

                                                                                                                                                                  Downloaded from https://academic.oup.com/nargab/article/4/1/lqac017/6543592 by EVES-Escola Valenciana dÉstudis de la Salut user on 09 June 2022
                                                                                                   and David A. Hume
1
  Mater Research Institute––University of Queensland, Translational Research Institute, 37 Kent St, Woolloongabba,
QLD 4102, Australia, 2 Weatherall Institute of Molecular Medicine, University of Oxford, Oxford, OX3 9DS, UK and
3
  Department of Integrative and Computational Biology, The Scripps Research Institute, La Jolla, CA 92037, USA

Received November 14, 2021; Revised January 13, 2022; Editorial Decision February 14, 2022; Accepted February 15, 2022

ABSTRACT                                                                          disease-associated alleles (3). Szpirer (4) catalogued >350
                                                                                  rat genes where rat lines with natural or introduced variants
The laboratory rat is an important model for biomed-                              provide models for human disease.
ical research. To generate a comprehensive rat tran-                                 Analysis of transcriptional regulation in human and
scriptomic atlas, we curated and downloaded 7700                                  mouse has been driven by large consortium projects such
rat RNA-seq datasets from public repositories, down-                              as GTEx (5) and FANTOM (6), and there are many
sampled them to a common depth and quantified                                     online resources for these species. Multi-tissue transcrip-
expression. Data from 585 rat tissues and cells,                                  tional atlas projects have also been published for other
averaged from each BioProject, can be visualized                                  species, including chicken, sheep, buffalo, pig and goat (7–
and queried at http://biogps.org/ratatlas. Gene co-                               11). Although it was once suggested that guilt by associ-
expression network (GCN) analysis revealed clusters                               ation is the exception rather than the rule in gene regula-
of transcripts that were tissue or cell type restricted                           tory networks (12), the principle is now very well estab-
                                                                                  lished. Genes associated with specific organs, cell types,
and contained transcription factors implicated in lin-
                                                                                  organelles and pathways (e.g. the cell cycle, protein syn-
eage determination. Other clusters were enriched                                  thesis, oxidative phosphorylation/mitochondria) are co-
for transcripts associated with biological processes.                             expressed along with transcription factors that regulate
Many of these clusters overlap with previous data                                 them (5,6,8,13–18). An extension of the principle of co-
from analysis of other species, while some (e.g. ex-                              regulated expression is that it is possible to extract signa-
pressed specifically in immune cells, retina/pineal                               tures of specific cell types, for example the stromal compo-
gland, pituitary and germ cells) are unique to these                              nent of tumours (19) or resident tissue macrophages (20),
data. GCN analysis on large subsets of the data re-                               based upon analysis of a large number of samples in which
lated specifically to liver, nervous system, kidney,                              their relative abundance is variable.
musculoskeletal system and cardiovascular system                                     The functional annotation of the rat genome is still a
enabled deconvolution of cell type-specific signa-                                work in progress. Many rat genes in Ensembl are described
                                                                                  as ‘novel rat gene’ and annotated solely by a gene num-
tures. The approach is extensible and the dataset
                                                                                  ber. Transcriptional regulation has evolved rapidly among
can be used as a point of reference from which to                                 mammalian species (21,22). Even where there is 1:1 orthol-
analyse the transcriptomes of cell types and tissues                              ogy at the level of protein-coding sequence and conserva-
that have not yet been sampled. Sets of strictly co-                              tion of synteny with other mammals, the expression may not
expressed transcripts provide a resource for critical                             be conserved. Two substantial studies have contributed to
interpretation of single-cell RNA-seq data.                                       annotation of the rat transcriptome through RNA-seq anal-
                                                                                  ysis of a partly overlapping set of major rat organs (23,24).
INTRODUCTION                                                                      Long-read RNA sequencing has also contributed to refine-
                                                                                  ment of rat transcriptome annotation (25). Because of the
In the year of the rat (2020), the Rat Genome Database
                                                                                  extensive use of the rat as a model in biomedical research,
(RGD) celebrated 20 years of development (1). Those 20
                                                                                  there are thousands of RNA-seq datasets in the public do-
years saw completion of the draft genome (2). Around 90%
                                                                                  main from isolated cells and tissues in various states of ac-
of protein-coding genes had an inferred 1:1 ortholog in
                                                                                  tivation that could provide an additional resource for func-
humans. Subsequent technology advances allowed the se-
                                                                                  tional annotation. By combining random library downsiz-
quencing of multiple inbred strains, including several with

* To
   whom correspondence should be addressed. Tel: +61 7 34437625; Fax: +61 7 34437779; Email: Kim.Summers@mater.uq.edu.au
Correspondence may also be addressed to David A. Hume. Tel: +61 7 34437315; Fax: +61 7 34437779; Email: David.Hume@uq.edu.au
†
    These authors contributed equally to the paper as first authors.

C The Author(s) 2022. Published by Oxford University Press on behalf of NAR Genomics and Bioinformatics.
This is an Open Access article distributed under the terms of the Creative Commons Attribution-NonCommercial License
(http://creativecommons.org/licenses/by-nc/4.0/), which permits non-commercial re-use, distribution, and reproduction in any medium, provided the original work
is properly cited. For commercial re-use, please contact journals.permissions@oup.com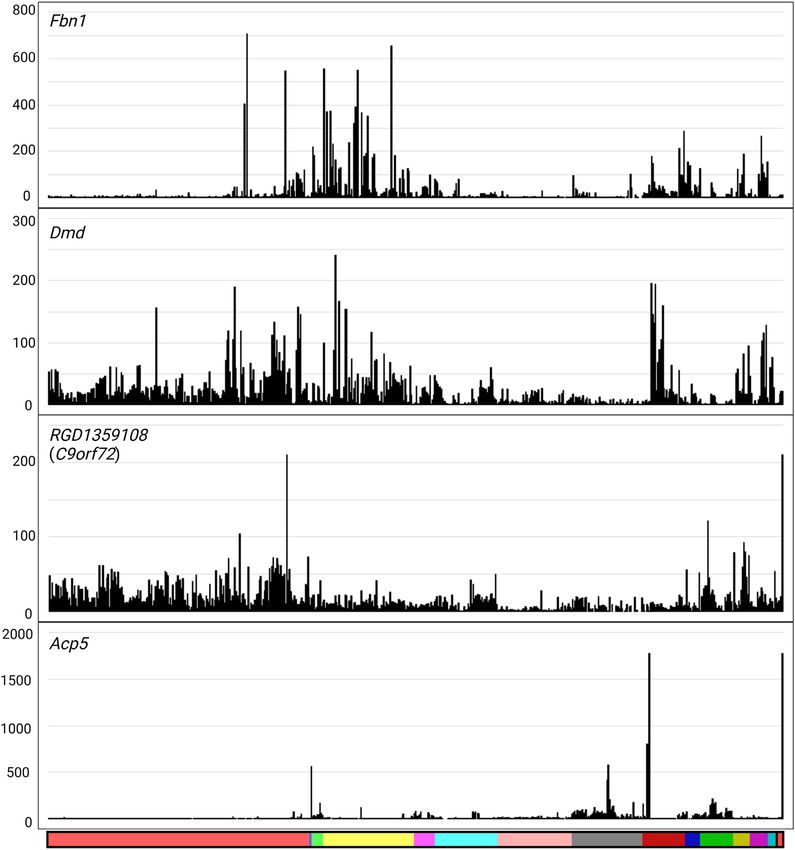
2 NAR Genomics and Bioinformatics, 2022, Vol. 4, No. 1

ing to reduce sampling bias and the high-speed ‘pseudo-         The purpose of the integration was to include transcripts
aligner’ Kallisto (26) to quantify expression, we previously    that had not already been assigned Ensembl transcript IDs
established a pipeline (7,11) to enable meta-analysis of pub-   and whose sequence was not already present in the Ensembl
lished RNA-seq data. Here, we have used this pipeline to        release (under any identifier). RefSeq mRNAs incorporate
produce an extended expression atlas for the laboratory rat.    untranslated regions (UTRs) and so could encapsulate
To demonstrate the robustness of the integrated data, we        an Ensembl CDS. The trimmed UTRs from each mRNA

                                                                                                                                   Downloaded from https://academic.oup.com/nargab/article/4/1/lqac017/6543592 by EVES-Escola Valenciana dÉstudis de la Salut user on 09 June 2022
have carried out network analysis to identify sets of co-       were generated excluding all sequence outside the longest
expressed transcripts. The dataset is downloadable and the      open reading frame. In total, the reference transcriptome
pipeline is extensible to allow inclusion of additional data    comprised 71 074 transcripts, representing 25 013 genes.
and regeneration of the network as new RNA-seq data be-         Using this reference, expression was quantified for 7682
come available.                                                 publicly archived paired-end Illumina RNA-seq libraries.
                                                                The BioProjects are summarized in Supplementary Table
MATERIALS AND METHODS                                           S1. Prior to expression quantification, and for the purpose
                                                                of minimizing variation between samples, we randomly
Selecting samples for an expression atlas of the rat            downsampled all libraries to 10 million reads, five times
To create a comprehensive expression atlas for the rat,         each, using seqtk v1.2 (https://github.com/lh3/seqtk, down-
we first downloaded the daily updated NCBI BioProject           loaded 4 June 2018). Expression level was then taken to be
summary file from ftp://ftp.ncbi.nlm.nih.gov/bioproject/        the median TPM across the five downsampled replicates.
summary.txt (obtained 19 July 2021) and parsed it to obtain        Within individual BioProjects, median TPM for repli-
all BioProjects with taxonomy ID 10116 (Rattus norvegi-         cate samples of the same tissue, age or condition was av-
cus) and a data type of ‘transcriptome or gene expression’,     eraged. The final expression atlas is based on the aver-
supplementing this list by manually searching NCBI Geo          aged median downsampled TPM per gene for each distinct
and NCBI PubMed for the keywords ‘RNA-seq AND rat’.             set of replicate samples. As in previous projects for other
BioProjects were selected to extend the diversity of tissues,   species (7–11), the full dataset of 585 averaged expression
cells and states from two existing rat transcriptomic atlases   data from cells and tissues is displayed on BioGPS (28,29)
that analyse gene expression in a subset of major rat tissues   at biogps.org/ratatlas to enable comparative analysis across
(23,24). For each BioProject, we automatically extracted        species. The full processed primary dataset and the aver-
the associated metadata using pysradb v1.0.1 (27) with pa-      aged data are available for download at an Institutional
rameter ‘–detailed’ or by manual review. Metadata for each      Repository (https://doi.org/10.5287/bodleian:Am9akye72).
BioProject, indicating (where available) the breed/strain,      The latter is a comma-separated text file, which can be di-
sex, age, tissue/cell type extracted and experimental condi-    rectly loaded into the network analysis software used herein
tion (e.g. treatment or control), are detailed in Supplemen-    or alternatives such as Gephi (https://gephi.org) or Cy-
tary Table S1, which includes both the data downloaded          toscape (https://cytoscape.org). This file can be easily sup-
via the pipeline and additional information retrieved man-      plemented by addition of further RNA-seq data processed
ually from the European Nucleotide Archive record, NCBI         in the same way. All scripts for generating the atlas are avail-
BioProject record and cited publications. For incorporation     able at https://github.com/sjbush/expr atlas.
into the expression atlas, we required that all samples have,
at minimum, tissue/cell type recorded. Overall, the input to    Network analysis and functional clustering of atlas samples
the atlas comprised 7682 samples from 363 BioProjects.
                                                                To examine the expression of genes across this wide range of
                                                                tissues and cell types, the expression data were analysed us-
Quantifying gene expression for the atlas
                                                                ing the network analysis tool BioLayout [derived from Bio-
For each library, expression was quantified using Kallisto      Layout Express3D (30)], downloaded from http://biolayout.
v0.44.0 (26) as described in detail in previous studies on      org. The same files can be uploaded into the recently devel-
other species (7–9,20). Kallisto quantifies expression at the   oped open source package, Graphia (https://graphia.app),
transcript level, as transcripts per million (TPM), by build-   which supports alternative clustering approaches and dy-
ing an index of k-mers from a set of reference transcripts      namic modification of parameters.
and then ‘pseudo-aligning’ reads to it, matching k-mers in         The initial analysis used the values averaged by age and
the reads to k-mers in the index. Transcript-level TPM esti-    BioProject for each tissue. Subsequent analyses used indi-
mates were then summed to give gene-level TPM.                  vidual values for samples of liver, musculoskeletal system,
   To create the reference transcriptomic index, we             cardiovascular system, kidney and central nervous system.
performed a non-redundant integration of the set of             For each analysis, a sample-to-sample correlation matrix
Ensembl v98 Rnor6.0 protein-coding cDNAs (http:                 was initially constructed at the Pearson correlation coeffi-
//ftp.ensembl.org/pub/release-98/fasta/rattus norvegicus/       cient (r) threshold necessary to include all samples in the
cdna/Rattus norvegicus.Rnor 6.0.cdna.all.fa.gz, accessed        analysis (shown in the ‘Results’ section and figure legends).
24 November 2019; n = 31 715 transcripts) and the set of        Pearson correlations were then calculated between all pairs
69 440 NCBI mRNA RefSeqs (https://ftp.ncbi.nlm.nih.gov/         of genes to produce a gene-to-gene correlation matrix of all
genomes/refseq/vertebrate mammalian/Rattus norvegicus/          genes correlated at r ≥ 0.75.
all assembly versions/suppressed/GCF 000001895.                    Gene co-expression networks (GCNs) were generated
5 Rnor 6.0/GCF 000001895.5 Rnor 6.0 rna.fna.gz,                 from the matrices, where nodes represent either samples
accessed 24 November 2019), as previously described (7).        or genes and edges represent correlations between nodes
NAR Genomics and Bioinformatics, 2022, Vol. 4, No. 1 3
above the selected correlation threshold. For the sample-to- Projects generally clustered together (compare Figure 1A
sample analyses (essentially analogous to a principal com- where nodes are coloured by organ system and Figure 1B
ponent analysis), an initial screen at the r value that entered where they are coloured by BioProject). Note, for example,
all samples was performed, followed by subsequent analy- the tight clustering of liver sample (olive) generated by mul-
ses with a higher r value that removed outliers and revealed tiple independent laboratories. At a more stringent corre-
more substructure in the networks. For each gene-to-gene lation coefficient threshold of 0.7, only 15 samples of rel-
Downloaded from https://academic.oup.com/nargab/article/4/1/lqac017/6543592 by EVES-Escola Valenciana dÉstudis de la Salut user on 09 June 2022
analysis, an r value threshold of 0.75 was used for all anal- atively low connectivity were removed, but the association
yses (Supplementary Figure S1). of nodes by organ system rather than BioProject becomes
For the gene-to-gene networks, further analysis was per- even more clear-cut (Figure 1C and D). No clear outliers or
formed to identify groups of highly connected genes within BioProject-specific clusters (batch effects) were identified,
the overall topology of the network, using the Markov clus- so all averaged samples were included in the subsequent
tering algorithm (MCL) (31). The MCL is an algebraic gene-centred network analysis.
bootstrapping process in which the number of clusters is not The threshold correlation coefficient for the gene-to-gene
specified. A parameter called inflation effectively controls network was chosen empirically to maximize the number
granularity. The choice of inflation value is empirical and is of nodes (genes included) while minimizing the number
based in some measure on the predicted complexity of the of edges (correlations between them) (Supplementary Fig-
dataset (31). The inflation value was 1.7 or 2.2 as indicated ure S1). At the chosen correlation coefficient of r ≥ 0.75,
and only genes expressed at ≥10 TPM in at least one sample the graph contained 14 848 nodes (genes) connected by
were included. Gene Ontology (GO) terms and Reactome 1 152 325 edges. The full set of averaged expression profiles
pathways were derived from the Gene Ontology Resource is provided as a web resource at http://biogps.org/ratatlas.
(http://geneontology.org, release of 18 August 2021) using On this site, a gene name query opens a display of the ex-
PANTHER overrepresentation test (PANTHER release of pression profiles across all 585 samples, links to rat genomic
24 February 2021). The reference list used was R. norvegicus resources and a gene wiki connected to data related to the
(all genes in database), the Gene Ontology database was the orthologous human gene. A click on the ‘Correlation’ but-
release of 2 July 2021 (DOI: 10.5281/zenodo.5080993) and ton enables the user to define a correlation threshold and to
the Reactome pathway analysis used Reactome version 65, generate a ranked list of correlated transcripts. This func-
released 17 November 2020. These resources are all avail- tion can enable confirmation of relationships inferred from
able at the Gene Ontology Resource (http://geneontology. the clustering described below. It can also identify potential
org). co-regulated transcripts for genes that were excluded from
the network at the r value used for clustering.
RESULTS Supplementary Table S2A shows all of the clusters de-
tected for transcripts with a minimum expression of 10
Samples in the atlas TPM in at least one sample. In comparison to previous net-
Seven thousand six hundred eighty-two RNA-seq libraries, work analysis of mouse, human, pig, chicken, sheep and wa-
each with a unique SRA sample accession from 363 Bio- ter buffalo transcriptomes (7–11) at this relatively stringent
Projects, were obtained by the pipeline as described in the correlation coefficient, the much larger and more diverse rat
‘Materials and Methods’ section and used to create a global transcriptomic dataset has a more fine-grained distribution
atlas of gene expression. Metadata for the individual Bio- with >1300 clusters having two nodes or more. In the pub-
Projects are summarized in Supplementary Table S1. For lished RNA-seq transcriptional atlas of 11 rat organs (32)
comparative tissue analysis and the core atlas, expression that is included in the current data, around 40% of tran-
across libraries was averaged by tissue, age and BioProject. scripts were expressed in all organs, in both sexes and at all
This reduced the dataset to 585 different averaged samples development stages. In this larger set of averaged data, re-
of rat tissues and cells summarized in Supplementary Ta- flecting the much greater diversity of tissues and isolated
ble S2A. For a separate analysis of liver, kidney, muscu- cells sampled here, only 95 genes (0.38%) were detected
loskeletal, cardiovascular and central nervous systems to above the 10 TPM minimal threshold in all 585 samples.
extract tissue-specific co-expression signatures, individual These are shown in Supplementary Table S2B, with calcu-
RNA-seq datasets from within each BioProject were used. lated maximum, minimum and variance. There is an obvi-
ous enrichment for mitochondrial and ribosomal subunit
genes. There is still considerable variation among tissues
Network analysis of the rat transcriptome
and samples, but these genes have potential as controls for
Initially, we performed a sample-to-sample correlation to qRT-PCR. Commonly used controls such as Actb, Gapdh,
assess whether there were likely to be batch effects result- Tbp and Hprt are also widely expressed but very low or ab-
ing in outlier samples that were unrelated to tissue type. To sent in selected tissues that can be identified in the BioGPS
include all 585 samples, it was necessary to use a sample-to- site.
sample r ≥ 0.21. An image of the resulting network graph Significantly enriched GO terms (with associated cor-
is shown in Figure 1. This visualization is analogous to a rected P-values) for clusters discussed later are included in
principal component analysis. Since BioProjects tended to Supplementary Table S2C. Consistent with previous analy-
focus on one strain, age, sex and tissue/treatment, some sis, there are clusters that show no evidence of tissue speci-
BioProject-specific clustering was expected. However, illus- ficity but are clearly enriched for genes involved in defined
trating the robustness of the sampling and downsizing ap- biological functions. For example, clusters 11, 54 and 69 are
proach, the same or related tissues analysed in different Bio- associated with the cell cycle, DNA synthesis and repair.4 NAR Genomics and Bioinformatics, 2022, Vol. 4, No. 1
Downloaded from https://academic.oup.com/nargab/article/4/1/lqac017/6543592 by EVES-Escola Valenciana dÉstudis de la Salut user on 09 June 2022
Figure 1. Sample-to-sample network graph for samples averaged by BioProject, age and tissue type. The 585 averaged RNA-seq profiles generated as
described in the ‘Materials and Methods’ section. A pairwise sample-to-sample Pearson correlation coefficient (r) was calculated. The resulting matrix
is displayed as a network graph using BioLayout. The individual samples (nodes, coloured balls) are connected by edges (lines) that reflect the chosen
r value threshold. For panels (A) and (B), a correlation coefficient threshold of r > 0.21 was used to include all samples. For panels (C) and (D), the
threshold was increased to a more stringent r > 0.7, which removed 15 nodes that make no connection at this r threshold and increased the separation of
the remaining nodes. In panels (A) and (C), the nodes are coloured by organ system: dark red, auditory system; light red, cardiovascular system; salmon,
digestive system; orange, endocrine system; olive, liver; bright green, female reproductive system; teal, immune system; dark teal, integumentary system;
dark green, male reproductive system; black, mixed tissues; light blue, nervous system; dark blue, primordia/early development; purple, renal system; pink,
respiratory system; mauve, skeletomuscular system; and grey, whole body (embryo). In panels (B) and (D), nodes are coloured by BioProject, data being
generated by different laboratories. Note that in panels (A) and (C), where nodes are coloured by organ system, nodes of the same colour cluster together,
whereas there is no pattern of association when the same nodes are coloured based on BioProject in panels (B) and (D).
Cluster 41 (see also Supplementary Table S2D) is made up defined Fams, 20 testis-expressed (Tex) and 15 Tmem pro-
almost entirely of histone-encoding transcripts, likely due tein genes). The complexity of the testis transcriptome in all
to incomplete removal of non-polyadenylated transcripts in mammalian species has been widely recognized [reviewed
some of the RNA-seq libraries. This cluster is not specific to in (33)]. The set of testis-enriched transcripts with func-
any BioProject. The 18 transcripts within this cluster iden- tional annotations encodes proteins associated with meio-
tified by LOCID also have provisional annotation as his- sis, sperm differentiation, structure and motility, and acro-
tones. Although this cluster is the product of a technical er- somes. Unannotated genes are likely to be involved in male
ror, it also highlights the power of the clustering approach fertility. For example, mutation of Dlec1, a putative tumour
to extract signatures of co-expression. suppressor gene, was recently shown to cause male infer-
Table 1 summarizes the expression patterns and biolog- tility in mice (34). LOC498675 is a predicted 1:1 ortholog
ical processes associated with clusters of transcripts show- of mouse testis-specific gene 1700102P08Rik, which is ex-
ing evidence of tissue or cell type enrichment. The largest pressed in spermatocytes and is essential for male fertility
cluster of transcripts (cluster 1), >1500 in total, is expressed (35,36). Other smaller testis-enriched clusters include clus-
almost exclusively in the testis. A smaller cluster 70 is also ter 29, which contains Sertoli cell markers such as Aard and
testis specific. More than 500 of the transcripts in clusters 1 Tsx (37,38), cluster 72, which contains Fshr and the essential
and 70 are identified only by a LOCID, RGD or other unin- testis-specific transcription factor Taf7l (39,40), and cluster
formative annotation and many more are identified only by 88, which includes the male-determining transcription fac-
structural motif (e.g. 50 members of the Ccdc family, 35 un- tor Sry.NAR Genomics and Bioinformatics, 2022, Vol. 4, No. 1 5
Table 1. Gene expression clusters from rat tissues and cells
Cluster Number of
number transcripts Specificity Index genes and TFs Functional annotation
1 and 70 1514 and 27 Testis Acr, Amhr2, Ccna1, Fshr, Meioc, Spata16, Tnp1/2, Spermatogenesis, motility, meiosis
Rec8, Stag3, Nr6a1, Pbx4, Rfx2/8, Sox5, Sox30,
Downloaded from https://academic.oup.com/nargab/article/4/1/lqac017/6543592 by EVES-Escola Valenciana dÉstudis de la Salut user on 09 June 2022
Tcfl5, Taf7l
2 1303 CNS neurons Amigo1, Camk2a, Cx3cl1, Gabbr1/2, Grik1–5, Neurotransmission, neural development
Nfasc, Snca, Atf2, Bcl7a, Cbx6, Hdac11, Hivep2,
Lmo3, Pou6f1, Rfx3, Tcf25
3 583 Non-specific variable Atm, Birc6, Ccnt1/2, Cdk12/13, Ddx5/6, Fancb, Misfolded protein/stress response,
Herc1/2, Hipk1, Arid2, Creb1, Kdm5a, Nf1, Nfe2l3, tumour suppressors
Nr2c2, Smad4/5
5 342 Liver Afm, Alb, Apoc1–4, C3, Cfb, Cth, Cyp2a1, F2, Hepatocyte secretory products,
Fetub, Gcgr, Ghr, Hpx, Igf1, Plg, Serpina1, Creb3l3, xenobiotic metabolism
Foxa3, Meox2, Nr0b2, Nr1h3/i2/i3, Rxra
6 310 Oocyte Axin2, Bmp15, Bub1b, Ccnb3, Dlgap5, Esrp1, Oocyte-specific transcription, zona
Eya1/3, Gdf9, Gpr1, Zp1–4, Cbx2, Dux4, Foxn4, pellucida structure, meiosis
Foxr1, Gata3, Lhx8, Nobox, Sall3, Taf4b, Taf5,
Tead4
7 213 Skeletal muscle Acta1, Casq1, Ckm, Des, Mb, Myh2, Myl1, Pfkm, Muscle contraction, calcium signalling
Ryr1, Lbx1, Myf6, Pou6f2, Six1, Snai3, Zfp106
8 211 Kidney Aco1, Adm2, Cyp4a2/a8, Klk1, Nox4, Pth1r, Slc5a2 Tubule function, resorption, metabolism
9 194 Oocyte Aurkc, Ccnb1, Magoh, Mnd1, Mos, Nanos2, Ooep, Stem cell renewal, meiosis
Brdt, Dazl, Gsc, Nr5a2, Pcgf1/6, Sall4, Sox15, Tcf15,
Tcl1a, Zfp57
11 188 Variable, not tissue Bub1, Ccna2, Cdk1/2, Cenpk, Lig1, Mki67, Orc1, Cell division cycle, DNA
specific Pcna, Pola1, E2f8, Foxm1 synthesis/repair, mitosis
12 165 ES cells Dppa3/a4, Dusp10, Fgf17, Fzd6, Slc2a3, Deaf1, Stem cell maintenance
Ferd3l, H2az1, Lefty1, Lmo2, Mybl2, Nanog,
Nkx2–8, Tbx3
14 124 Intestine Ace2, Cdh17, Cldn7, Defa family, Dgat1, Heph, Intestinal barrier function
Il20ra, Krt20, Lgals4, Muc13, Vil1, Hnf4g
15 111 Stimulated T cells Cd2, Cd3e, Cd69, Dock2, Il2rg, Ltb, Ptprc, Sla, Was, T-cell function
E2f2, Ets1, Gfi1, Ikzf1/3, Limd2
17 96 Pineal gland/retina Aanat, Arr3, Asmt, Gch1, Opn1sw, Bsx, Crx, Isl2, Pineal function, melatonin synthesis
Lhx4, Mitf, Neurod4, Tafa3
18 95 Retina/pineal gland Cnga1, Gabbr1/2, Opn1mw, Pde6a/b/g/h, Rd3, Retinal function
Rdh8, Rp1, Rtbdn, Bhlhe23, Pax4, Prdm13
19 94 Thymus Ccl25, Cd3d, Cd8a/b, Fas, Rag1, Tap2, Tbata, Thymic differentiation, selection
Foxn1, Ikzf2, Myb, Pax1, Rorc, Tcf7, Themis
20 94 Liver, kidney Cyp2c23, Dcxr, Fbp1, G6pc, Gk, H6pd, Pck1, Gluconeogenesis
Slc22a1, Slc37a4, Hnf1a/4a, Nr1h4
21 94 Macrophage, C1qa/b/c, Csf1r, Ctss, Gpr84, Hexb, Mpeg1, Innate immune function, microglial
microglia P2ry12/13, Siglec5, Tgfbr1, Trem2, Tyrobp, Bhlhe41, differentiation
Irf5
22 90 Skin Cdsn, Csta, Klk9/10/12, Krt4/13/23, Lce3d/e, Skin barrier function
Lipk, Ppl, Trex2, Vsig8, Barx2
23 87 T cells, NK cells Ccl1, Ccr4/5/8, Cd40lg, Gpr183, Ifng, Il17a, Il2, Activation, cytokine secretion
Il2ra/b, Lta, Zap70, Batf, Icos, Runx3, Stat4
24 85 Dorsal root ganglia Acp3, Calca/b, Grik1, Htr1d, Nfeh/l/m, Nmb, Ganglion cell differentiation
Piezo2, Prokr1, Ret, Drgx, Hoxd1, Pou4f1/f2,
Smad9, Tlx3
27, 28 and 33 75, 74 and 65 Skin Adgrf4, Ces4a, Col17a1, keratins, Krtaps, Lce Skin barrier function
family, Lgals7, Lipm, Perp, Tp63, Tprg1
29 69 Testis Aard, Clec12b, Gk5, Hormad1, Inca1, Shbg, Sertoli cell differentiation, synaptonemal
Sycp1/2, Msh4, Nkx3-1, Rhox8, Tbx22, Tsx complex
30 68 B cell Btla, Cd19, Cd79a/b, Cxcr5, Fcna, Gpr174, Ighm, B-cell differentiation, immunoglobulin
Jchain, Ciita, Pax5, Pou2af1, Spib, Tlx1 production
34 65 Prostate Andpro, Cyss, Dach2, Eaf2, Fut4, Lao1, Lyc2, Mc5r, Prostate differentiation, secretion
Pbsn, Sbp, Semg1, Bhlha15, Creb3l4, Esr2
35 64 Adrenal Cbr1, Cyp11a1/b2/b3, Cyp1b1, Fdx1, Kcnk3/9, Steroid hormone production, adrenalin
Mc2r, Pcsk5, Pnmt, Soat1, Star, Ar, Nr5a1
36 and 40 64 and 59 Placenta Ceacam3/9/11/12, Cts7/8, Faslg, Fcrla/b, Ifnk, Trophoblast differentiation, secretion
Il17f, Il23a, Lcn9, Mmp1, Peg10, Prl family, Wnt8a,
Elf5, Hand1, Rhox9
38 60 Brain Crmp1, Ephb2, Gpc2, Gpr85, Marcksl1, Mdga1, Neurogenic progenitor cell differentiation
Mex3b, Dcx, Hmgb3, Lhx6, Mycl, Neurog2,
Runx1t1, Sox11
42 56 Variable Bub3, Ddx39a, Dkc1, Srsf2/3, Trip13, Mycn Genotoxic damage response, tumour
suppressors
43 52 Cochlea, middle ear Cd164l2, Chrna9/10, Cldn9, Fbxo2, Grxcr1/2, Hearing, cochlear function
Kncn, Loxhd1, Otoa/r/s6 NAR Genomics and Bioinformatics, 2022, Vol. 4, No. 1
Table 1. Continued
Cluster Number of
number transcripts Specificity Index genes and TFs Functional annotation
44 51 Blood Cxcr2, Gp9, Gypa, Kel, Pf4, S100a9, Tpt1, Tspo2 Platelets, granulocytes
46 49 Lung Ager, Aqp5, Clec14a, Cyp2a3, Dram1, Fmo2, Alveolar type 1 and type II cell function
Downloaded from https://academic.oup.com/nargab/article/4/1/lqac017/6543592 by EVES-Escola Valenciana dÉstudis de la Salut user on 09 June 2022
Lamp3, Lyz2, Scgb1a1/3a1/3a2, Sftpa1/b/c/d, and secretion
Wnt3a, Hopx, Nkx2-1, Smad6, Tbx4
47 and 83 48 and 24 Heart Actc1, Cav3, Fgf16, Myh7, Myl2, Palld, Ryr2, Cardiac-specific muscle contraction.
Tnnc1, Ehd4, Irx4, Nkx2–5, Pdlim5, Tbx20
48 48 Monocyte, C5ar1, Ccr1, Cd14, Csf2ra, Cyba, Fcgr1a, Itgam, Innate immune function, free radical
macrophage Msr1, Ncf1/2/4, Nlrp3, Slc11a1 production
49 46 Kidney Acre2, Aqp2/3, Cldn8, Insrr, Kcne1, Oxgr1, Foxi1, Distal tubule, collecting duct, water
Hmx2, Hoxd3 resorption
51 45 ES cells Fgf4, Fgf19, Gdf3, Nodal, Pou5f1, Prdm14 Regulation of pluripotency
55 38 Granulocytes Camp, Ctsg, Elane, Fncb, Mpo, Prg2/3, S100a8 Neutrophil granule proteins
63 33 Brain Aqp4, Edil3, Gpr37/62 Mag, Mbp, Mobp, Opalin, Myelination, oligodendrocytes
Plp1, Sema4d, Nkx6-2
64 33 Pancreas Amy2a3, Cel, Cela1/2a/3b, Cpa1/2, Ctrc/l Pnlip, Pancreatic enzymes, secretion
Pnliprp1/2
66 29 Stomach Atp4a/b, Chia, Ctse, Cym, Ghrl, Gkn1/2, Pgc Acidification, digestive enzymes
68 27 Brain, PC12 cells P2rx2, Prph, Th, Vgf, Gata2, Hand2, Phox2a Sympathetic neurons?
77 26 Mast cell?, lymphatic Adgrg5, Cma1, Cpa3, Lilrb3a, Lyve1, Selp, Sirpd,
Slpi, Timd4, Cebpe
82 24 Adipose Adipoq, Fabp4, Lep, Lipe, Lpl, Oxtr, Plin1, Pnpla2, Fat storage, lipolysis, adipokines
Retn, Sucnr1, Tshr, Pparg
87 21 Lens Cryb family, Cryg family, Lim2, Opn4 Lens structural proteins
88 20 Macrophage Adam8, Cd68, Ctsb, Ctsd, Gpnmb, P2rx4 Endosome/lysosome
90 20 Colon Krt19, Lypd8, Phgr1, Pla2g10, Tspan1, Cdx2 Colon epithelium differentiation,
secretion
92 19 Cerebellum Ca8, Cbln1/3, Chn2, Fat2, Gabra6, Grm4, En2, Purkinje cell differentiation, granule
Hes3 proteins
95 19 Variable in many Adgrl4, Cd93, Cdh5, Dll4, Egfl7, Kdr, Pcdh12, Endothelial cell differentiation
tissues Pecam1, Tie1, Erg, Myct1
97 19 Cartilage growth Acan, Clec11a, Col9a1/2/3, Loxl3, Rflna, Alx1, Cartilage structural proteins
plate Nkx3-2
98 18 Activated T cells, Ccr7, Cd7, Cd96, Heca, Foxp3 Immune cell activation
thymus
101 18 Macrophage Acod1, Cxcl10, Il1a/b, Nos2 Response to LPS
106 16 Cartilage, tendon Col2a1, Col10a1, Col11a1/2, Myh3, Ptx4, Zfp648, Cartilage structural proteins
Zim1
Clusters were generated at r ≥ 0.75 and MCL inflation value 2.2. Selected transcripts encoding transcription factors are highlighted in bold. The full lists
of transcripts in these clusters and the average expression profiles are provided in Supplementary Table S2. Index genes were chosen for illustrative purpose
based upon known function in the indicated tissue confirmed by a PubMed search on gene name AND tissue. Where two cluster numbers are shown, the
two clusters are in the same region of the network graph and show closely related expression profiles.
Clusters 17 and 18 contain transcripts expressed in both role in the pineal gland. To illustrate the utility of the data,
the retina and the pineal gland, both intimately involved in in Supplementary Table S2D we have reviewed the annota-
chronobiology and light sensing. Chang et al. (41) recently tion of transcripts in clusters 17 and 18. Several novel tran-
produced an aggregated resource describing the shared and scripts of unknown function [e.g. Katnip, also annotated as
divergent transcriptomes of these structures. Cluster 17 con- LOC361646; KIAA0586 (Talpid3), encoding a highly con-
tains Opn1sw, the pineal-enriched transcription factor Crx served ciliary protein associated with the human genetic dis-
and its target Aanat encoding the rate-limiting enzyme in ease Joubert syndrome (45); and Lrtm1 (LOC102547963),
melatonin synthesis (42). One unexpected inclusion in clus- a novel membrane protein] are also almost uniquely ex-
ter 17, enriched in pineal, is the transcript encoding the tran- pressed in the human pineal gland (http://biogps.org).
scription factor MITF. MITF in humans may be driven by Many smaller clusters detailed in Supplementary Table
as many as seven distinct promoters, including one used S2A are enriched in tissues, cell types or activation states
specifically by melanocytes. A unique transcription start that were not analysed in the existing rat atlases or indeed
site is shared by retinal pigment epithelial cells and pineal in any previous atlas project in other species. They can be
gland. Mitf overexpression in mouse pineal gland relative annotated based upon known markers. For example, clus-
to other tissues has been noted previously (42,43) and in ter 145 with 12 nodes contains transcripts encoding ma-
humans also MITF is most highly expressed in pineal gland jor secreted products of the pituitary (Cga, Gh1, Fshb, Lhb,
(http://biogps.org). However, whereas targets of MITF have Tshb) and the transcription factors that regulate their ex-
been identified in melanocytes and many other cell types pression (Pitx1, Six6, Tbx19). Cluster 180 contains a sub-
(44) and mutations impact many complex phenotypes in set of known immediate early genes (Egr1, Fos, Jun) mostly
mice and humans, there appears to be no literature on its associated with isolated primary cells, and likely reflects cellNAR Genomics and Bioinformatics, 2022, Vol. 4, No. 1 7
activation during isolation or tissue processing (20). Other pancreatic islets, a recent study indicated that gamma cells
known genes in the immediate early class cluster separately, can produce insulin following beta-cell injury (53).
or not at all, because they are constitutively expressed by Each of the clusters contains genes that are identified only
specific cell types. Similarly, groups of inducible genes in as LOCID or other numerical designation. These are ob-
innate immune cells are all expressed by LPS-stimulated viously the subject of ongoing curation and in some cases
macrophages but divide into at least three clusters (cluster LOCID transcripts duplicate named transcripts in the same
Downloaded from https://academic.oup.com/nargab/article/4/1/lqac017/6543592 by EVES-Escola Valenciana dÉstudis de la Salut user on 09 June 2022
101, including Il1a; cluster 112, including Ifit2 and other in- cluster. In Supplementary Table S2, we have included an
terferon targets; and cluster 126, including Tnf) because of update on candidate annotations from the RGD and the
expression by non-immune cells. http://biogps.org/ratatlas server provides a link to RGD be-
Other smaller clusters in Supplementary Table S2A sides the expression profile. Clearly, the co-expression infor-
group genes that share functions. The large protocadherin mation can provide additional assurance that putative or-
family of cell adhesion molecules is broadly divided into thology relationships with known mouse or human genes
the clustered (␣, , ␥ ) and non-clustered (␦) subgroups are likely to be correct.
(46). The ␦ protocadherins are predominantly expressed in
the nervous system and indeed Pcdh1, Pcdh8, Pcdh9 and
Transcripts that do not form clusters
Pcdh20 are brain restricted and part of the second largest
cluster (cluster 2). However, cluster 81 includes Pcdhb22 The first step in network analysis is the generation of a pair-
and 16 members of the Pcdhg (A and B) families, which are wise correlation matrix, and for any gene of interest one can
collectively enriched in the CNS but also widely expressed in immediately identify others with the most similar expres-
other tissues. In addition, LOC108353166 within this clus- sion patterns. By lowering the inclusion threshold (r value),
ter is annotated as protocadherin gamma-B2-like. Further it is possible to include a larger proportion of transcripts,
members are more brain restricted and grouped together in but the associations may become less informative biologi-
cluster 250. cally. For each gene of interest, the correlation function of
Nine of the 13 known mitochondrially encoded pep- the BioGPS site enables extraction of transcripts that are
tides group together in cluster 212, whereas clusters 61 and correlated at lower r values, which may provide some insight
76 group nuclear-encoded mitochondrial genes involved in into function. Genes with unique expression profiles across
the TCA cycle and oxidative phosphorylation (as expected, the samples will not correlate with any other and therefore
most highly expressed in heart and kidney). Cluster 102 will not be included in the network graph. In many cases,
groups 18 transcripts encoding proteins involved in mito- the unique expression profile of a gene of interest arises be-
chondrial -oxidation of fatty acids. Several of the genes cause the gene product is ‘multi-tasking’ in different loca-
in this cluster are mutated in multiple acyl-CoA dehydro- tions. Figure 2 shows the individual profiles of selected ex-
genase deficiency (also known as glutaric aciduria type II) amples discussed later.
and related metabolic disorders (47). One additional gene Mutations in FBN1, encoding the extracellular matrix
involved in this pathway, Etfb, does not form part of a clus- protein fibrillin-1, are associated with Marfan syndrome
ter. The web server (http://biogps.org/ratatlas) shows that that has complex impacts on musculoskeletal development,
Etfb is significantly correlated with many other genes as- adiposity, vascular function and the eye. Distinct 3 trun-
sociated with mitochondrial -oxidation (e.g. with Etfa at cation mutations are associated with a neonatal progeroid
r = 0.59 and with Etfdh at r = 0.54) but is expressed at lower lipodystrophy syndrome (54). Consistent with these pheno-
levels in certain tissues, including the pineal gland. types, Fbn1 mRNA is highly expressed uniquely in the rat
Cluster 127, with 14 nodes, contains two markers of eye, aorta and cardiovascular tissues and cartilage/tendons
neurogenic cells [Sstr2, Mpped1 (48,49)] and a candidate and to a lesser extent in fibroblasts and adipose. There is
regulator, Tiam2 (50), and is otherwise made up of 11 also moderate expression in spinal cord and dorsal root
brain-specific transcriptional regulators, each of which has ganglia, lung and testis. Dural ectasia, enlargement of the
been shown to be essential for neurogenesis and likely in- neural canal, is a common feature of Marfan syndrome (55).
teracts with the others. Clusters 125 and 332 contain 20 Expression in the lung may underlie the pulmonary emphy-
genes encoding proteins that have all been implicated as sema observed in mouse models of fibrillinopathy (56); pa-
molecular chaperones, including multiple components of tients with Marfan syndrome frequently show apical blebs
the TRIC chaperone complex (Tcp1, Cct2, Cct3, Cct4, in the lung and are prone to pneumothorax (collapsed lung).
Cct5). Cluster 557 with only four nodes contains the oligo- Although Fbn1 does not form part of a cluster at r > 0.75,
dendrocyte transcription factors, Olig1 and Olig2, as well the BioGPS correlation function reveals 52 genes correlated
as Sox 8, which has non-redundant function in oligoden- at r > 0.6, mostly associated with mesenchyme and extra-
drocyte differentiation (51). The fourth node in this clus- cellular matrix biology (e.g. Adamts2, Bgn, Col5a1, Loxl1,
ter, LOC103692025, is predicted by the RGD to be an or- Pdgfrb, Tgfb3) (57).
tholog of Lhfpl3, which in mouse is a marker of oligo- The gene encoding dystrophin (DMD) associated in hu-
dendrocyte lineage commitment (52). The two calmodulin- mans with mutations causing Duchenne muscular dystro-
encoding genes (Calm1 and Calm2) are co-expressed (clus- phy is also not clustered. As expected, it is expressed in rat
ter 673) as are three genes involved in cholesterol synthesis cardiac, skeletal and uterine muscle, but is also expressed
(Fdft1, Hmgcr, Hmgcs1) (cluster 742). Ins1 and Ins2, en- in multiple brain regions at similar levels. This expression
coding insulin, are co-expressed with pancreatic polypep- may be related to the neuropsychiatric impacts of the dis-
tide (Ppy) (cluster 751) but not with glucagon (Gcg). Al- ease in both affected individuals and mouse models (58). In
though Ppy is normally expressed by rare gamma cells in this case, FANTOM5 data indicate that DMD has at least8 NAR Genomics and Bioinformatics, 2022, Vol. 4, No. 1
Downloaded from https://academic.oup.com/nargab/article/4/1/lqac017/6543592 by EVES-Escola Valenciana dÉstudis de la Salut user on 09 June 2022
Figure 2. Gene expression profiles for genes that did not fall within a cluster. Y-axis shows the expression level in TPM. X-axis shows the organ system,
coloured as in Supplementary Table S2. Reading from left to right: light red, nervous system; blue, auditory system; light green, respiratory system; yellow,
cardiovascular system; pink, digestive system; turquoise, endocrine system; salmon, liver; grey, renal system; dark red, skeletomuscular system; dark blue,
integumentary system; dark green, immune system; olive, male reproductive system; dark pink, female reproductive system; dark turquoise, primordia/early
development; black, whole body (embryo); and red, mixed tissues.
two independent promoters (6). Nevertheless, several other A significant cohort of transcripts is excluded from co-
genes associated with muscular dystrophy (Sgcd, Lama2, expression clusters because they have alternative promot-
Dst) are correlated with Dmd at r > 0.6 (see BioGPS site). ers, each with a distinct expression profile. One such gene is
RGD1359108 is a clear 1:1 ortholog of human C9orf72, Acp5, encoding the widely used osteoclast (OCL) marker,
associated with amyotrophic lateral sclerosis and frontal tartrate-resistant acid phosphatase. Acp5 forms part of a
temporal dementia. O’Rourke et al. (59) reported that small cluster (cluster 179, 10 nodes) that is most highly
loss of function mutation in the orthologous gene in expressed in the femoral diaphysis, and includes another
mice did not produce motor neuron dysfunction, but did OCL marker Ctsk, osteoblast-associated transcripts (Bglap,
lead to macrophage dysfunction, splenomegaly and lym- Dmp1 and Sp7) and Ifitm5, mutated in a human bone-
phadenopathy. In rat, the ortholog of C9orf72 is expressed related genetic disease, osteogenesis imperfecta type V. It is
widely in all CNS-associated tissues, most highly in spinal surprising that so few transcripts are stringently associated
cord, but not enriched in any isolated CNS cell population. with OCL; another small cluster (cluster 174, 11 nodes) that
Outside the CNS, it is most highly expressed in stimulated contains Dcstamp, Ocstamp (Zfp334) and Mmp9 is enriched
macrophages and in testis. in the diaphysis sample but more widely expressed. Expres-NAR Genomics and Bioinformatics, 2022, Vol. 4, No. 1 9
sion of Acp5 in OCL in mice is initiated from an OCL- Table 2. Gene expression clusters from rat liver
specific promoter (60). Aside from its function as a lyso- Liver
somal enzyme in bone resorption, secreted ACP5 can func- cluster Number
tion as a neutral ATPase and a growth factor for adipocytes number of nodes Description and index genes
(61,62). Acp5 mRNA is expressed, albeit at lower levels than 1 6292 Widely expressed, high in bile duct ligation
in bone, in rat adipose, lung (where it is expressed highly
Downloaded from https://academic.oup.com/nargab/article/4/1/lqac017/6543592 by EVES-Escola Valenciana dÉstudis de la Salut user on 09 June 2022
model; growth, protein synthesis,
by alveolar macrophages), small and large intestine, kidney inflammation, fibrosis, connective tissue
and spleen as well as isolated macrophages. 2 752 High in foetal liver; cell cycle, haematopoiesis,
embryonic liver; cyclins, Cdk1, Pcna, Igf2, Hbb,
S100a8/9, E2f2, Klf1, Myb
The transcriptome of the rat liver 3 414 General expression, metabolic
regulation; Bcl2l2, Cdk5, Cirbp, Esrra, Foxk1,
The downloaded datasets included around 1900 individual Hdac6, Nfe2l1, Nr1h2, Nr2c1, Pias3, Rara,
RNA-seq libraries of liver, including whole liver from vari- Six5, Tfe3, Tfeb
4 278 General expression, control of lipid
ous ages, sexes, inbred and outbred rat strains, disease mod- metabolism; Arid1a, Bcl9, Camta2, Crtc1/2,
els, liver slice cultures and isolated cells. In principle, cluster- Fastk, Foxj2, Foxp4, Hsf1, Mef2d, Rela, Rfx1,
ing of such diverse data could identify sets of co-expressed Rxrb, Tp53
transcripts that are associated with cell types, locations or 5 206 Isolated samples, gall bladder,
neuroendocrine; Cckar, Chga/b, Cldn10/18,
disease processes that are hidden in the averaged data of the Inha, Krtap1–3, Lgr5, Scg3/5, Nmb, Nts
complete sample set. To test that view, we clustered the en- 6 166 E14 liver, fibrosis model; Acta2, Cdh11,
tire liver-related dataset without averaging the replicates. As Epha4/7, Fbn2, Gpc2, Myh6/7, Sfrp1/2, Alx,
in the main atlas, the correlation threshold was chosen em- Cited1, Foxf1, Gata5, Shox2, Tbx15/18, Tgif2,
pirically at 0.75. The cluster list and the average profile of Twist1/2, Wt1
7 148 Foetal liver, fibrosis, Zucker rats: myeloid
transcripts in each cluster are provided in Supplementary infiltration; Axl, Cd4, Cd68, Clec4a1, Fcgr1a,
Table S3A and informative clusters are summarized in Ta- Hk3, Lyz2, Ptprc, Irf5, Fli1, Spi1
ble 2. 10 98 Variable expression: proteasome complex,
It is immediately evident that not all of the samples are proteolysis; Anxa7, Ctsd/l, Fbxo22, Prdx1/6,
Psma, Psmb2, Psmc1, Psmd1, Tmx2,
pure liver. Liver cluster 31 contains a set of pancreas-specific Usp5, Creb3
genes, including Cpa1 that overlaps with cluster 64 in the 11 76 Variable, low in foetal liver, periportal
main atlas. This cluster arises because of random contam- hepatocytes, urea synthesis; Agmat, Ass1,
ination with pancreatic tissue of liver samples in the large Ces1a, Cyp2e1, Gls2, Gcgr, Gpt, Hsd17b11,
BodyMap project (32). Liver cluster 73 contains transcripts Pink1, Slc25a22; Mlxipl, Nr1i2
13 67 Variable, low in foetal liver, fibrosis model, fatty
encoding all of the major secretory products of pancreatic acid -oxidation; Acat1, Acot1, Crat, Cyp4a1,
islets (e.g. Ins1 and Gcg). This cluster was detected only in Etfdh, Hadh, Pank1, Pdk4, Slc22a5, Vnn1
liver from a study of enforced activity and sleep depriva- 16 and 105 and Variable, cholesterol and fatty acid
tion (63). It is not clear from the paper how these samples 70 10 syntheses; Aacs, Acaca, Acly, Dhcr7, Fads1/2,
Fasn, Hmgcr, Hmgcs1, Lss, Mvd, Nfe2,
could have been selectively contaminated with islet mRNA Srebf1/2
unless they are mislabelled. Liver cluster 5 is detected in a 18 54 Fibrosis; Angptl4, Col1a1/2, Col6a1/6, Gpc1,
rather random subset of samples from multiple BioProjects Lgals1, Loxl1, Lum, S100a4, Sfpr4, Etv1, Osr2
likely also indicating contamination. It includes the pro- 24 41 Variable, mast cells; Cpa3, Cpz, Mcpt2, Prss8
genitor marker, Lgr5, but also various adhesion molecules 25 41 Variable, interferon response; Dhx58, Gbp1/4,
Ifi44, Ifit1, Isg15, Mx1/2, Oas1/2, Irf7
(Cldn10/18) and neuroendocrine markers (Chga/b). There 26 41 Variable, mitochondrial; Atp5me/f/g, Cox7ab,
is little evidence of expression of these genes in normal Ndufa2/4/5/6
liver in other species, and at least some of the genes (e.g. 31 34 One BioProject, pancreas
Cckar and Cldn10/18) are highly expressed in pancreas contamination; Cela1, Cpa1, Klk1, Pnlip, Prrs1
33 32 One BioProject, NK cells; Cd96, Gzma, Klra1,
and/or stomach (e.g. see http://biogps.org). Liver cluster 21 Ly49, Prf1
is detected in a single sample, and contains smooth muscle- 34 31 Highly variable, hepatic stellate cell activation?
associated transcripts (Actg2, Tpm2). Acvr1c, Apob, Egfr, Fcgr2b, Klb, Mrc1,
The disadvantage of analysing a single tissue is that most Stab2, Klf12, Nr3c2
transcripts do not vary greatly between datasets. In one 43 21 Variable, interferon response; Adar, Ifih1,
Parp9/10/12/14, Irf9
sense, this provides a quality control for the efficacy of the 56 12 Kupffer cell; Cd5l, Csf1r, Sdc3, Siglec1, Vsig4
random sampling approach we have used. In this dataset, 63 10 Endothelial cell; Cd93, Cdh5, Flt1, Nrp1,
the largest cluster by far (liver cluster 1) is relatively consis- Pecam1, Tgfbr3, Tie1, Ets1, Tbx20
tent with the exception of increased detection in all samples 65 10 Class II MHC; Aif1, Batf2, Cd74, Rt1-Ba/b,
RT1-Da/b, Irf8, Ciita
from a BioProject that profiled liver slices from a bile duct 66 10 Male-specific; Akr1c12, Cyp2a2, Hsd3b5,
ligation model, cultured for 48 h in vitro and treated with Sult1c3
various agents (64). It is not clear why this gene set would 69 10 Xenobiotic-induced; Ces2a, Gstm2, Ugt1a5
be expanded in that cellular system. Liver cluster 1 includes 84 9 Female-specific; Akr1b7, Cyp2c12, Srd5a1,
many transcripts expressed constitutively by hepatocytes. Sult2a1/6, Cux2, Trim24
The most abundant hepatocyte-specific transcript encod- Clusters were generated at r ≥ 0.75 and MCL inflation value 1.7. The full
ing albumin (Alb) is not strictly correlated with any other gene lists for each of the clusters are provided in Supplementary Table S3A.
transcript presumably reflecting its specific regulation (65). Transcription factors are highlighted in bold. Index genes were chosen for
illustrative purpose based upon known function.10 NAR Genomics and Bioinformatics, 2022, Vol. 4, No. 1
Liver cluster 1 also contains transcripts encoding markers is most highly expressed in brain and brain-derived cells
of hepatic stellate cells (e.g. Pdgfra/b) and the correspond- and includes transcripts that are enriched in microglia com-
ing growth factors (Pdgfa/b/d) as well as more general mes- pared to macrophages from other tissues (e.g. P2ry12).
enchyme markers (e.g. Vim) and markers of cholangiocytes Around two-thirds of these transcripts are contained within
(e.g. Krt7) suggesting that their relative abundance is not a set of 119 transcripts depleted in all brain regions of
highly variable among the samples. Csf1r-knockout rats (69). Cluster 47 (Supplementary Table
Downloaded from https://academic.oup.com/nargab/article/4/1/lqac017/6543592 by EVES-Escola Valenciana dÉstudis de la Salut user on 09 June 2022
The remaining liver clusters analyse differential devel- S2) contains transcripts that may be shared with microglia
opment and activation states that distinguish the samples (e.g. Itgam, encoding CD11b) but are common to mono-
and BioProjects. These clusters are informative and con- cytes and many tissue macrophage populations. Cell sur-
sistent with prior knowledge. Liver cluster 2 is expressed face markers of other macrophage populations cluster id-
specifically in embryonic liver and is a complex mix of tran- iosyncratically as shown in Supplementary Table S2, indi-
scripts reflecting both differentiation of hepatocytes and the rectly supporting tissue macrophage heterogeneity; Clec4f,
function of the liver as a haematopoietic organ. Accord- the Kupffer cell marker, is within the liver cluster, Vsig4 and
ingly, it contains the cell cycle genes, the foetal growth fac- Marco (cluster 1239), Clec10a , Mrc1 (CD206) and Stab1
tor Igf2, and markers of erythroid (e.g. Hbb) and myeloid (cluster 168), Lyve1 and Timd4 (cluster 79), and Adgre1 and
(S100a8/a9) haematopoietic lineages. Liver clusters 3 and 4 Clec4a1/3 (cluster 286) are correlated with each other, while
are both expressed in almost all liver samples and the level others (e.g. Cd163, Tnfrsf11a, Siglec1) do not cluster at all
of expression is not highly variable. Expression of each of at this threshold because each has a unique pattern of ex-
the smaller clusters is much more variable between samples pression in tissue macrophages. Figure 3 shows the profiles
and BioProjects and known genes within those clusters in- of Csf1r, Adgre1, Cd163, Vsig4 and Mrc1 in the averaged
dicate an association with specific cell types and processes data.
as summarized in Table 2 and discussed later. The network analysis of such a diverse set of cells and
One signature that was not detected is that of the spe- tissues also dissociates known macrophage transcriptional
cialized centrilobular population that is adapted to clear regulators (e.g. Spi1, Spic, Nr1h3, Mafb, Irf8, Cebpa/b,
ammonia generated by the urea cycle. In mice, the rate- Tfec) (20) from macrophage expression clusters because
limiting enzyme, glutamate ammonia lyase (also known as none of these regulators is entirely macrophage restricted.
glutamine synthetase, Glul gene), is expressed exclusively in For example, transcription factor SPIC in mice is required
a band of cells surrounding the central vein. Liver-specific for splenic red pulp macrophage and splenic iron homeosta-
deletion of Glul leads to pathological hyperammonaemia sis (70). In the rat, Spic mRNA is most highly expressed in
(66). In mice, this population of cells co-expressed Rhgb spleen as expected, but also detected in ES cells and germ
(encoding an ammonia transporter) and ornithine amino- cells (see profile on http://biogps.org/ratatlas). Macrophage
transferase (Oat) and was enriched for a number of Cyp differentiation and adaptation likely involve combinatorial
genes (e.g. Cyp2e1 and Cyp1a2). However, in the diverse rat interactions among multiple transcription factors as exem-
liver dataset, there was only marginal correlation with other plified by the complex regulation of the transcription of the
centrilobular-enriched transcripts. Csf1r gene (71).
Whereas macrophages express a diversity of endocytic re-
ceptors, there is not a corresponding large cluster of tran-
The transcriptome of central nervous, renal, musculoskeletal
scripts encoding endosome–lysosome components includ-
and cardiovascular systems
ing the vacuolar ATPase (ATP6v) subunits and lysoso-
Each of these systems also contributes hundreds of RNA- mal hydrolases. Transcripts encoding endosome-associated
seq datasets including isolated cells and specific regions CD68 and GPNMB proteins are co-expressed with Ctsb
or structures. To further examine the utility of these large and Ctsd. Although CD68 is often used as a macrophage
datasets for the analysis of cell type- and process-specific marker, it is clearly not macrophage restricted. Most tran-
signatures, the data from each of these biological systems scripts encoding lysosomal acid hydrolases (e.g. Acp1, Lipa)
were clustered separately in Supplementary Table S4 (ner- are widely expressed and each varies independently.
vous), Supplementary Table S5 (renal), Supplementary Ta- Csf1r is strongly correlated with other macrophage-
ble S6 (cardiovascular) and Supplementary Table S7 (mus- specific markers in cluster 21, consistent with strong
culoskeletal). The clusters are annotated in the tables and evidence that expression is entirely restricted to the
to avoid confusion with multiple cluster numbers, each sys- macrophage lineage in rats as it is in mice (72). It is also de-
tem is discussed separately in Supplementary Text. Broadly tected at relatively high levels in all tissues (around 5–10%
speaking, as in the liver, network analysis of individual or- of the level in isolated macrophages) consistent with the
gan systems enables a more fine-grained extraction of cell abundance of tissue macrophages detectable with a Csf1r
type-, region- and process-specific expression signatures. reporter transgene (72) and with a study of tissue devel-
opment in mice (73). However, expression was also de-
tected in many isolated primary cell samples that are not
The transcriptome of rat macrophages
meant to contain macrophages. For example, BioProjects
The transcriptome of rat macrophages has been analysed PRJNA556360 and PRJNA552875 contain RNA-seq data
previously based upon microarrays (67) and the RNA-seq derived from oligodendrocyte progenitors purified using the
data included here (68). Macrophages adapt to perform A2B5 marker, but this population has Csf1r expression at
specific functions in specific tissues (20). Cluster 21 (Ta- similar levels to purified macrophages. Another BioProject,
ble 1 and Supplementary Table S2), which includes Csf1r, PRJNA355082, describes expression profiling of isolatedNAR Genomics and Bioinformatics, 2022, Vol. 4, No. 1 11
Downloaded from https://academic.oup.com/nargab/article/4/1/lqac017/6543592 by EVES-Escola Valenciana dÉstudis de la Salut user on 09 June 2022
Figure 3. Gene expression profiles for macrophage-related genes. Y-axis shows the expression level in TPM. X-axis shows the organ system, coloured as in
Supplementary Table S2. Reading from left to right: light red, nervous system; blue, auditory system; light green, respiratory system; yellow, cardiovascular
system; pink, digestive system; turquoise, endocrine system; salmon, liver; grey, renal system; dark red, skeletomuscular system; dark blue, integumentary
system; dark green, immune system; olive, male reproductive system; dark pink, female reproductive system; dark turquoise, primordia/early development;
black, whole body (embryo); and red, mixed tissues.12 NAR Genomics and Bioinformatics, 2022, Vol. 4, No. 1
astrocytes, but this dataset also has a similar level of Csf1r Analysis of liver-specific transcriptional network
mRNA to pure macrophages. Other datasets from various
The assembled dataset includes multiple BioProjects and
ganglion cell populations, neuronal progenitor cells, cardiac
thousands of RNA-seq datasets related to the liver, cen-
fibroblasts and cardiomyocytes and hepatic stellate cells are
tral nervous system, heart and cardiovascular system, and
clearly highly enriched in Csf1r and other macrophage-
kidney. Each has been analysed independently to identify
associated transcripts.
Downloaded from https://academic.oup.com/nargab/article/4/1/lqac017/6543592 by EVES-Escola Valenciana dÉstudis de la Salut user on 09 June 2022
signatures of individual cell types and processes (Supple-
CSF1R has two ligands, CSF1 and IL34. In mice and
mentary Tables S3–S7). To illustrate the ability of network
rats, mutation of the Csf1 gene leads to a global reduc-
analysis to extract biologically informative expression sig-
tion in many tissue macrophage populations, whereas muta-
natures, we analysed the liver data in greater detail and con-
tion of Il34 in mice leads to selective reduction of microglia
sidered other tissue-specific analysis in Supplementary Text.
and Langerhans cells. Based upon the difference in pheno-
Liver gene expression is regulated in response to numer-
type between Csf1 and Csf1r mutations in rats, we specu-
ous physiological stimuli and chronic disease processes, in-
lated that Il34 could be more widely expressed and func-
cluding fatty liver disease. Aside from hepatic parenchy-
tional in rat macrophage homeostasis compared to mouse
mal cells, the liver contains several non-parenchymal pop-
(68). Neither growth factor forms part of a cluster. Figure 3
ulations. To identify co-regulated clusters within the liver
also shows the profiles of Csf1 and Il34. As expected, Csf1
transcriptome, we analysed the liver samples separately us-
mRNA is widely expressed and enriched in isolated mes-
ing the same GCN approach used for the overall atlas. The
enchymal cells. Il34 is expressed in all brain regions and
liver is the major source of plasma protein and performs
isolated cells at similar levels and also in skin. However, in
many functions in energy homeostasis, lipid and protein
contrast to mouse, Il34 is expressed at similar levels in many
synthesis, and biotransformation of xenobiotics and en-
other tissues, notably aorta, adipose, kidney, lung and testis.
dogenous by-products. The function of the liver depends
The tissue-specific analysis in Supplementary Tables S4–
on its structure, which comprises small units called lob-
S7 enables the extraction of macrophage-specific signatures
ules, each composed of concentric layers of hepatocytes
from resident populations that have not been isolated and
expanding from the central vein towards the periportal
characterized previously. For example, in the cardiovascu-
vein. The metabolic function of hepatocytes varies along
lar analysis, a cluster of 184 transcripts containing Csf1r as
the periportal–central axis, a phenomenon referred to as
well as a smaller cluster containing Adgre1 extracts a sig-
metabolic zonation (74). In principle, if there was significant
nature of cardiac resident macrophages distinct from blood
heterogeneity in metabolic state or development among the
leukocytes that form a separate cluster (see Supplementary
liver samples, a gene-to-gene clustering might reveal sets
Text).
of genes associated with portal versus centrilobular regions
of liver lobules. Halpern et al. (75) performed single-cell
RNA-seq (scRNA-seq) analysis of mouse hepatocyte diver-
DISCUSSION sity and concluded that zonation impacts as many as 50%
of transcripts. However, this analysis was limited to 8-week-
Overview old fasted male C57BL/6 mice and does not necessarily cap-
The extraction and normalization of published RNA-seq ture coordinated regulation of the metabolic domains, in-
data have enabled the generation of a comprehensive rat cluding diurnal oscillations and response to feeding (76).
expression atlas that samples transcriptional diversity on Broadly speaking, the single-cell analysis indicated a peri-
a comparable scale to the FANTOM5 data for human portal bias for major secretory products of hepatocytes and
and mouse (6) and massively extends the BodyMap gen- a pericentral concentration of expression of genes involved
erated from 11 rat tissues (32). The user-friendly display in xenobiotic metabolism.
at http://biogps.org/ratatlas enables a gene-specific query to Network analysis shown in Supplementary Table S3A
visualize the expression of any gene of interest across the and summarized in Table 2 revealed a large co-regulated
full dataset and use of the correlation function allows the cluster (liver cluster 11) that includes Gls2, an archety-
identification of transcripts with similar expression profiles. pal periportal marker in mice, other enzymes and trans-
BioGPS also hosts large expression datasets for mouse, hu- porters associated with the urea cycle (Ass1, Acy3, Ag-
man, sheep and pig for comparative analysis. The valid- mat, Cbs, Gpt, Slc25a22, Nags) and the glucagon recep-
ity of the downsampling normalization and the utility and tor, Gcgr. Cheng et al. showed that glucagon is a regula-
information content of the atlas have been exemplified by tor of zonation in mouse liver, in that glucagon deficiency
gene-centred network analysis of the averaged core dataset. led to reduced expression of periportal-enriched transcripts
The primary data are available for download by users in a (77). There are candidate transcriptional regulators within
form that enables local regeneration of the networks and this cluster with known functions in hepatic transcriptional
addition of user-generated datasets. In comparison to rat, regulation: the xenobiotic sensor Nr1i2 and the glucose-
there are orders of magnitude more total RNA-seq datasets sensing transcription factor Mlzipl (78,79). A smaller liver
from mouse and human cells and tissues in public reposi- cluster 88 contains additional key enzymes of urea synthe-
tories. We previously identified and analysed 470 RNA-seq sis, Arg1, Cps1 and Gpt2, as well as the amino acid trans-
datasets from mouse resident tissue macrophages alone, ex- porter, Slc38a4.
cluding data from cells stimulated in vitro or in disease mod- The analysis of the liver samples does not reveal a cor-
els (20). The approach we have used is extensible to even responding pericentral expression cluster. Glul, which ap-
larger datasets in mouse and human. pears strictly restricted to a single layer of cells surroundingYou can also read