Exploiting the GTEx resources to decipher the mechanisms at GWAS loci
←
→
Page content transcription
If your browser does not render page correctly, please read the page content below

Barbeira et al. Genome Biology    (2021) 22:49
https://doi.org/10.1186/s13059-020-02252-4

 RESEARCH                                                                                                                                      Open Access

Exploiting the GTEx resources to
decipher the mechanisms at GWAS loci
Alvaro N. Barbeira1† , Rodrigo Bonazzola1† , Eric R. Gamazon2,3,4,5† , Yanyu Liang1† , YoSon Park6,7† ,
Sarah Kim-Hellmuth8,9,10 , Gao Wang11 , Zhuoxun Jiang1 , Dan Zhou2 , Farhad Hormozdiari12,13 ,
Boxiang Liu14 , Abhiram Rao14 , Andrew R. Hamel12,15 , Milton D. Pividori1 , François Aguet12 , GTEx GWAS
Working Group, Lisa Bastarache16,17 , Daniel M. Jordan18,19,20 , Marie Verbanck18,19,20,21 , Ron Do18,19,20 ,
GTEx Consortium, Matthew Stephens11 , Kristin Ardlie12 , Mark McCarthy22 , Stephen B. Montgomery23,24 ,
Ayellet V. Segrè12,15 , Christopher D. Brown6 , Tuuli Lappalainen9,10 , Xiaoquan Wen25 and Hae Kyung Im1*

*Correspondence:
haky@uchicago.edu                       Abstract
† Alvaro N. Barbeira, Rodrigo
                                        The resources generated by the GTEx consortium offer unprecedented opportunities
Bonazzola, Eric R. Gamazon, Yanyu
Liang, and YoSon Park contributed       to advance our understanding of the biology of human diseases. Here, we present an
equally to this work.                   in-depth examination of the phenotypic consequences of transcriptome regulation
1
  Section of Genetic Medicine,          and a blueprint for the functional interpretation of genome-wide association
Department of Medicine, The
University of Chicago, Chicago, IL,     study-discovered loci. Across a broad set of complex traits and diseases, we
USA                                     demonstrate widespread dose-dependent effects of RNA expression and splicing. We
Full list of author information is
available at the end of the article
                                        develop a data-driven framework to benchmark methods that prioritize causal genes
                                        and find no single approach outperforms the combination of multiple approaches.
                                        Using colocalization and association approaches that take into account the observed
                                        allelic heterogeneity of gene expression, we propose potential target genes for 47%
                                        (2519 out of 5385) of the GWAS loci examined.

                                      Introduction
                                      In the last decade, the number of reproducible genetic associations with complex human
                                      traits that have emerged from genome-wide association studies (GWAS) has substan-
                                      tially grown. Many of the identified associations lie in non-coding regions of the genome,
                                      suggesting that they influence disease pathophysiology and complex traits via gene reg-
                                      ulatory changes. Integrative studies of molecular quantitative trait loci (QTL) [1] have
                                      established gene expression as a key intermediate molecular phenotype, and improved
                                      functional interpretation of GWAS findings, spanning immunological diseases [2], vari-
                                      ous cancers [3, 4], lipid traits [5, 6], and a broad array of other complex traits.
                                        Large-scale international efforts such as the Genotype-Tissue Expression (GTEx) Con-
                                      sortium have provided an atlas of the regulatory landscape of gene expression and splicing

                                      © The Author(s). 2021 Open Access This article is licensed under a Creative Commons Attribution 4.0 International License,
                                      which permits use, sharing, adaptation, distribution and reproduction in any medium or format, as long as you give appropriate
                                      credit to the original author(s) and the source, provide a link to the Creative Commons licence, and indicate if changes were
                                      made. The images or other third party material in this article are included in the article’s Creative Commons licence, unless
                                      indicated otherwise in a credit line to the material. If material is not included in the article’s Creative Commons licence and your
                                      intended use is not permitted by statutory regulation or exceeds the permitted use, you will need to obtain permission directly
                                      from the copyright holder. To view a copy of this licence, visit http://creativecommons.org/licenses/by/4.0/. The Creative
                                      Commons Public Domain Dedication waiver (http://creativecommons.org/publicdomain/zero/1.0/) applies to the data made
                                      available in this article, unless otherwise stated in a credit line to the data.
Barbeira et al. Genome Biology   (2021) 22:49                                                                   Page 2 of 24

                  variation in a broad collection of primary human tissues [7–9]. Nearly all protein-coding
                  genes in the genome now have at least one local variant associated with expression
                  changes and the majority also have common variants affecting alternative splicing (FDR <
                  5%) [9]. In parallel, there has been an explosive growth in the number of genetic discover-
                  ies across a large number of traits, prompting the development of integrative approaches
                  to characterize the function of GWAS findings [10–14]. Nevertheless, our understanding
                  of underlying biological mechanisms for most complex traits substantially lags behind the
                  improved efficiency of the discovery of genetic associations, made possible by large-scale
                  biobanks and GWAS meta-analyses.
                    One of the primary tools for the functional interpretation of GWAS associations has
                  been the integrative analysis of molecular QTLs. Colocalization approaches that seek to
                  establish shared causal variants (e.g., eCaviar [15], enloc [16], and coloc [17]), enrich-
                  ment analysis (S-LDSC [18] and QTLEnrich [11]), or mediation and association methods
                  (SMR [12], TWAS [13], and PrediXcan [19]) have provided important insights, but they
                  are often used in isolation, and there have been limited prior assessments of power and
                  error rates associated with each [20]. Their applications often fail to provide a compre-
                  hensive, biologically interpretable view across multiple methods, traits, and tissues or
                  offer guidelines that are generalizable to other contexts. Thus, a comprehensive assess-
                  ment of expression and splicing QTLs for their contributions to disease susceptibility and
                  other complex traits requires the development of novel methodologies with improved
                  resolution and interpretability.
                    Here, we present methods and resources that help elucidate how genetic variants
                  associated with gene expression (cis-eQTLs) or splicing (cis-sQTLs) contribute to, or
                  mediate, the functional mechanisms underlying a wide array of complex diseases and
                  quantitative traits. Since splicing QTLs have largely been understudied, we perform
                  a comprehensive integrative study of this class of QTLs, in a broad collection of tis-
                  sues, and disease associations. We provide predictions of functional mechanisms for 74
                  distinct complex traits from 87 GWA study results and demonstrate independent val-
                  idation and evaluation of findings using likely causal gene-disease relationships in the
                  Online Mendelian Inheritance of Man (OMIM) database. Notably, we find widespread
                  dose-dependent effects of cis-QTLs on traits through multiple lines of evidence. We
                  examine the importance of considering, or correcting for, false functional links attributed
                  to GWAS loci due to neighboring but distinct causal variants. We call this confound-
                  ing LD contamination for the remainder of the paper. To identify predicted causal
                  effects among the complex trait-associated QTLs, we conduct systematic evaluation
                  across different methods. Furthermore, we provide guidelines for employing complemen-
                  tary methods to map the regulatory mechanisms underlying genetic associations with
                  complex traits.

                  Mapping the regulatory landscape of complex traits
                  The final GTEx data release (v8) included 54 primary human tissues, 49 of which included
                  at least 70 samples with both whole genome sequencing (WGS) and tissue-specific RNA-
                  seq data. A total of 15,253 samples from 838 individuals were used for cis-QTL mapping
                  (Fig. 1) [9]. In addition to the expression quantitative trait loci (eQTL) mapping, we also
                  evaluated genetic variation associated with alternative splicing (sQTL) and their impact
                  on complex traits.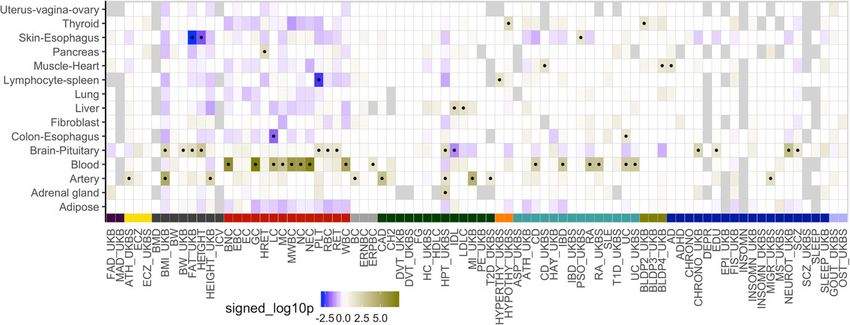
Barbeira et al. Genome Biology       (2021) 22:49                                                                                       Page 3 of 24

                    Fig. 1 Overview of workflow for mapping complex trait-associated QTLs. Full variant association summary
                    statistics results from 114 GWAS were downloaded, standardized, and imputed to the GTEx v8 WGS variant
                    calls (maf > 0.01) for analyses. A total of 8.87 million imputed and genotyped variants were investigated to
                    identify trait-associated QTLs. A total of 49 tissues, 87 studies (74 distinct traits), and 23,268 protein-coding
                    genes and lncRNAs remained after stringent quality assurance protocols and selection criteria. A wide array of
                    complex trait classes, including cardiometabolic, anthropometric, and psychiatric traits, were included

                     We downloaded and processed 114 publicly available GWAS datasets with genome-
                  wide variant association summary statistics (here onwards, summary statistics). After
                  data harmonization, format standardization, missing data imputation, and other quality
                  assurance steps (Additional file 1: Fig. S1, Fig. S2, and Fig. S3), we retained 87 datasets
                  representing 74 distinct complex traits including cardiometabolic, hematologic, neu-
                  ropsychiatric, and anthropometric traits (Additional file 1: Fig. S4). We provide the full
                  list of datasets used in our study and all processing scripts as a resource to the community
                  (Additional file 2: Table S1 and Additional file 1: Table S2).
                     Using these resources, we sought to identify likely causal associations among these
                  gene- and alternatively spliced transcript-associated variants (eVariants and sVariants,
                  respectively). For this purpose, we applied colocalization, enrichment, and associa-
                  tion analyses, and provide a resource to enable investigations into gene prioritization
                  approaches for disease associations.
                     Gene expression and alternative splicing dysregulations have been proposed as the
                  underlying mechanism of the association signals in many diseases [5, 11, 21–24]. Sim-
                  ilar to previous reports [8], we observed robust and widespread enrichment of eQTLs
                  and sQTLs among disease-associated variants (Fig. 2). This observation suggests a causal
                  role for expression and splicing regulation in complex traits. Figure 2 also illustrates the
                  dangers of using a naive approach to assigning causal genes to GWAS variants that are
                  associated with expression or splicing, especially when using loose p value thresholds. For
                  example, with a p value threshold of 0.05, over 97% of common variants will be assigned
                  some gene in some tissue associated at that level.
Barbeira et al. Genome Biology       (2021) 22:49                                                                                         Page 4 of 24

                    Fig. 2 Expression and splicing QTL enrichment among GWAS variants. The proportion of genetic variants
                    associated with gene expression (a) and splicing (b) of at least one gene in at least one tissue for each p value
                    cutoff (on x-axis in − log10 (p) scale) is shown. The proportions for all tested variants are shown as circles, and
                    the proportions for the GWAS catalog variants are shown as squares

                  Dose-dependent regulatory effects of expression and alternative splicing on
                  complex traits
                  Nevertheless, enrichment studies can be confounded by many unknown factors. There-
                  fore, we sought to gather stronger evidence for a causal link by testing whether there is
                  a dose-dependent effect of expression and splicing QTLs on complex traits. Figure 3a
                  illustrates schematically our approach. We examined whether expression or splicing asso-
                  ciated variants (referred to as e/sVariants for the remainder of the paper) with higher
                  impact on gene expression or splicing lead to higher impact on a complex trait, i.e., a
                  larger GWAS effect (Fig. 3a). The impact of the regulation of a gene on a trait is quantified
                  by the slope βgene . That is, a null hypothesis of no dose-dependent effect is equivalent to
                  βgene = 0.
                     To reduce unnecessary noise in the analysis, we included only the most likely causal
                  e/sVariant within each credible set as determined by the e/sQTL fine-mapping (denoted
                  “fine-mapped variants” throughout the remainder of the paper; see Methods on QTL
                  fine-mapping).
                     First, we quantified dose-dependent effect of expression and splicing regulation on the
                  trait as the average mediating effect size, β̄. We calculated this average effect using the
                  Pearson correlation between the absolute values of the molecular and complex trait effect
                  sizes (cor(|γ |, |δ|)) across all fine-mapped variants (for any gene) for each trait-tissue
                  pair. As hypothesized, we found, consistently across all tissue-trait pairs, a positive cor-
                  relation between the GWAS and QTL effects, which was significantly larger than the
                  permuted null with matched local LD. The average correlations were 0.18 (s.e. = 0.004,
                  p < 1 × 10⁻³⁰ ) and 0.25 (s.e. = 0.006, p < 1 × 10⁻³⁰ ) for expression and splicing, respec-
                  tively with the distribution of the median correlation across tissues for each trait shown
                  in Fig. 3b. Averages and standard errors were calculated taking into account correlation
                  between tissues, and p values were calculated against permuted null with matched local
                  LD (Supplementary Text). The non-negative permuted correlation values indicate that
                  local LD contributed to inflate the estimated mediation effect. These results provide the
                  first line of evidence of the dose-response effect.
Barbeira et al. Genome Biology      (2021) 22:49                                                                                    Page 5 of 24

                    Fig. 3 Dose-dependent effects of QTLs on complex traits. Here, all analyses were performed with
                    fine-mapped variants (QTL with highest posterior inclusion probability). a Schematic representation of dose-
                    response model. b Correlation between QTL and GWAS effects, Cor(|δ̂|, |γ̂ |). Gray distribution represents
                    permuted null with matched local LD. Each data point corresponds to the median correlation for the trait
                                                                                            2 , median across tissues). Gray
                    across 49 tissues. c Average mediated effects from mediation model (σgene
                    distribution represents permuted null with matched local LD. e Mediated effects of secondary vs. primary
                    eQTLs of genes with colocalization probability (rcp) >0.10. in whole blood, genes for all 87 traits are shown

                    To test and account for mediation effect heterogeneity (different slope/dosage sensitiv-
                  ity for different genes), we modeled the gene-specific mediation effect, βg , as a random
                  variable following a normal distribution βg ∼ N (0, σgene  2 ). Under this random-effects

                  model, the null hypothesis can be stated as σgene = 0 (Supplementary Text; Fig. 3c). As
                                                                  2

                  shown in Fig. 3c, these effects were significantly larger than expected from the permuted
                  null (expression p = 1.8 × 10⁻⁹ ; splicing p = 2.5 × 10⁻⁷ ). These results indicate that
                  strong genetic effects on expression or splicing are more likely to have a strong associa-
                  tion to complex traits, adding strong support to a dose-dependent relationship between
                  gene regulation and downstream traits.
                    Importantly, by averaging across all genes, the estimates, from both the average and the
                  random-effects approach, of the mediating effect are robust to confounding due to LD, as
                  discussed in the Supplementary Text.
                    Another way to account for mediation effect heterogeneity is to make use of the allelic
                  series of independent eQTLs identified for over half of the eGenes [9]. We examined
                  whether the mediating effect (β = δ/γ ) inferred from the primary eQTL (βprim ) was
                  consistent with the one inferred from the secondary eQTL (βsec ). Among the indepen-
                  dent eQTLs for a given gene, we called primary the one with the larger effect size. We
                  considered only fine-mapped eQTLs given the low power to detect multiple independent
                  sQTLs. We confirmed this concordance, as reported by the GTEx consortium [9], demon-
                  strating that the correlation between the primary and secondary mediating effects is
                  larger than expected given the LD between them. To better visualize this concordance, we
                  plotted the estimated mediating effects of primary against the secondary eQTLs (whole
Barbeira et al. Genome Biology   (2021) 22:49                                                                      Page 6 of 24

                  blood shown here but other tissues look similar) in Fig. 3d and showed that they cluster in
                  the first and third quadrants. All gene-trait pairs with relatively high regional colocaliza-
                  tion probability (rcp > 0.10, see colocalization details below) are shown here to facilitate
                  visualization, but the clustering around the diagonal line was observed even without the
                  filtering. This provides a third confirmatory evidence for the widespread dose-dependent
                  effects of eQTLs on complex traits.
                     Note that genes with discordant effects within the allelic series would be harder to
                  detect and suggest more complex causal relationship or context specificity.

                  Causal gene prediction and prioritization
                  In addition to genome-wide analyses that shed light on the molecular architecture of
                  complex traits, QTL analysis of GWAS data can identify potential causal genes and
                  molecular changes in individual GWAS loci. Towards this end, we performed associ-
                  ation analysis with genetically predicted regulation and colocalization (Fig. 4a). After
                  evaluating the performance of coloc and enloc [16, 17], we chose enloc as our primary
                  approach, due to its use of hierarchical models to estimate colocalization priors [16]
                  and its ability to account for multiple causal variants. The coloc assumption of a single
                  causal variant drastically reduces performance especially in large QTL datasets such as
                  GTEx with widespread allelic heterogeneity. For a more extensive discussion on the ben-
                  efits of Bayesian colocalization methods and comparison of enloc to other colocalization
                  approaches including SMR-HEIDI, see [25]. We estimated the posterior regional colocal-
                  ization probability (rcp), using enloc, for 12,072,964 tissue-gene-GWAS locus-trait tuples
                  and 67,943,800 tissue-splicing event-GWAS locus-trait tuples. For the tally of colocal-
                  ized genes, we used rcp > 0.5 as a stringent cutoff as demonstrated below with the low
                  colocalization probabilities of height loci using two different datasets.
                    In total, we identified 3477 (15% of 23,963) unique genes colocalizing with GWAS hits
                  (rcp > 0.5) across all traits and tissues analyzed. Similarly, 3157 splicing events (1% out
                  of 310,042) colocalized with GWAS hits, corresponding to 1226 genes with at least one
                  colocalized splicing event (5% of 23,963).
                    Colocalization of e/sQTLs with GWAS variants provides important causal support for
                  molecular traits. However, we found their estimates to be overly conservative. To illus-
                  trate this point, we tested the colocalization of height with itself, using two large-scale
                  studies of individuals of European-ancestry individuals: GIANT [26] and UK Biobank.
                  We started by performing fine-mapping of both GWAS results using susier [27]. Notably,
                  only 416 (39%) of GIANT’s fine-mapped credible sets overlapped with the correspond-
                  ing UK Biobank credible sets. We estimated the colocalization probability as the sum of
                  the product of posterior inclusion probabilities of variants for each of the 1069 indepen-
                  dent credible sets in GIANT, which is similar to the approach used by eCAVIAR [15].
                  Two thirds of the GIANT credible sets (66.2%) had a colocalization probability below
                  0.01, and about half (48.9%) had a colocalization probability below 0.001. In other words,
                  two thirds of the loci found by GIANT would be considered not to be colocalized with
                  UK Biobank’s loci when using a seemingly very loose colocalization probability cutoff of
                  0.01. Given the larger sample size of the UK Biobank GWAS (n = 337,119 UKB GWAS
                  vs. n = 253,288 for GIANT), the low colocalization cannot be attributed to lack of power.
                  This result is likely due in part to the sensitivity to small LD differences between different
                  EUR populations that make up large GWAS meta-analysis cohorts such as GIANT. Our
Barbeira et al. Genome Biology (2021) 22:49 Page 7 of 24
Fig. 4 Identifying and validating predicted causal genes. a Schematic representation of association and
colocalization approaches. b Schematic representation of extrapolating the dose-response curve to the
Mendelian end of phenotypic variation spectrum [37]. c Proportion of GWAS-associated loci per trait that
contain colocalized and PrediXcan-associated signals for expression and splicing
analysis illustrates the fact that colocalization probability estimates are highly conserva-
tive and may miss many causal genes, and low colocalization probability should not be
interpreted as evidence of lack of a causal link between the molecular phenotype and the
GWAS trait. Notice that this limitation is not inherent to the colocalization method itself
but the limitation of currently available large-scale GWAS meta-analysis results.
A complementary approach to colocalization is to estimate the GWAS trait association
with genetically predicted gene expression or splicing [19]. The GTEx v8 data provides
an important expansion of these analyses, allowing generation of prediction models in 49
tissues with whole genome sequencing data to impute gene expression and splicing vari-
ation. We trained prediction models using a variety of approaches and selected the top
performing one based on precision, recall, and other metrics [28]. Briefly, the optimal
model uses fine-mapping probabilities for feature selection and exploits global patterns of
tissue sharing of regulation (Supplementary Text) to improve prediction. In-depth com-
parison of these fine-mapped models with Elastic Net-based and CTIMP [29] models is
described in [28]. The analysis presented here uses these improved models (fine-mapped-
mashr) instead of Elastic Net as reported in the main GTEx publication [9]. Multi-SNP
prediction models were generated for a total of 686,241 gene-tissue and 1,816,703 splic-
ing event-tissue pairs. The larger sample size and improved models led to an increase in
the number of expression models to a median across tissues of 14,062, from a median of
4776 GTEx v7 Elastic Net models (median increase at 191%, Additional file 1: Fig. S5).
Splicing models are available only for the v8 release.
Next, we computed the association between an imputed molecular phenotype (expres-
sion or splicing) and a trait to estimate the genic effect on the trait, using the summaryBarbeira et al. Genome Biology (2021) 22:49 Page 8 of 24
statistics-based PrediXcan [24]. Given the widespread tissue sharing of regulatory vari-
ation [8], we also computed MultiXcan scores to integrate patterns of associations from
multiple tissues and increase statistical power [10]. Out of the 22,518 genes tested with
PrediXcan, 6407 (28%) showed a significant association with at least one of the 87 traits
at Bonferroni-corrected p value threshold (p < 0.05/686, 241, where the denomina-
tor is the number of gene-tissue pairs tested; Additional file 1: Fig. S6). For splicing,
about 15% (20,364 of 138,890) of tested splicing events showed a significant association
(p < 0.05/1, 816, 703, where the denominator is the number of intron-tissue pairs tested).
Nearly all traits (94%; 82 out of 87) showed at least one significant gene-level PrediXcan
association in at least one tissue (Additional file 1: Figs. S7 and S8); the median number
of associated genes across traits was 974. This resource of PrediXcan associations can be
used to prioritize a list of putatively causal genes for follow-up studies.
To replicate the PrediXcan expression associations in an independent dataset, BioVU,
which is a large-scale biobank tied to Electronic Health Records [30, 31], we selected
seven traits with predicted high statistical power. Out of 947 gene-tissue-trait discoveries
tested, 458 unique gene-tissue-trait triplets (48%) showed replication in this independent
biobank (PrediXcan association p < 0.05; see Supplementary Text). Further confirm-
ing this statistical replication in BioVU, we used the PheWAS [32] catalog as the silver
standard and found an AUC curve of 0.62. [33].
Altogether, these results provide abundant links between gene regulation and GWAS
loci. To further quantify this, we split the genome into approximately LD-independent
blocks [34] and identified blocks with a significant GWAS variant for each trait (at Bon-
ferroni threshold adjusted for number of variants 0.05/8.8 × 106 ∼ 5.7 × 10⁻⁹ ); we refer
to any such region-trait pair by “GWAS locus.” We calculated the proportion of GWAS
loci that contain a significantly associated gene via PrediXcan or a colocalized gene via
enloc (rcp > 0.5). Briefly, the LD blocks are defined by analyzing empirical patterns of LD
observed in 1000 Genomes [35] and variants in different regions are unlikely to be corre-
lated, thus providing us with a data-driven criterion to distinguish independent genomic
signals.
Across the traits, 72% (3899/5385) of GWAS loci had a PrediXcan expression associ-
ation in the same LD block, of which 55% (2125/3899) had evidence of colocalization
with an eQTL; for splicing, 62% (3345/5385) had a PrediXcan association of which 34%
(1135/3345) colocalized with an sQTL (Additional file 1: Table S3). From the combined
list of eGenes and sGenes, 47% of loci have a gene with both enloc and PrediXcan sup-
port. The distribution of the proportion of associated and colocalized GWAS loci across
87 traits is summarized in Fig. 4c; for a typical complex trait, about 20% of GWAS loci
contained a colocalized, significantly associated gene while 11% contained a colocalized,
significantly associated splicing event. These results propose function for a large number
of GWAS loci, but most loci remain without candidate genes, highlighting the need to
expand the resolution of transcriptome studies.
A recent report estimates that the proportion of trait variance explained by the assayed
transcriptome is on average 11% [36]. Even though this number is not directly compara-
ble with the proportion of loci with support from PrediXcan and enloc, some discussion
is warranted. Differences may arise with our analysis from the fact that (1) GTEx v8
doubles the number of samples with both genotype and RNA-seq relative to v7, (2) we
include links based on splicing in addition to expression, (3) a variant may act throughBarbeira et al. Genome Biology (2021) 22:49 Page 9 of 24
both regulation of expression levels and other undetected mechanisms (pleiotropy), and
(4) attenuation bias may reduce the estimates given the error in eQTL effect sizes.
Of note, two members of the sterolin family, ABCG5 and ABCG8, showed highly
significant predicted causal associations using both PrediXcan and enloc for LDL-C
levels and self-reported high cholesterol levels. ABCG8 showed more significant associ-
ations in both datasets (chr2: 43838964–43878466; UKB self-reported high cholesterol:
−log10(pPrediXcan ) = 38.43, rcp = 0.985; GLGC LDL-C: −log10(pPrediXcan ) = 71.40,
rcp = 0.789), compared to ABCG5 (chr2: 43812472–43838865; −log10(pPrediXcan ) = 36.85,
rcp = 0.941; −log10(pPrediXcan ) = 80.80, rcp = 0.705). Mutations in either of the two ATP-
binding cassette (ABC) half-transporters, ABCG5 and ABCG8, lead to reduced secretion
of sterols into bile and, ultimately, obstruct cholesterol and other sterols exiting the
body [38]. In mice with disrupted Abcg5 and Abcg8 (G5G8-/-), a 2- to 3-fold increase
in the fractional absorption of dietary plan sterols and extremely low biliary cholesterol
levels was observed, indicating that disrupting these genes contributes greatly to plasma
cholesterol levels [39]. The overexpression of human ABCG5 and ABCG8 in transgenic
Ldlr-/- mice resulted in 30% reduction in hepatic cholesterol levels and 70% reduced
atherosclerotic legion in the aortic root and arch [40] after 6 months on a Western diet.
Several other lipid-associated loci were also consistently predicted as causal across
OMIM, the rare variant derived set, PrediXcan and enloc. Rare protein-truncating vari-
ants in APOB have been previously associated with reduced LDL-C and triglyceride levels
and reduced coronary heart disease risk [41]. Interestingly, APOB has been predicted as a
causal gene in four related traits, coronary artery disease, LDL-C levels, triglyceride lev-
els, and self-reported high cholesterol levels. Among the four traits, PrediXcan showed
the highest association to LDL-C levels (−log10(pPrediXcan ) = 130.89; rcp = 0.485) while
self-reported high cholesterol showed the strongest evidence using enloc at nearly maxi-
mum posterior probability (−log10(pPrediXcan ) = 93.66; rcp = 0.969). Although APOB has
been suggested as a better molecular indicator of predicted cardiac events in place of
LDL-C levels [42, 43], its translation has been surprisingly slow in clinical practice [44].
Here, we provide an additional support for the crucial role APOB may play in predicting
lipid traits.
Performance for identifying “ground truth” genes
To compare the ability of different approaches to identify the causal gene that mediates
the association between GWAS loci and the traits, we sought to curate sets of “ground
truth” genes using information that is independent of GWAS results (Additional file 1:
Fig. S9). We call these sets “silver standards” as a reminder of their imperfect nature. The
first silver standard was based on the OMIM (Online Mendelian Inheritance in Man)
database [45], and the second one was based on publicly available rare variant tests from
exome-wide association studies [46–48], resulting in 1592 OMIM gene-trait pairs and 101
rare variant-based gene-trait pairs (Additional file 3: Table S4, Additional file 4: Table S5).
The rationale behind the choice of the OMIM database is the comorbidity among
Mendelian and complex diseases suggesting that genes whose loss of function cause
Mendelian diseases also manifest in milder phenotypic variation when modified to a
lesser degree by regulatory variation [49, 50]. In other words, that the dose-response curve
at the regulatory range may be extrapolated to the rare, loss-of-function end (Fig. 4b).
The rationale behind the use of the rare variant association study results is the excess ofBarbeira et al. Genome Biology (2021) 22:49 Page 10 of 24
deleterious rare variants associated with complex traits in genes that are in the vicinity of
common variants associated with the same trait [46, 51, 52]. Note that rare variant associ-
ations are nearly independent of common variants due to the allele frequency difference
between them.
For the analysis, we partitioned the genome into approximately independent LD
blocks [34] and considered all the blocks where a silver standard gene was available
for the trait. Since only genes in the vicinity of an index gene can be discovered with
cis-regulatory information, we only considered the LD blocks with a GWAS signifi-
cant variant (Additional file 1: Fig. S10). This selection resulted in 228 OMIM gene-
trait pairs (28 distinct traits) and 80 rare variant-associated gene-trait pairs (5 distinct
traits) that are located within the same LD block as the GWAS locus for a matched
trait.
Both PrediXcan and enloc based on expression and splicing showed good sensitivity and
specificity for identifying the silver standard genes as demonstrated by the ROC curves
in Fig. 5a, b. These are well above the gray random guess lines indicating the predic-
tive ability of these methods to find causal genes (see comparison with permuted null in
Additional file 1: Fig. S11).
For applications such as target selection for drug development or follow-up experi-
ments, another relevant metric is the precision or, equivalently, positive predictive value
(PPV)—the probability that the gene-trait link is causal given that it is called significant
Fig. 5 Causal gene identification performance. ROC curves of enloc and PrediXcan statistics to identify the
“causal” genes (OMIM silver standard) using expression (a) and splicing (b) are shown. Precision recall curves
of enloc and PrediXcan to identify silver standard genes using expression (c) and splicing (d) (we show the
precision in the range 0 to 0.4 to improve visualization). The number of GWAS loci (LD block-trait pairs) where
the OMIM gene was ranked at the top by proximity, enloc, and PrediXcan using expression (e) and splicing (f).
In 131 loci out of 206, the OMIM gene was not ranked at the top by either proximity, significance, or
colocalization. In thirty one of the loci, the OMIM gene was ranked first by all three criteria. In nineteen loci,
the OMIM gene was closest gene (to the top GWAS variant) but not the top gene by PrediXcan significance
nor enloc’s colocalization probabilityBarbeira et al. Genome Biology (2021) 22:49 Page 11 of 24
or colocalized. Precision recall curves for expression- and splicing-based predictions are
shown in Fig. 5c, d. With more stringent threshold (towards the left in the recall axis),
higher precision is obtained.
For example, 8.7% of genes with PrediXcan significant genes (p < 0.05/49 × num-
ber of gene/trait pairs) were OMIM genes and 14.8% of genes with high colocalization
probability (rcp > 0.5) were also OMIM genes for matched traits.
Multiple factors contribute to the rather low precision. One of them is the widespread
molecular pleiotropy [9], i.e., multiple genes affected by the same trait-associated vari-
ants. Another factor reducing the overall causal gene detection performance is the
inherent bias of the OMIM gene list. Our current understanding of gene function
is biased towards protein-coding variants with very large effects, as reflected in the
list of OMIM genes. Genes associated to rare severe disease tend to be depleted of
regulatory variation [53, 54], which will decrease the performance of a QTL-based
method [54].
Among the 206 loci with at least one OMIM gene (a few loci contained multiple OMIM
genes), an OMIM gene was the closest to the top GWAS SNP in 31.6% of the loci, it was
the most colocalized in 24.8% of the loci, and it was the most significant in 20.4% of the
loci (Fig. 5e, f ).
To further investigate whether this predictive power could be improved by combin-
ing multiple criteria, we performed a joint logistic regression of OMIM gene status on
(1) the proximity of the top GWAS variant to the nearest gene (distance to the gene
body), (2) posterior probability of colocalization, and (3) PrediXcan association signifi-
cance between QTL and GWAS variants. To make the scale of the three features more
comparable, we used their respective ranking. When genes did not have an enloc or
PrediXcan score, they were assigned to the last position in the ranking. All three fea-
tures were significant predictors of OMIM gene status, with better ranked genes more
likely to be OMIM genes (proximity p = 2.0 × 10⁻² , enloc p = 6.1 × 10⁻³ , PrediXcan
p = 2.5 × 10⁻⁴ ), indicating that each method provides an additional source of causal evi-
dence even after conditioning on the others. Similar results were obtained using splicing
colocalization and association scores and the rare variant-based silver standard, as shown
in Additional file 1: Table S6. These results provide further empirical evidence that a com-
bination of colocalization and association methods will perform better than individual
ones. The significance of the proximity score even after accounting for significance and
colocalization indicates missing regulatory events, i.e., mechanisms that may be uncov-
ered by assaying other tissue or cell type contexts, larger samples, and other molecular
traits, underscoring the need to expand the size and breadth of QTL studies. Proximity
criterion also helps resolve cases when QTL data indicates multiple genes with similar
significance.
Predicted OMIM genes included well-known findings such as PCSK9 for LDLR, with
PCSK9 significant and colocalized for relevant GWAS traits (LDL-C levels, coronary
artery disease, and self-reported high cholesterol), and Interleukins and HLA subunits for
asthma, both significant and colocalized for related immunological traits. Significantly
associated and colocalized genes that predicted OMIM genes also included FLG (eczema),
TPO (hypothyroidism), and NOD2 (inflammatory bowel disease) (see Additional file 1:
Table S4 for complete list). Analysis with rare variant-based silver standard yielded similar
conclusions (Supplementary Text; Additional file 1: Fig. S12).Barbeira et al. Genome Biology (2021) 22:49 Page 12 of 24
Tissue enrichment of GWAS signals
The broad sharing of regulatory variation across tissues and the reduced significance
of tissue-specific eQTLs make causal tissue identification challenging. To address this
problem, we devised a novel approach to identify tissues of relevance for the etiology
of complex traits. We investigated the patterns of tissue specificity and tissue sharing of
PrediXcan association results across 49 tissues. For each trait-gene pair, the PrediXcan
z-score can be represented as a 49 × 1 vector with each entry being the gene-level z-
score in the corresponding tissue (if the prediction model of the gene is not available in
that tissue, we filled in zero). To explore the tissue specificity of the PrediXcan z-score
vector, we proceeded by assigning the z-score vector to a tissue-pattern category and
tested whether certain tissue-pattern categories were over-represented among colocal-
ized PrediXcan genes as compared to non-colocalized genes. We used the FLASH factors
identified from matrix factorization applied to the cis-eQTL effect size matrix, as PrediX-
can and cis-eQTL shared similar tissue-sharing pattern (Supplementary Text). To obtain a
set of detailed and biologically interpretable tissue-pattern categories from the 31 FLASH
factors, we manually merged them into 18 categories as shown in Additional file 1: Fig.
S13. For each trait, we projected the z-score vector of each gene to one of the 31 FLASH
factors (as described in Section 9 of Additional file 1) so that the gene was assigned to the
corresponding tissue-pattern category. We defined a “positive” set of genes as the ones
with PrediXcan p value that meets Bonferroni significance at α = 0.05 in at least one tis-
sue and enloc rcp > 0.01 in at least one tissue, which could be thought as a set of candidate
genes affecting the trait through expression level. We chose a rather low threshold used
for the rcp due to the stringent conservative nature of colocalization probabilities. We also
constructed a “negative” set of genes with enloc rcp = 0, which could be thought as a set
of genes whose expressions were unlikely to affect the trait. We proceeded to test whether
certain tissue-pattern categories were enriched in “positive” set as compared to “negative”
set. Since the main focus of this analysis was tissue-specific patterns, we excluded Factor1
(the cross-tissue factor) and Factor25 (likely to be a tissue-shared factor capturing tissues
with large sample size). Additionally, we excluded Factor7 (testis), as it was unlikely to
be the mediating tissue but might introduce false positives. We tested the enrichment of
each tissue-pattern category by Fisher’s exact test (“positive”/“negative” sets and in/not in
tissue-pattern category). Among 87 traits, 82 traits had enloc signal and the enrichment
of these was calculated accordingly.
Using the pattern of tissue classes of non-colocalized genes (rcp = 0) as the expected
null, we assessed whether significantly associated and colocalized genes (PrediXcan sig-
nificant and rcp > 0.01) were over-represented in certain tissue classes (Fig. 6). Consistent
with previous reports [11, 55], we identified several instances in which the most signifi-
cant tissue is supported by current biological knowledge. For example, blood cell count
traits were enriched in whole blood, neuroticism and fluid intelligence in brain/pituitary,
hypothyrodism in thyroid, coronary artery disease in artery, and cholesterol-related traits
in liver. Taken together, these results show the potential of leveraging regulatory variation
to help identify tissues of relevance for complex traits.
Discussion
We performed in-depth examination of the phenotypic consequences of the genetic reg-
ulation of the transcriptome and provide data-driven analytical approaches to benchmarkBarbeira et al. Genome Biology (2021) 22:49 Page 13 of 24
Fig. 6 Identifying trait-relevant tissues using tissue-specific enrichment. Enrichment of tissue-specific
association and colocalization compared to the pattern of tissue specificity of non-colocalized genes.
Over-representation of the tissue class for PrediXcan-significant and colocalized genes is indicated by dark
yellow while depletion is indicated by blue. Black dots label the tissue class-trait pairs passing the nominal p
value significance threshold of 0.05. Abbreviation: Table S2. Trait category colors: Fig. S4
methods that assign function to GWAS loci and best-practice guidelines for using the
GTEx resources to interpret GWAS results. We provide a systematic empirical demon-
stration of the widespread dose-dependent effect of expression and splicing on complex
traits, i.e., variants with larger impact at the molecular level have larger impact at the
trait level. Furthermore, we found that target genes in GWAS loci identified by enloc and
PrediXcan were predictive of OMIM genes for matched traits, implying that for a pro-
portion of the genes, the dose-response curve can be extrapolated to the rare and more
severe end of the genotype-trait spectrum. The observation that common regulatory
variants target genes also implicated by rare coding variants underscores the extent to
which these different types of genetic variants converge to mediate a spectrum of similar
pathophysiological effects and may provide a powerful approach to drug target discovery.
We implemented association and colocalization methods that leverage the observed
allelic heterogeneity of expression traits. After extensive comparison using two indepen-
dent sets of silver standard gene-trait pairs, we conclude that combining enloc, PrediXcan,
and proximity ranking outperforms the individual approaches. The significance of the
proximity ranking is a sign of the “missing regulability” emphasizing the need to expand
the resolution, sample size, and range of contexts of transcriptome studies as well as to
examine other molecular mechanisms.
We caution that the increased power offered by this release of the GTEx resources also
brings higher risk of false links due to LD contamination and that naive use of eQTL or
sQTL association p values to assign function to a GWAS locus can be misleading. Colo-
calization approaches can be used to weed out LD contamination, but given the lack of
LD references from source studies, they can also be overtly conservative. General pur-
pose reference LD from publicly available sources are not sufficient for fine-mapping and
colocalization approaches, which can be highly sensitive to LD misspecification when
only summary results are used [56]. The GWAS community has made great progress
in recognizing the need to share summary results, but to take full advantage of these
data, improved sharing of LD information from the source study as well as from large
sequencing reference datasets is also required.
Finally, we generated several resources that can open the door for addressing key ques-
tions in complex trait genomics. We present a catalog of gene-level associations, includingBarbeira et al. Genome Biology (2021) 22:49 Page 14 of 24
potential target genes for nearly half of the GWAS loci investigated here that provides a
rich basis for studies on the functional mechanisms of complex diseases and traits. We
provide a database of optimal gene expression imputation models that were built on the
fine-mapping probabilities for feature selection and that leverage the global patterns of
tissue sharing of regulation to improve the weights. These imputation models of expres-
sion and splicing, which to date has been challenging to study, provide a foundation
for transcriptome-wide association studies of the human phenome—the collection of all
human diseases and traits—to further accelerate discovery of trait-associated genes. Col-
lectively, these data thus represent a valuable resource, enabling novel biological insights
and facilitating follow-up studies of causal mechanisms.
Authors
∗ alphabetic order
Lead Analysts∗ Equal contribution Alvaro N Barbeira, Rodrigo Bonazzola, Eric R
Gamazon, Yanyu Liang, YoSon Park
Analysts∗ François Aguet, Lisa Bastarache, Ron Do, Gao Wang, Andrew R Hamel,
Farhad Hormozdiari, Zhuoxun Jiang, Daniel Jordan, Sarah Kim-Hellmuth, Boxiang Liu,
Milton D Pividori, Abhiram Rao, Marie Verbanck, Dan Zhou
GTEx GWAS Working Group∗ François Aguet, Kristin Ardlie, Alvaro N Barbeira,
Rodrigo Bonazzola, Christopher D Brown, Lin Chen, Eric R Gamazon, Kevin Gleason,
Andrew R Hamel, Farhad Hormozdiari, Hae Kyung Im, Sarah Kim-Hellmuth, Tuuli Lap-
palainen, Yanyu Liang, Boxiang Liu, Dan L Nicolae, Yoson Park, Milton D Pividori,
Abhiram Rao, John M. Rouhana, Ayellet V Segrè, Xiaoquan Wen
Senior Leadership∗ Kristin Ardlie, Christopher D. Brown, Hae Kyung Im, Tuuli Lap-
palainen, Mark McCarthy, Stephen Montgomery, Ayellet V Segrè, Matthew Stephens,
Xiaoquan Wen
Manuscript Writing Group∗ Eric R Gamazon, Hae Kyung Im, Tuuli Lappalainen, Yanyu
Liang, YoSon Park
Corresponding Author∗ Hae Kyung Im
GTEx Consortium
Laboratory and Data Analysis Coordinating Center (LDACC): François Aguet1 ,
Shankara Anand1 , Kristin G Ardlie1 , Stacey Gabriel1 , Gad Getz1,2 , Aaron Graubert1 ,
Kane Hadley1 , Robert E Handsaker3,4,5 , Katherine H Huang1 , Seva Kashin3,4,5 , Xiao Li1 ,
Daniel G MacArthur4,6 , Samuel R Meier1 , Jared L Nedzel1 , Duyen Y Nguyen1 , Ayellet V
Segrè1,7 , Ellen Todres1
Analysis Working Group (funded by GTEx project grants): François Aguet1 ,
Shankara Anand1 , Kristin G Ardlie1 , Brunilda Balliu8 , Alvaro N Barbeira9 , Alexis
Battle10,11 , Rodrigo Bonazzola9 , Andrew Brown12,13 , Christopher D Brown14 , StephaneBarbeira et al. Genome Biology (2021) 22:49 Page 15 of 24
E Castel15,16 , Don Conrad17,18 , Daniel J Cotter19 , Nancy Cox20 , Sayantan Das21 , Olivia
M de Goede19 , Emmanouil T Dermitzakis12,22,23 , Barbara E Engelhardt24,25 , Eleazar
Eskin26 , Tiffany Y Eulalio27 , Nicole M Ferraro27 , Elise Flynn15,16 , Laure Fresard28 ,
Eric R Gamazon29,30,31,20 , Diego Garrido-Martín32 , Nicole R Gay19 , Gad Getz1,2 ,
Aaron Graubert1 , Roderic Guigó32,33 , Kane Hadley1 , Andrew R Hamel7,1 , Robert E
Handsaker3,4,5 , Yuan He10 , Paul J Hoffman15 , Farhad Hormozdiari34,1 , Lei Hou35,1 ,
Katherine H Huang1 , Hae Kyung Im9 , Brian Jo24,25 , Silva Kasela15,16 , Seva Kashin3,4,5 ,
Manolis Kellis35,1 , Sarah Kim-Hellmuth15,16,36 , Alan Kwong21 , Tuuli Lappalainen15,16 ,
Xiao Li1 , Xin Li28 , Yanyu Liang9 , Daniel G MacArthur4,6 , Serghei Mangul26,37 , Samuel
R Meier1 , Pejman Mohammadi15,16,38,39 , Stephen B Montgomery28,19 , Manuel Muñoz-
Aguirre32,40 , Daniel C Nachun28 , Jared L Nedzel1 , Duyen Y Nguyen1 , Andrew B
Nobel41 , Meritxell Oliva9,42 , YoSon Park14,43 , Yongjin Park35,1 , Princy Parsana11 , Fer-
ran Reverter44 , John M Rouhana7,1 , Chiara Sabatti45 , Ashis Saha11 , Ayellet V Segrè1,7 ,
Andrew D Skol9,46 , Matthew Stephens47 , Barbara E Stranger9,48 , Benjamin J Strober10 ,
Nicole A Teran28 , Ellen Todres1 , Ana Viñuela49,12,22,23 , Gao Wang47 , Xiaoquan Wen21 ,
Fred Wright50 , Valentin Wucher32 , Yuxin Zou51
Analysis Working Group (not funded by GTEx project grants): Pedro G
Ferreira52,53,54 , Gen Li55 , Marta Melé56 , Esti Yeger-Lotem57,58
Leidos Biomedical - Project Management: Mary E Barcus59 , Debra Bradbury60 , Tanya
Krubit60 , Jeffrey A McLean60 , Liqun Qi60 , Karna Robinson60 , Nancy V Roche60 , Anna M
Smith60 , Leslie Sobin60 , David E Tabor60 , Anita Undale60
Biospecimen collection source sites: Jason Bridge61 , Lori E Brigham62 , Barbara A
Foster63 , Bryan M Gillard63 , Richard Hasz64 , Marcus Hunter65 , Christopher Johns66 ,
Mark Johnson67 , Ellen Karasik63 , Gene Kopen68 , William F Leinweber68 , Alisa
McDonald68 , Michael T Moser63 , Kevin Myer65 , Kimberley D Ramsey63 , Brian Roe65 ,
Saboor Shad68 , Jeffrey A Thomas68,67 , Gary Walters67 , Michael Washington67 , Joseph
Wheeler66
Biospecimen core resource: Scott D Jewell69 , Daniel C Rohrer69 , Dana R Valley69
Brain bank repository: David A Davis70 , Deborah C Mash70
Pathology Mary E Barcus59 , Philip A Branton71 , Leslie Sobin60
ELSI study: Laura K Barker72 , Heather M Gardiner72 , Maghboeba Mosavel73 , Laura A
Siminoff72
Genome Browser Data Integration & Visualization: Paul Flicek74 , Maximilian
Haeussler75 , Thomas Juettemann74 , W James Kentv75 , Christopher M Lee75 , Conner
C Powell75 , Kate R Rosenbloom75 , Magali Ruffier74 , Dan Sheppard74 , Kieron Taylor74 ,
Stephen J Trevanion74 , Daniel R Zerbino74Barbeira et al. Genome Biology (2021) 22:49 Page 16 of 24
eGTEx groups: Nathan S Abell19 , Joshua Akey76 , Lin Chen42 , Kathryn Demanelis42 ,
Jennifer A Doherty77 , Andrew P Feinberg78 , Kasper D Hansen79 , Peter F Hickey80 ,
Lei Hou35,1 , Farzana Jasmine42 , Lihua Jiang19 , Rajinder Kaul81,82 , Manolis Kellis35,1 ,
Muhammad G Kibriya42 , Jin Billy Li19 , Qin Li19 , Shin Lin83 , Sandra E Linder19 ,
Stephen B Montgomery28,19 , Meritxell Oliva9,42 , Yongjin Park35,1 , Brandon L Pierce42 ,
Lindsay F Rizzardi84 , Andrew D Skol9,46 , Kevin S Smith28 , Michael Snyder19 , John
Stamatoyannopoulos81,85 , Barbara E Stranger9,48 , Hua Tang19 , Meng Wang19
NIH program management: Philip A Branton71 , Latarsha J Carithers71,86 , Ping Guan71 ,
Susan E Koester87 , A. Roger Little88 , Helen M Moore71 , Concepcion R Nierras89 , Abhi K
Rao71 , Jimmie B Vaught71 , Simona Volpi90
Affiliations 1. The Broad Institute of MIT and Harvard, Cambridge, MA, USA
2. Cancer Center and Department of Pathology, Massachusetts General Hospital, Boston,
MA, USA
3. Department of Genetics, Harvard Medical School, Boston, MA, USA
4. Program in Medical and Population Genetics, The Broad Institute of Massachusetts
Institute of Technology and Harvard University, Cambridge, MA, USA
5. Stanley Center for Psychiatric Research, Broad Institute, Cambridge, MA, USA
6. Analytic and Translational Genetics Unit, Massachusetts General Hospital, Boston,
MA, USA
7. Ocular Genomics Institute, Massachusetts Eye and Ear, Harvard Medical School,
Boston, MA, USA
8. Department of Biomathematics, University of California, Los Angeles, Los Angeles,
CA, USA
9. Section of Genetic Medicine, Department of Medicine, The University of Chicago,
Chicago, IL, USA v 10. Department of Biomedical Engineering, Johns Hopkins Univer-
sity, Baltimore, MD, USA
11. Department of Computer Science, Johns Hopkins University, Baltimore, MD, USA
12. Department of Genetic Medicine and Development, University of Geneva Medical
School, Geneva, Switzerland
13. Population Health and Genomics, University of Dundee, Dundee, Scotland, UK
14. Department of Genetics, University of Pennsylvania, Perelman School of Medicine,
Philadelphia, PA, USA
15. New York Genome Center, New York, NY, USA
16. Department of Systems Biology, Columbia University, New York, NY, USA
17. Department of Genetics, Washington University School of Medicine, St. Louis, MO,
USA
18. Department of Pathology & Immunology, Washington University School of Medicine,
St. Louis, MO, USA
19. Department of Genetics, Stanford University, Stanford, CA, USA
20. Division of Genetic Medicine, Department of Medicine, Vanderbilt University Medi-
cal Center, Nashville, TN, USA
21. Department of Biostatistics, University of Michigan, Ann Arbor, MI, USA
22. Institute for Genetics and Genomics in Geneva (iGE3), University of Geneva, Geneva,
SwitzerlandBarbeira et al. Genome Biology (2021) 22:49 Page 17 of 24
23. Swiss Institute of Bioinformatics, Geneva, Switzerland
24. Department of Computer Science, Princeton University, Princeton, NJ, USA
25. Center for Statistics and Machine Learning, Princeton University, Princeton, NJ, USA
26. Department of Computer Science, University of California, Los Angeles, Los Angeles,
CA, USA
27. Program in Biomedical Informatics, Stanford University School of Medicine,
Stanford, CA, USA
28. Department of Pathology, Stanford University, Stanford, CA, USA
29. Data Science Institute, Vanderbilt University, Nashville, TN, USA
30. Clare Hall, University of Cambridge, Cambridge, UK
31. MRC Epidemiology Unit, University of Cambridge, Cambridge, UK
32. Centre for Genomic Regulation (CRG), The Barcelona Institute for Science and
Technology, Barcelona, Catalonia, Spain
33. Universitat Pompeu Fabra (UPF), Barcelona, Catalonia, Spain
34. Department of Epidemiology, Harvard T.H. Chan School of Public Health, Boston,
MA, USA
35. Computer Science and Artificial Intelligence Laboratory, Massachusetts Institute of
Technology, Cambridge, MA, USA
36. Statistical Genetics, Max Planck Institute of Psychiatry, Munich, Germany
37. Department of Clinical Pharmacy, School of Pharmacy, University of Southern
California, Los Angeles, CA, USA
38. Scripps Research Translational Institute, La Jolla, CA, USA
39. Department of Integrative Structural and Computational Biology, The Scripps
Research Institute, La Jolla, CA, USA
40. Department of Statistics and Operations Research, Universitat Politècnica de
Catalunya (UPC), Barcelona, Catalonia, Spain
41. Department of Statistics and Operations Research and Department of Biostatistics,
University of North Carolina, Chapel Hill, NC, USA
42. Department of Public Health Sciences, The University of Chicago, Chicago, IL, USA
43. Department of Systems Pharmacology and Translational Therapeutics, University of
Pennsylvania, Perelman School of Medicine, Philadelphia, PA, USA
44. Department of Genetics, Microbiology and Statistics, University of Barcelona,
Barcelona, Spain
45. Departments of Biomedical Data Science and Statistics, Stanford University,
Stanford, CA, USA
46. Department of Pathology and Laboratory Medicine, Ann & Robert H. Lurie Chil-
dren’s Hospital of Chicago, Chicago, IL, USA
47. Department of Human Genetics, University of Chicago, Chicago, IL, USA
48. Center for Genetic Medicine, Department of Pharmacology, Northwestern Univer-
sity, Feinberg School of Medicine, Chicago, IL, USA
49. Department of Twin Research and Genetic Epidemiology, King’s College London,
London, UK
50. Bioinformatics Research Center and Departments of Statistics and Biological Sci-
ences, North Carolina State University, Raleigh, NC, USA
51. Department of Statistics, University of Chicago, Chicago, IL, USA
52. Department of Computer Sciences, Faculty of Sciences, University of Porto, Porto,Barbeira et al. Genome Biology (2021) 22:49 Page 18 of 24
Portugal
53. Instituto de Investigação e Inovação em Sauúde, Universidade do Porto, Porto,
Portugal
54. Institute of Molecular Pathology and Immunology, University of Porto, Porto, Portu-
gal
55. Columbia University Mailman School of Public Health, New York, NY, USA
56. Life Sciences Department, Barcelona Supercomputing Center, Barcelona, Spain
57. Department of Clinical Biochemistry and Pharmacology, Ben-Gurion University of
the Negev, Beer-Sheva, Israel
58 National Institute for Biotechnology in the Negev, Beer-Sheva, Israel
59. Leidos Biomedical, Frederick, MD, USA
60. Leidos Biomedical, Rockville, MD, USA
61. UNYTS, Buffalo, NY, USA
62. Washington Regional Transplant Community, Annandale, VA, USA
63. Therapeutics, Roswell Park Comprehensive Cancer Center, Buffalo, NY, USA
64. Gift of Life Donor Program, Philadelphia, PA, USA
65. LifeGift, Houston, TX, USA
66. Center for Organ Recovery and Education, Pittsburgh, PA, USA
67. LifeNet Health, Virginia Beach, VA. USA v 68. National Disease Research Interchange,
Philadelphia, PA, USA v 69. Van Andel Research Institute, Grand Rapids, MI, USA
70. Department of Neurology, University of Miami Miller School of Medicine, Miami,
FL, USA
71. Biorepositories and Biospecimen Research Branch, Division of Cancer Treatment
and Diagnosis, National Cancer Institute, Bethesda, MD, USA
72. Temple University, Philadelphia, PA, USA
73. Virgina Commonwealth University, Richmond, VA, USA
74. European Molecular Biology Laboratory, European Bioinformatics Institute, Hinxton,
UK v 75. Genomics Institute, UC Santa Cruz, Santa Cruz, CA, USA
76. Carl Icahn Laboratory, Princeton University, Princeton, NJ, USA
77. Department of Population Health Sciences, The University of Utah, Salt Lake City,
UT, USA
78. Schools of Medicine, Engineering, and Public Health, Johns Hopkins University,
Baltimore, MD, USA
79. Department of Biostatistics, Bloomberg School of Public Health, Johns Hopkins
University, Baltimore, MD, USA
80. Department of Medical Biology, The Walter and Eliza Hall Institute of Medical
Research, Parkville, Victoria, Australia
81. Altius Institute for Biomedical Sciences, Seattle, WA, USA v 82. Division of Genetics,
University of Washington, Seattle, WA, USA
83. Department of Cardiology, University of Washington, Seattle, WA, USA
84. HudsonAlpha Institute for Biotechnology, Huntsville, AL, USA
85. Genome Sciences, University of Washington, Seattle, WA, USA
86. National Institute of Dental and Craniofacial Research, Bethesda, MD, USA
87. Division of Neuroscience and Basic Behavioral Science, National Institute of Mental
Health, National Institutes of Health, Bethesda, MD, USA
88. National Institute on Drug Abuse, Bethesda, MD, USAYou can also read