FY22 HALF-YEAR SALES AND RESULTS - 10 February 2022 - Pernod Ricard
←
→
Page content transcription
If your browser does not render page correctly, please read the page content below
FY22 HALF-YEAR
SALES AND RESULTS

                                         10 February 2022
All growth data specified in this presentation refers to organic growth (constant FX and Group structure), unless otherwise stated.

                                                Data may be subject to rounding.

                        This presentation can be downloaded from our website: www.pernod-ricard.com
3    Executive Summary

           8    Sales

           18   Profit

Contents   22   Cash Flow and Debt

           25   Conclusion and Outlook

           27   Appendices

                                         2
EXECUTIVE
SUMMARY

Executive
                  Summary
                                     Record breaking Sales and PRO1 at c. €6bn and c. €2bn

                    +25%             Very strong Net Sales performance with robust demand in most markets
            Reported PRO1            • Diversified growth across regions and categories with On-trade rebound and Off-trade resilience

                Organic PRO +22%     • All Must-Win markets growing strongly and market share gains in most markets

                                     • Strong price/mix +6% on Strategic Brands

                    +20%             Strong financial performance
                                     • Dynamic Sales with phasing of A&P spend resulting in strong operating margin expansion +147bps
            Reported Sales           • Very strong cash generation with Recurring Free Cash Flow at €1.4bn
               Organic Sales +17%
                                     Dynamic financial policy

                    +39%             • Active portfolio management, with acquisition of The Whisky Exchange and minority stake in Sovereign Brands

                                     • Resumption of share buy-back with €250m executed

                          €1.4bn     Business transformation velocity
          Recurring Free Cash Flow   • Driving 2030 Sustainability & Responsibility roadmap at pace

                                     • Agile resource allocations investing on strategic priorities to secure sustainable long-term value growth

                                     • Strong progress in digital transformation and solid e-commerce growth

H1 FY22 Sales & Results
10 February 2022                     1.   Profit from Recurring Operations                                                                           4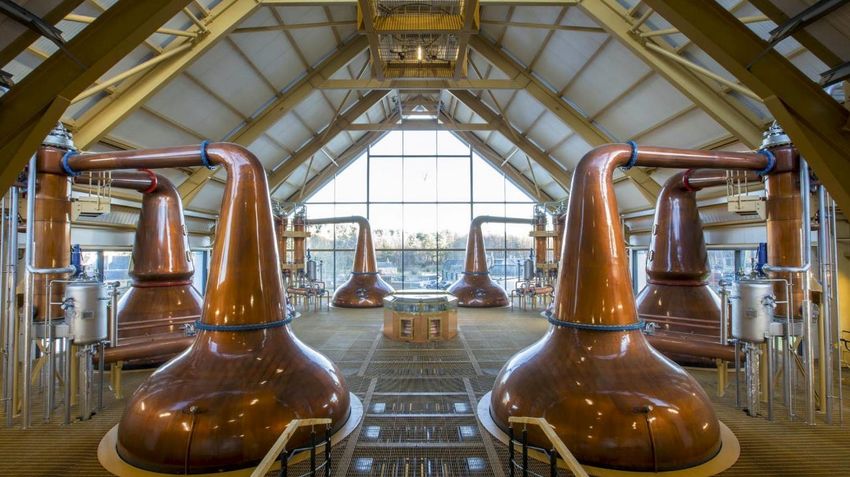
Executive
                  Summary     Excellent performance with Sales and PRO well above pre-Covid levels1

                                                                                  H1     reported ∆   organic ∆       vs.
                                                                                 FY22       vs. LY      vs. LY    pre-Covid1

                                        Sales                                    5,959     +20%       +16.8%        +13%

                                           Mature markets                        3,184                  +13%         +8%

                +32%                       Emerging markets

                                        Profit from Recurring Operations (PRO)
                                                                                 2,775

                                                                                 1,998     +25%
                                                                                                        +21%

                                                                                                      +22.1%
                                                                                                                    +21%

                                                                                                                    +20%

                Net PRO2                PRO / Sales                              33.5%                +147bps     +167bps

                                        Net PRO Group Share                      1,438     +32%                     +18%2

                 +39%
                                        Net Profit Group Share                   1,390     +44%                     +35%2

                                        Recurring Free Cash Flow                 1,383     +39%                    +121%2

 Recurring Free Cash                    Free Cash Flow                           1,320     +58%                    +132%2

        Flow²                           Net Debt to EBITDA                       2.4x      -1.0x                    -0.3x2

                              1.   vs. H1 FY20, at constant FX
                              2.   Reported growth
H1 FY22 Sales & Results
10 February 2022                                                                                                               5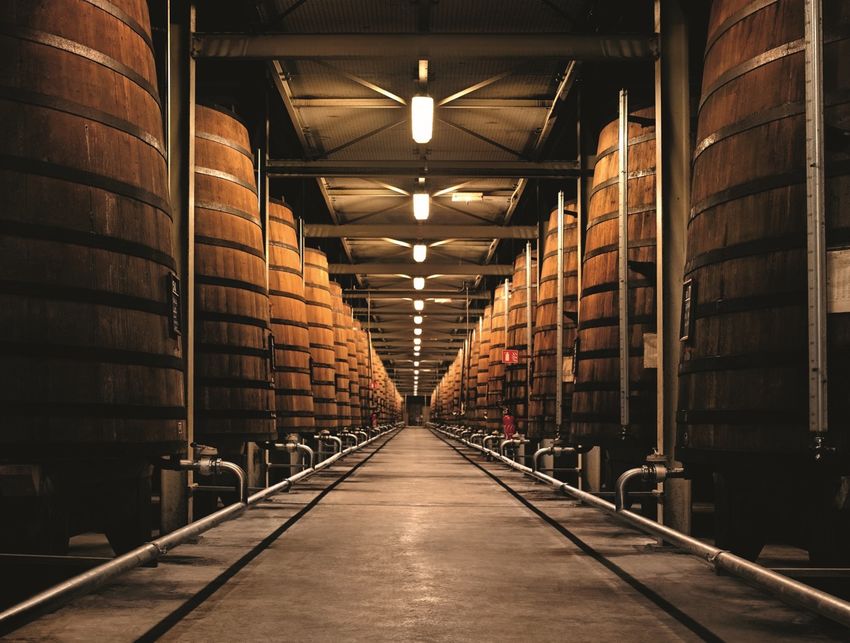
Executive Creating value for all our stakeholders
Summary
Leader in the beverage industry LEAD participant status
Valuing people
Strong employee engagement Taking Care of Each Other
They tell us they have: Developing together the future of
Clarity of the Pernod Ricard Strategy work to meet our employee needs:
Convivialité at the
•
• Right Culture to be successful • Creating contemporary work
• Teams Live the company Values environments that foster Agility
heart of our grain to Our employees recommend Pernod
Ricard as a
and Collaboration
Elevating employee support
glass strategy
•
Great Place to Work during COVID crisis
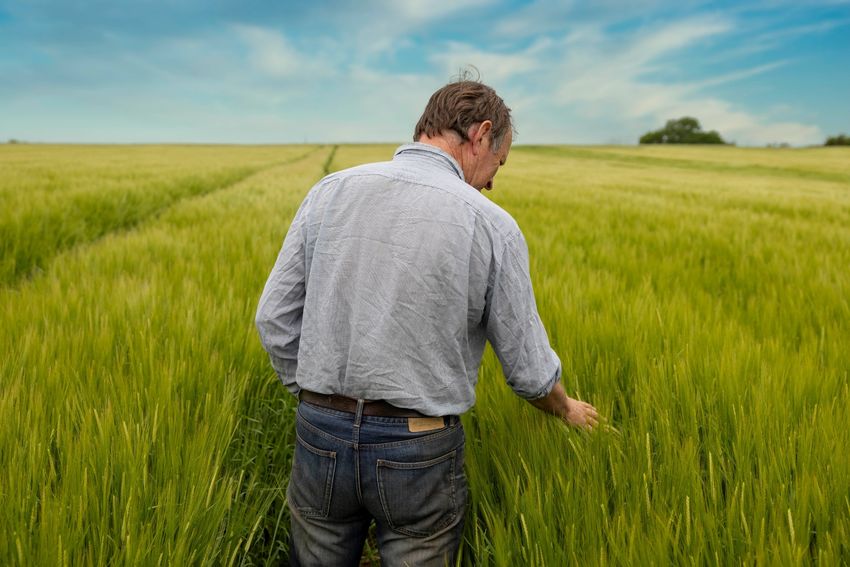
Nurturing Terroir Responsible Hosting
Collaborating with Engaging with consumers on
farmers & suppliers
responsible drinking
60 priority terroirs fully mapped
Global campaign launched in
10 pilots launched on regenerative over 34 countries, reaching
over 60m young adults
agriculture, in line with IUCN
Agriculture & Land Health
H1 FY22 Sales & Results 6
10 February 2022
Executive   Agility to gain exposure to fast growing categories and scale
                  Summary     acquired brands

                                                                          Leveraging unique partnerships with industry pioneers

                                                                        Acquisition of The Whisky Exchange, a leading online spirits retailer, reinforcing positioning in fast
                                                                        growing e-commerce

                                                                                Minority stake in U.S. based Sovereign Brands, innovative creators of Luc Belaire (a French
                                                                                sparkling wine), Bumbu (a range of rum products from the Caribbean) and other brands

                                                            Successful integration in Pernod Ricard ecosystem driving impressive growth1

                                                    20162                2017                2017            2019             2019            2019                  2019

                                                       x4                  x3                                         x2                                            x5
H1 FY22 Sales & Results                                                                                                                                                          7
10 February 2022              1.   Net Sales growth since acquisition           2.   Date of acquisition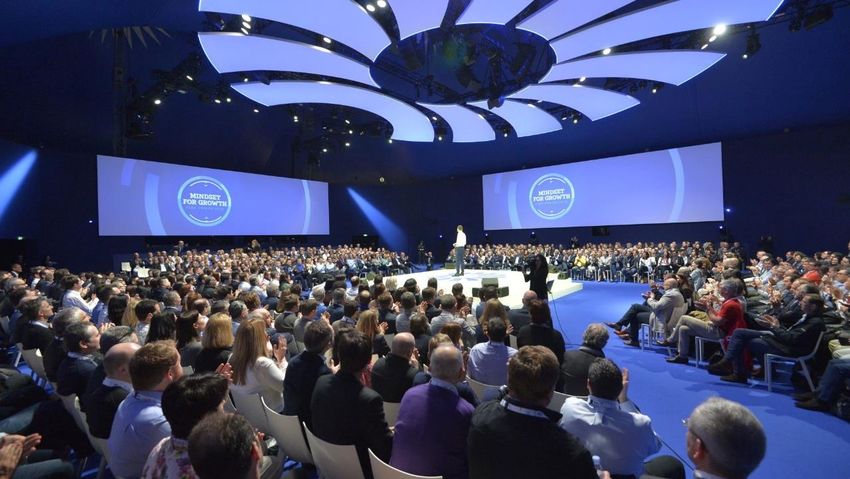
SALES
Sales      Transform and Accelerate strategy delivering double-digit growth
                     analysis   across all Regions
                                                                                    H1 FY20   H1 FY21    H1 FY22                                    vs. pre-covid¹

                 +20%                                                                           +2%
                                                                                                                   Very dynamic growth in the
                                                                                                                                                        +20%
                                              Americas                 27%                       +2%               region, notably USA, Brazil
             Reported Sales                                                                                        and Travel Retail
                                                                                                        +14%

                                                                                                 +3%
                                             Asia-RoW                                                              Excellent growth driven by            +9%
                                                                       42%          -6%
                                                                                                                   China, India and Turkey
                                                                                                        +16%

                 +17%
                                                                                              +3%                  Outstanding growth across the
                                                                                                                   region, with rebound in Spain,
                                                Europe                 30%          -5%                            France, Travel Retail and            +14%
                                                                                                                   continued dynamism in Eastern
                                                                                                        +21%       Europe
               Organic Sales
                                                                                               +3%

                                                 World                100%           -4%                           Double-digit growth across all       +13%
                                                                                                                   Regions
                                                                                                        +17%

                                                                   % of Net Sales
H1 FY22 Sales & Results                                                                                                                                              9
10 February 2022                1.   vs. H1 FY20, at constant FX
All Must-Win markets in very dynamic growth
USA: +9% / +17%1 China: +14% / +28%1
Strong On-trade recovery and resilient Off-trade driving good sell- Good growth, with good MAF2
out growth
Solid Martell sell-out despite localised On-trade disruptions in H1
Growth driven by Jameson, Martell and Super Premium whiskeys
Acceleration of The Glenlivet and strong growth of Royal Salute
(Redbreast and US whiskeys)
and Ballantine’s
Very strong rebound of Jameson in On-trade. Launch of Jameson
Continued strong development of Absolut
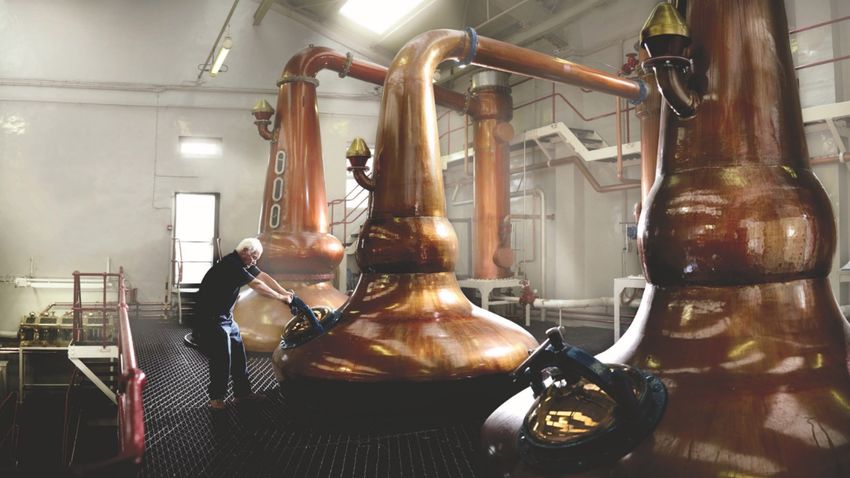
Orange in H2
Unveiling of THE CHUAN China’s first ever malt whisky distillery by
Excellent performance of Martell and new media campaign with an international player
Janelle Monae
Very solid contribution to growth of The Glenlivet
Continued development of Agave portfolio in particular Del
Maguey
Global Travel Retail: +38% / -41%1 India: +19% / +12%1
Very dynamic and broad-based growth across the portfolio, with
Steady recovery of international passenger traffic outside of Asia
strong underlying demand, favoured by low basis of comparison
and despite slight slowdown in December
Winning premiumisation strategy resulting in a strong mix within
Return to growth in all regions on very favorable comparison basis
Seagram’s Indian Whiskies and leadership maintained
but activity still below pre-covid levels
Strategic International Brands in very strong growth, notably
Resumption of strong activations, notably on Jameson and Chivas
Jameson, Chivas Regal and Ballantine’s
Regal
H1 FY22 Sales & Results 10
10 February 2022 1. vs. pre-covid (vs. H1 FY20, at constant FX) 2. Mid-Autumn FestivalExcellent growth momentum and market share gains in most
markets
Europe1: +21% Americas1 incl. USA: +14%
France: rebound driven by On-trade recovery with Champagne Canada: modest decline on a high comparison. Market share gain
momentum and strong growth of Ballantine’s and Absolut on Absolut, Jameson and The Glenlivet
Spain: +34%, On-trade rebound benefitting notably Gin & Whisky, Brazil: continued excellent growth of Strategic International Brands,
despite supply tensions. Good contribution to growth of notably Absolut, Chivas Regal and Ballantine’s, enhanced by price
innovations Beefeater Light and Ballantine’s Light increases
Mexico: growth driven by Chivas Regal and Absolut. Strong
UK: strong growth of Havana Club, Jameson and Absolut partly price/mix
offset by decline of wine portfolio
Germany: continued good growth on high comparison basis driven
by Jameson and Absolut
Russia: very strong growth supported by Jameson and Ballantine’s
and strong price/mix Asia-RoW1 incl. China and India: +16%
Poland: +22%, strong rebound of On-trade on the back of easing Japan: good recovery on low comparison basis, notably Perrier-
restrictions, continued momentum of whiskies Jouët growth in On-trade driving favorable mix.
Korea: continued strong development of Strategic International
Brand portfolio in Off-trade
Nigeria: outstanding growth driven by development of Jameson and
Martell
Turkey: strong double digit growth, with price increases and
continued very strong momentum behind whiskies and Absolut
H1 FY22 Sales & Results 1. Including Travel Retail 11
10 February 2022Sales Excellent growth of Strategic International Brands and Specialty portfolio
analysis driving strong price/mix
% of Sales H1 FY20 H1 FY21 H1 FY22 vs. pre-covid2
+20% Strategic
International Brands
65%
-6%
+4% Broad-based rebound with all brands
growing, notably Jameson, Martell,
Ballantine’s, Absolut and Chivas Regal,
all double-digit
+12%
Reported Sales +19%
+3%
Strategic Local 17% Driven by recovery of Seagram’s +9%
Brands -4% Indian whiskies
+14%
+17% Continued very dynamic
momentum of American whiskeys,
Specialty Brands 5% +22% Malfy, Monkey 47, Redbreast, Lillet +54%
and agave portfolio
+17%
+21%
+0%
Soft first half, due in particular to
Organic Sales Strategic Wines1 4% +3% New Zealand lower harvest
-2%
-6%
Price/mix +6% on Strategic Brands
1. Perimeter change: strategic Wines historical growth restated with addition of Mumm Sparkling and Church Road (adding 1pt of organic growth to H1 FY21 and 2pts to H1 FY22)
H1 FY22 Sales & Results 12
10 February 2022 2. vs. H1 FY20, at constant FXSales All brands benefiting from resilient Off-trade and recovery of On-trade in
analysis all markets
Martell: +11% / +8%1 Absolut: +23% / +9%1
Continued growth momentum in China driven mainly by Noblige Excellent international development, +35% outside of USA
and Cordon Bleu Broad-based rebound with growth notably driven by Brazil, France
Strong development outside of China, in line with and Spain
internationalisation strategy, notably very strong growth in Nigeria
Resilience in USA with On-trade recovery
and Russia
Good pricing notably in Eastern Europe and Brazil
Strong underlying Sell-out growth in USA (+23%/+30%)2 leveraging
continued consumer traction behind cognac category
Scotch: +23% / +10%1
Broad-based growth across the portfolio with good pricing
Chivas Regal: +23%, driven by 12yo, with rebound in Travel Retail,
continued excellent momentum in Turkey and very strong growth in
Jameson: +22% / +25%1 LATAM
Ballantine’s: +29%, driven by Ballantine’s Finest growth mainly in
Continued strong global expansion
Spain, Brazil, France, Russia and Asia. Good development of
Very strong performance in USA supported by continued On-trade innovations Ballantine’s 7yo Bourbon and Ballantine’s Light
recovery
The Glenlivet: +21%, continued very strong growth, on solid
Europe in very strong double-digit growth, driven by Russia, Ireland, comparison basis, notably driven by China, USA, India and Korea
UK and Germany Royal Salute: +41%, strong recovery from a low basis of comparison
Continued very fast development in Nigeria and India. Rebound in due to high exposure to Travel Retail. Good growth in domestic
South Africa markets driven by Taiwan market, Korea and China
H1 FY22 Sales & Results 1. vs. pre-covid (vs. H1 FY20, at constant FX)
13
10 February 2022 2. Nielsen 52wk data ended January 1st / Nabca 52wk data ended December. NB Nabca includes On-tradeSales
analysis
Strong media investments behind our brands
Chivas released the two limited-edition bottles Balmain x New media campaign in USA ’Soar Beyond
Chivas XV collection, developed in partnership with Olivier the Expected’, with Janelle Monae
Rousteing
Perrier-Jouët introduced ‘Fill Your World with Wonder’, a
Blender’s Pride Indian whisky announced Alia
new campaign rooted in its vineyards and savoir-faire
Bhatt as the new face of the brand with a
collaborating with a Dutch artist, Viviane Sassen
campaign film, ‘Made of Pride’
H1 FY22 Sales & Results 14
10 February 2022Sales
analysis
Innovation in strong growth +43%
Launch of Jameson Orange Continued development of Ballantine’s and The Glenlivet 15yo with broad
Beefeater Light in Spain based growth
Very strong development of Absolut Martell Blue Swift in very strong growth in Outstanding development of Chivas
Watermelon USA 13yo Sherry
H1 FY22 Sales & Results 15
10 February 2022Sales Specialty Brands maintaining very strong momentum across
analysis
regions
+21% Aberlour: +9%, developing strongly notably in China, Eastern Europe and France
Redbreast in strong double-digit growth driven by USA and Ireland
Specialty Brands
Lillet in high single-digit growth, on high comparison basis, mainly driven by Western Europe and USA
Continued dynamic development of Agave portfolio +20% benefiting from On-trade recovery. Launch of Avion
Cristalino in second half
Continued strong growth of American whiskey portfolio +31% with Jefferson’s, Rabbit Hole, TX and Smooth
Ambler
Monkey 47: +24%, with growth driven by Western Europe and USA
Malfy in strong double-digit growth
H1 FY22 Sales & Results 16
10 February 2022Sales
analysis
Other Strategic International Brands growing
Malibu: +9%, driven by Western Europe, USA and South Korea
Beefeater: +31%, rebounding strongly mainly due to On-trade recovery in Spain and outstanding growth in Brazil. Continued
double-digit growth of Beefeater Pink
Havana Club: +12%, mostly driven by Western Europe offsetting soft performance in Cuba due to sanitary context and monetary
reunification
Ricard: +2%, rebound on low basis of comparison
Mumm: +24%, driven by Champagne momentum in France and good rebound in On-trade in Italy, USA and Spain
Perrier-Jouët: +51%, broad-based rebound with growth notably driven by Japan and USA
Prestige portfolio: +18%, broad-based growth, in particular dynamism of Martell and Perrier-Jouët
H1 FY22 Sales & Results 17
10 February 2022PROFIT
18Dynamic Sales with A&P spend phasing resulting in strong
Profit
operating margin expansion +147bps
€ millions H1 FY21 H1 FY22 reported ∆ organic ∆
Sales 4,985 5,959 +20% +17%
+25%
Gross margin after logistics costs (GM) 3,021 3,640 +20% +18%
GM / Sales 60.6% 61.1% +39bps
Advertising & prom. expenditure (A&P) (706) (840) +19% +16%
Reported PRO A&P / Sales 14.2% 14.1% +13bps
Contribution after A&P expenditure (CAAP) 2,315 2,801 +21% +18%
CAAP / Sales 46.4% 47.0% +52bps
1
Structure (721) (803) +11% +9%
+22%
Structure / Sales 14.5% 13.5% +94bps
Profit from Recurring Operations (PRO) 1,595 1,998 +25% +22%
PRO / Sales 32.0% 33.5% +147bps
Organic PRO
• Gross margin expanding +39bps:
• Strong pricing across regions and operational excellence savings
• more than compensating inflation in Costs of Goods, notably from logistics and commodities
• Phasing in A&P with acceleration expected in H2 with ratio of c. 16% for FY22
• Structure costs reinforcement to support Sales growth and transformation momentum
• Positive FX impact on PRO +€39m with US Dollar and Chinese Yuan appreciation vs. Euro offsetting significant Turkish Lira depreciation
H1 FY22 Sales & Results 19
10 February 2022 1. Including OIE and RoyaltiesProfit Excellent PRO growth driving significant EPS increase
€ millions H1 FY21 H1 FY22 reported ∆
+33% Profit from Recurring Operations
Financial income (expense) from recurring operations
1,595
(151)
1,998
(102)
+25%
Income tax on recurring operations (337) (436)
EPS Minority interests and other (20) (21)
Group share of Net Profit from Recurring Operations 1,087 1,438 +32%
Number of shares used in diluted EPS calculation (‘000) 261,478 260,829
Diluted net earnings per share from recurring operations “EPS”
4.16 5.51 +33%
(€/share)
+32% • Very strong improvement in Financial result given recent refinancings (average cost of debt at 2.2%,
-91bps)
Net Profit from 1 • Income tax on recurring operations increasing along with profit growth
Recurring Operations
• Accretive impact of share buy-back
H1 FY22 Sales & Results 1. Group Share 20
10 February 2022Net Profit Excellent Group Share of Net Profit
+44%
€ millions H1 FY21 H1 FY22 Reported ∆
Profit from Recurring Operations 1,595 1,998 +25%
Non-recurring operating income and expenses (61) (2)
Operating profit 1,534 1,995 +30%
Group share of Financial income (expense) (254) (135)
Net Profit Corporate income tax (294) (452)
Non-controlling interests and other (20) (19)
Group share of Net profit 966 1,390 +44%
• Strong increase in Net Profit given:
• Increase in Profit from Recurring Operations
• Lower Non-recurring operating items on a high comparison basis (reorganisation costs in H1 FY21 link to Group
transformation)
• Lower financial expenses with historically low cost of debt
• Increase in Corporate Income Tax mainly driven by growth of Profit from Recurring Operations
H1 FY22 Sales & Results 21
10 February 2022CASH FLOW & DEBT
FCF
                              Very strong H1 cash generation
                  & Debt
                               € millions                                                                     H1 FY21        H1 FY22       Reported ∆         %∆
                               Profit from Recurring Operations                                                1,595           1,998          +403           +25%

           €1.4bn
                               Amortisation, depreciation, provision movements and other                         191            201            +10

                               Self-financing capacity from recurring operations                               1,786           2,198          +413           +23%
                               Decrease (increase) in strategic stocks                                           (14)           30             44

                  Recurring    Decrease (increase) in operating Working Capital Requirement (WCR)               (336)          (404)           (68)

                               Decrease (increase) in recurring WCR                                             (350)          (374)           (24)
                  Free Cash    Non-financial capital expenditure                                                (168)          (159)           +9

                    Flow       Recurring Operating Cashflow                                                    1,268           1,665          +398           +31%

                               Financial income (expense) and taxes                                             (273)          (282)           (9)

                               Free Cash Flow from recurring operations (Recurring FCF)                         995            1,383          +388           +39%

                               Non-recurring items                                                              (160)          (63)            +97

                               Free Cash Flow (FCF)                                                             835            1,320          +485           +58%

                               • Higher usage of maturing inventories given strong business recovery. Cash-out increase expected in H2 as we continue to invest in
                                 future growth
                               • Negative WCR variation given very dynamic business growth and usual seasonality
                               • Capex broadly stable vs. LY with significant Covid-induced disruptions. Acceleration expected in H2
                               • Financial expense and taxes increase with historically low average cost of debt as a result of the successful bond refinancings, more
                                 than offset by adverse phasing in tax cash-out
                               • Reduced non-recurring items against a high base LY

H1 FY22 Sales & Results                                                                                                                                                  23
10 February 2022
FCF Dynamic financial policy supported by consistent strong cash
& Debt
delivery
Net Debt / EBITDA
2.4x1
ratio 2.6x 2.4x¹
€ millions
+471
7,923
+74
Net Debt / EBITDA
7,452 +168
+820
ratio at 31 Dec 2021
(1 320)
+729
30 June 2021 FCF M&A, Share Dividends Others (mainly FX 31 Dec 2021
buy-back and lease Translation
other financial liabilities)
operations
• Very strong balance sheet with excellent cash performance allowing:
• M&A cash-out on active portfolio management (The Whisky Exchange, Sovereign Brands)
• c. €250m of resumed share buy-back programme executed in H1
• €820m dividend payment (+€120m vs. LY back to historical high), aligned with c. 50% pay out policy
H1 FY22 Sales & Results 1. Based on average EUR/USD rate: 1.18 in calendar year 2021 24
10 February 2022CONCLUSION & OUTLOOK
Continued execution of Transform & Accelerate strategy delivering excellent
                          H1 Sales and PRO1 growth
      Conclusion &
                          In an ongoing volatile environment with potential disruptions related to
                          Covid-19, Pernod Ricard expects for FY22:
        Outlook           •     Continued On-trade rebound, Off-trade resilience and Travel Retail
                                gradual recovery driving strong diversified Sales momentum across
                                regions

                          •     Dynamic topline driving operating margin expansion albeit moderating
                                vs. H1, with increased investments to fuel growth momentum

                          •     Continued implementation of Transform & Accelerate, including digital
                                transformation to develop Pernod Ricard into a Conviviality Platform

                          •     Strong cash generation while upweighting investments behind key
                                Capex and Strategic inventories
                          •     Acceleration of share buy-back programme with additional c. €250m
                                (total of c. €750m for FY22)

H1 FY22 Sales & Results                                                                                 26
10 February 2022          1.   Profit from Recurring Operations
Appendices H1 FY22 Sales & Results 27 10 February 2022
Appendices
                                                                                   Organic growth
                                                                                   •   Organic growth is calculated after excluding the impacts of exchange rate
                                                                                       movements and acquisitions and disposals.
                     Definitions and reconciliation of                             •   Exchange rates impact is calculated by translating the current year results at
                     non-IFRS measures to IFRS measures                                the prior year’s exchange rates.
                                                                                   •   For acquisitions in the current year, the post-acquisition results are excluded
                                                                                       from the organic movement calculations. For acquisitions in the prior year,
                                                                                       post-acquisition results are included in the prior year but are included in the
                                                                                       organic movement calculation from the anniversary of the acquisition date in
                                                                                       the current year.
                  Pernod Ricard’s management process is based on the following     •   Where a business, brand, brand distribution right or agency agreement was
                  non-IFRS measures which are chosen for planning and reporting.       disposed of, or terminated, in the prior year, the Group, in the organic
                  The Group’s management believes these measures provide               movement calculations, excludes the results for that business from the prior
                                                                                       year. For disposals or terminations in the current year, the Group excludes the
                  valuable additional information for users of the financial           results for that business from the prior year from the date of the disposal or
                  statements in understanding the Group’s performance. These           termination.
                  non-IFRS measures should be considered as complementary to
                                                                                   •   This measure enables to focus on the performance of the business which is
                  the comparable IFRS measures and reported movements                  common to both years and which represents those measures that local
                  therein.                                                             managers are most directly able to influence.
                                                                                   Profit from recurring operations
                                                                                   •   Profit from recurring operations corresponds to the operating profit excluding
                                                                                       other non-current operating income and expenses.

H1 FY22 Sales & Results                                                                                                                                                  28
10 February 2022
FCF
& Debt
Upcoming communications
Date1 Event
28 April 2022 Q3 FY22 Sales conference call
10 May 2022 North America conference call
8 June 2022 Capital Market Day in Paris
24 June 2022 Asia conference call
1. Dates are indicative and liable to change
H1 FY22 Sales & Results 29
10 February 2022Emerging Markets
Asia-Rest of World Americas Europe
Algeria Malaysia Argentina Albania
Angola Mongolia Bolivia Armenia
Cambodia Morocco Brazil Azerbaijan
Cameroon Mozambique Caribbean Belarus
China Namibia Chile Bosnia
Congo Nigeria Colombia Bulgaria
Egypt Persian Gulf Costa Rica Croatia
Ethiopia Philippines Cuba Georgia
Gabon Senegal Dominican Republic Hungary
Ghana South Africa Ecuador Kazakhstan
India Sri Lanka Guatemala Kosovo
Indonesia Syria Honduras Latvia
Iraq Tanzania Mexico Lithuania
Ivory Coast Thailand Panama Macedonia
Jordan Tunisia Paraguay Moldova
Kenya Turkey Peru Montenegro
Laos Uganda Puerto Rico Poland
Lebanon Vietnam Uruguay Romania
Madagascar Zambia Venezuela Russia
Serbia
Ukraine
H1 FY22 Sales & Results 30
10 February 2022Strategic International Brands’ organic Sales
growth
Volumes
Organic Net Sales
H1 FY22
growth of which Volume of which Price/mix
(in 9Lcs millions) H1 FY22
Absolut 6.9 +23% +22% +1%
Chivas Regal 2.6 +23% +25% (2)%
Ballantine's 5.3 +29% +25% +4%
Ricard 2.4 +2% +5% (3)%
Jameson 5.8 +22% +22% +0%
Havana Club 2.4 +12% (1)% +12%
Malibu 2.6 +9% +5% +4%
Beefeater 2.0 +31% +27% +4%
Martell 1.7 +11% +14% (3)%
The Glenlivet 0.9 +21% +16% +5%
Royal Salute 0.1 +41% +40% +1%
Mumm 0.6 +24% +18% +6%
Perrier-Jouët 0.2 +51% +38% +13%
Strategic International Brands 33.3 +19% +18% +2%
H1 FY22 Sales & Results 31
10 February 2022Sales Analysis by Period and Region
Net Sales
H1 FY21 H1 FY22 Change Organic Growth Group Structure Forex impact
(€ millions)
Europe 1,456 29.2% 1,797 30.2% +341 +23% +300 +21% +19 +1% +22 +2%
Americas 1,402 28.1% 1,638 27.5% +235 +17% +196 +14% +17 +1% +22 +2%
Asia / Rest of World 2,127 42.7% 2,524 42.4% +397 +19% +338 +16% +0 +0% +60 +3%
World 4,985 100.0% 5,959 100.0% +974 +20% +834 +17% +36 +1% +104 +2%
Net Sales
Q2 FY21 Q2 FY22 Change Organic Growth Group Structure Forex impact
(€ millions)
Europe 811 29.5% 1,005 31.0% +193 +24% +156 +19% +19 +2% +19 +2%
Americas 729 26.5% 864 26.7% +135 +19% +107 +15% +0 +0% +28 +4%
Asia / Rest of World 1,209 44.0% 1,373 42.3% +163 +13% +122 +10% +0 +0% +41 +3%
World 2,750 100.0% 3,242 100.0% +492 +18% +386 +14% +19 +1% +87 +3%
Net Sales
Q1 FY21 Q1 FY22 Change Organic Growth Group Structure Forex impact
(€ millions)
Europe 645 28.8% 793 29.2% +148 +23% +144 +22% +0 +0% +4 +1%
Americas 673 30.1% 773 28.5% +100 +15% +89 +13% +17 +3% (6) (1)%
Asia / Rest of World 918 41.0% 1,152 42.4% +234 +26% +215 +23% +0 +0% +19 +2%
World 2,236 100.0% 2,718 100.0% +482 +22% +448 +20% +17 +1% +17 +1%
Note: Bulk Spirits are allocated by Region according to the Regions’ weight in the Group
H1 FY22 Sales & Results 32
10 February 2022Summary Consolidated Income Statement
(€ millions) H1 FY21 H1 FY22 Change
Net sales 4,985 5,959 20%
Gross Margin after logistics costs 3,021 3,640 20%
Adverti s i ng a nd promotion expens es (706) (840) 19%
Contribution after A&P expenditure 2,315 2,801 21%
Structure cos ts (721) (803) 11%
Profit from recurring operations 1,595 1,998 25%
Fi na nci a l i ncome/(expens e) from recurri ng opera tions (151) (102) -32%
Corpora te i ncome tax on i tems from recurri ng opera tions (337) (436) 29%
Net profi t from di s continued opera tions , non-control l i ng i nteres ts
(20) (21) 8%
a nd s ha re of net i ncome from a s s oci a tes
Group share of net profit from recurring operations 1,087 1,438 32%
Other opera ting i ncome & expens es (61) (2) NA
Fi na nci a l i ncome/(expens e) from non-recurri ng opera tions (103) (32) NA
Corpora te i ncome tax on i tems from non recurri ng opera tions 44 (16) NA
Non control l i ng i nteres ts (non-recurri ng) 3
Group share of net profit 966 1,390 44%
Non-control l i ng i nteres ts 18 21 17%
Net profit 984 1,411 43%
H1 FY22 Sales & Results 33
10 February 2022Profit from Recurring Operations by Region (1/2)
World
(€ millions) H1 FY21 H1 FY22 Change Organic Growth Group Structure Forex impact
Net sales 4,985 100.0% 5,959 100.0% +974 +20% +834 +17% +36 +1% +104 +2%
Gross margin 3,021 60.6% 3,640 61.1% +619 +20% +532 +18% +17 +1% +69 +2%
Advertising & promotional spend (706) 14.2% (840) 14.1% (134) +19% (111) +16% (4) +1% (19) +3%
Contribution after A&P spend 2,315 46.4% 2,801 47.0% +485 +21% +422 +18% +13 +1% +51 +2%
Profit from recurring operations 1,595 32.0% 1,998 33.5% +403 +25% +355 +22% +8 +1% +39 +2%
Americas
(€ millions) H1 FY21 H1 FY22 Change Organic Growth Group Structure Forex impact
Net sales 1,402 100.0% 1,638 100.0% +235 +17% +196 +14% +17 +1% +22 +2%
Gross margin 909 64.8% 1,070 65.3% +161 +18% +123 +14% +11 +1% +27 +3%
Advertising & promotional spend (250) 17.8% (264) 16.1% (14) +6% (7) +3% (3) +1% (5) +2%
Contribution after A&P spend 659 47.0% 806 49.2% +147 +22% +117 +18% +8 +1% +23 +3%
Profit from recurring operations 459 32.7% 595 36.3% +136 +30% +110 +24% +6 +1% +20 +4%
Note: Bulk Spirits are allocated by Region according to the Regions’ weight in the Group
H1 FY22 Sales & Results 34
10 February 2022Profit from Recurring Operations by Region (2/2)
Asia / Rest of the World
(€ millions) H1 FY21 H1 FY22 Change Organic Growth Group Structure Forex impact
Net sales 2,127 100.0% 2,524 100.0% +397 +19% +338 +16% +0 +0% +60 +3%
Gross margin 1,232 57.9% 1,458 57.8% +226 +18% +198 +16% +0 +0% +29 +2%
Advertising & promotional spend (291) 13.7% (361) 14.3% (70) +24% (58) +20% (0) +0% (12) +4%
Contribution after A&P spend 940 44.2% 1,097 43.5% +157 +17% +140 +15% (0) (0)% +17 +2%
Profit from recurring operations 674 31.7% 814 32.3% +140 +21% +128 +19% +0 +0% +12 +2%
Europe
(€ millions) H1 FY21 H1 FY22 Change Organic Growth Group Structure Forex impact
Net sales 1,456 100.0% 1,797 100.0% +341 +23% +300 +21% +19 +1% +22 +2%
Gross margin 881 60.5% 1,112 61.9% +231 +26% +211 +24% +7 +1% +14 +2%
Advertising & promotional spend (164) 11.3% (214) 11.9% (50) +30% (46) +28% (1) +1% (2) +1%
Contribution after A&P spend 717 49.2% 898 50.0% +181 +25% +165 +23% +5 +1% +11 +2%
Profit from recurring operations 461 31.7% 589 32.7% +127 +28% +117 +25% +3 +1% +8 +2%
Note: Bulk Spirits are allocated by Region according to the Regions’ weight in the Group
H1 FY22 Sales & Results 35
10 February 2022Foreign Exchange Impact
Forex impact H1 FY22
Average rates evolution On Profit from
(€ millions)
On Net Sales Recurring
H1 FY21 H1 FY22 % Operations
US dollar USD 1.18 1.16 (1.7)% +23 +17
Chinese yuan CNY 7.99 7.47 (6.6)% +56 +33
Indian rupee INR 87.48 86.52 (1.1)% +7 +2
Russian rouble RUB 88.61 84.86 (4.2)% +8 +6
Argentinian peso ARS 90.61 114.76 +26.7% (10) (4)
Turkish Lira TRL 8.94 11.42 +27.8% (19) (19)
Pound sterling GBP 0.90 0.85 (5.8)% +14 (15)
Other +25 +19
Total +104 +39
H1 FY22 Sales & Results 36
10 February 2022Sensitivity of profit and debt to EUR/USD
exchange rate
Estimated impact of a 1% appreciation of the USD
Impact on the income statement (1) (€ millions)
Profit from recurring operations +15
Financial expenses (1)
Pre-tax profit from recurring operations +14
Impact on the balance sheet (€ millions)
Increase/(decrease) in net debt +37
(1) Full-year effect
H1 FY22 Sales & Results 37
10 February 2022Balance Sheet: Assets
Assets
30/06/2021 31/12/2021
(€ millions)
(Net book value)
Non-current assets
Intangi bl e a s s ets a nd goodwi l l 16,230 16,857
Ta ngi bl e a s s ets a nd other a s s ets 3,963 4,146
Deferred tax a s s ets 1,623 1,687
Total non-current assets 21,816 22,690
Current assets
Inventori es 6,555 6,694
aged work-in-progress 5,373 5,446
non-aged work-in-progress 84 82
other inventories 1,098 1,166
Recei va bl es (*) 1,126 2,233
Trade receivables 1,080 2,165
Other trade receivables 46 67
Other current a s s ets 413 353
Other operating current assets 408 345
Tangible/intangible current assets 6 8
Ta x recei va bl e 141 77
Ca s h a nd ca s h equi va l ents a nd current deri va tives 2,086 2,023
Total current assets 10,321 11,380
As s ets hel d for s a l e 11 0
Total assets 32,147 34,070
-
(*) a fter di s pos a l s of recei va bl es of: 592 919
H1 FY22 Sales & Results 38
10 February 2022Balance Sheet: Liabilities and Shareholder’s Equity
Liabilities and shareholders’ equity
30/06/2021 31/12/2021
(€ millions)
Group Shareholders’ equity 14,829 15,757
Non-control l i ng i nteres ts 246 265
of which profit attributable to non-controlling interests 13 21
Total Shareholders’ equity 15,075 16,022
Non-current provi s i ons a nd deferred tax l i a bi l i ties 3,555 3,650
Bonds non-current 8,787 8,236
Lea s e l i a bi l i ties - non current 405 402
Non-current fi na nci a l l i a bi l i ties a nd deri va ti ve i ns truments 108 97
Total non-current liabilities 12,854 12,385
Current provi s i ons 163 151
Opera ti ng pa ya bl es 2,337 2,976
Other opera ting pa ya bl es 1,134 886
of which other operating payables 724 828
of which tangible/intangible current payables 410 58
Ta x pa ya bl e 282 423
Bonds - current 70 785
Lea s e l i a bi l i ties - current 103 105
Current fi na nci a l l i a bi l i ties a nd deri va tives 128 337
Total current liabilities 4,218 5,663
Li a bi l i ties hel d for s a l e 0 0
Total liabilities and shareholders' equity 32,147 34,070
H1 FY22 Sales & Results 39
10 February 2022Analysis of Working Capital Requirement
June December June December H1 FY21 WC H1 FY22 WC
(€ millions)
2020 2020 2021 2021 change* change*
Aged work i n progres s 5,084 5,135 5,373 5,446 67 21
Adva nces to s uppl i ers for wi ne a nd a gei ng s pi ri ts 19 10 9 14 (8) 5
Pa ya bl es on wi ne a nd a gei ng s pi ri ts (108) (161) (93) (147) (47) (53)
Net aged work in progress 4,995 4,984 5,289 5,313 11 (28)
Tra de recei va bl es before fa ctori ng/s ecuri tiza tion 1,375 2,508 1,672 3,085 1,173 1,360
Adva nces from cus tomers (38) (18) (21) (31) 19 (8)
Other recei va bl es 343 354 445 399 27 (40)
Other i nventori es 1,006 932 1,098 1,166 (62) 10
Non-a ged work i n progres s 76 72 84 82 (2) (3)
Tra de pa ya bl es a nd other (2,364) (2,870) (2,946) (3,626) (554) (593)
Gross operating working capital 398 978 331 1,075 601 725
Fa ctori ng/Securi tiza tion i mpa ct (513) (750) (592) (919) (246) (315)
Net Operating Working Capital (115) 227 (261) 155 355 410
Net Working Capital 4,879 5,211 5,028 5,468 366 382
* a t a vera ge ra tes Of whi ch recurri ng va ri a tion 350 374
Of whi ch non recurri ng va ri a tion 16 8
H1 FY22 Sales & Results 40
10 February 2022Net Debt
30/06/2021 31/12/2021
(€ millions)
Current Non-current Total Current Non-current Total
Bonds 70 8,787 8,857 785 8,236 9,021
Syndicated loan - - - - - -
Commercial paper 7 - 7 170 - 170
Other loans and long-term debts 115 108 222 163 94 258
Other financial liabilities 122 108 229 333 94 428
Gross Financial debt 192 8,894 9,086 1,118 8,330 9,448
Fair value hedge derivatives – assets - (22) (22) (10) (4) (14)
Fair value hedge derivatives – liabilities - - - - - -
Fair value hedge derivatives - (22) (22) (10) (4) (14)
Net investment hedge derivatives – assets - (43) (43) - (22) (22)
Net investment hedge derivatives – liabilities - - - - - -
Net investment hedge derivatives - (43) (43) - (22) (22)
FINANCIAL DEBT AFTER HEDGING 192 8,830 9,022 1,108 8,305 9,413
Cash and cash equivalents (2,078) - (2,078) (1,997) - (1,997)
NET FINANCIAL DEBT EXCLUDING LEASE DEBT (1,886) 8,830 6,944 (889) 8,305 7,416
Lease Debt 103 405 508 105 402 507
NET FINANCIAL DEBT (1,783) 9,235 7,452 (784) 8,707 7,923
H1 FY22 Sales & Results 41
10 February 2022Change in Net Debt
(€ millions) 31/12/2020 31/12/2021
Opera ti ng profi t 1,534 1,995
Depreci a tion a nd a morti s a tion 179 189
Net cha nge i n i mpa i rment of goodwi l l , PPE a nd i ntangi bl e a s s ets 6
Net cha nge i n provi s i ons (31) (22)
Retrea tment of contri butions to pens i on pl a ns a cqui red from Al l i ed Domecq a nd others
Cha nges i n fa i r va l ue on commerci a l deri va tives a nd bi ol ogi ca l a s s ets (5) (3)
Net (ga i n)/l os s on di s pos a l of a s s ets 2 (3)
Sha re-ba s ed pa yments 15 17
Self-financing capacity before interest and tax 1,699 2,173
Decrea s e / (i ncrea s e) i n worki ng ca pi tal requi rements (364) (382)
Net i nteres t a nd tax pa yments (347) (313)
Net a cqui s i ti ons of non fi na nci a l a s s ets a nd others (153) (157)
Free Cash Flow 835 1,320
of which recurring Free Cash Flow 995 1,383
Net a cqui tions of fi na nci a l a s s ets a nd a ctivi ties , contri butions to pens i on pl a ns a cqui red from Al l i ed Domecq a nd others (33) (464)
Di vi dends pa i d (699) (820)
(Acqui s i tion) / Di s pos a l of trea s ury s ha res a nd others (25) (292)
Decrease / (increase) in net debt (before currency translation adjustments) 78 (256)
Forei gn currency tra ns l a tion a djus tment 406 (168)
Non ca s h i mpa ct on l ea s e l i a bi l i ti es (40) (47)
Decrease / (increase) in net debt (after currency translation adjustments and IFRS 16 non cash impacts) 443 (471)
Ini tia l net debt (8,424) (7,452)
Fi na l net debt (7,980) (7,923)
H1 FY22 Sales & Results 42
10 February 20222.0
Debt Maturity at 31 December 2021
€ bn -
1.5
-
1.0
1.7
-
1.5 -
-
1.1
0.5 - 1.0 -
0.8 0.8
0.7
0.2 0.5
0.5
0.4
0.2
0.0 0.0 0.0
- 0.0
- 0.0
-
21/22 22/23 23/24 24/25 25/26 26/27 27/28 28/29 29/30 30/31 31/32 … 41/42 … 50/51
Cash Other debts Champagne credit
-0.5
Commercial paper Bonds Syndicated credit
-2.0
-1.0
Strong liquidity position at €5.4bn as of 31st December 2021, of which €3.4bn credit lines undrawn
Gross debt after hedging at 31st December 2021 (excluding lease liabilities):
- 9% floating rate and 91% fixed rate
- 60% in EUR and 40% in USD
H1 FY22 Sales & Results 43
10 February 2022Bond Details
Currency Par value Coupon Issue date Maturity date
€ 1,500 m o/w:
€ 500 m 0.000% 24/10/2019 24/10/2023
€ 500 m 0.500% 24/10/2027
€ 500 m 0.875% 24/10/2031
€ 650 m 2.125% 29/09/2014 27/09/2024
€ 1,500 m o/w:
EUR € 750 m 1.125% 01/04/2020 07/04/2025
€ 750 m 1.750% 08/04/2030
€ 500 m o/w:
€ 250 m 1.125% 27/04/2020 07/04/2025
€ 250 m 1.750% 08/04/2030
€ 600 m 1.500% 17/05/2016 18/05/2026
€ 500 m 0.125% 04/10/2021 04/10/2029
$ 1,650 m o/w:
$ 800 m 4.250% 12/01/2012 15/07/2022
$ 850 m 5.500% 15/01/2042
USD $ 600 m 3.250% 08/06/2016 08/06/2026
$ 2,000 m o/w:
$ 600 m 1.250% 01/04/2028
$ 900 m 1.625% 01/10/2020 01/04/2031
$ 500 m 2.750% 01/10/2050
H1 FY22 Sales & Results 44
10 February 2022Net debt / EBITDA evolution
Closing rate Average rate(1)
EUR/USD rate 30/06/2021 -> 31/12/2021 1.19 -> 1.13 1.19 -> 1.18
Ratio at 30/06/2021 2.6 2.6
EBITDA & cash generation excl. Group
structure effect and forex impacts
-0.4 -0.4
Group structure and forex impacts 0.2 0.1
Ratio at 31/12/2021 2.4 2.4
(1) Last-twelve-month rate
H1 FY22 Sales & Results 45
10 February 2022Diluted EPS
(x 1,000) HY FY21 HY FY22
Number of shares in issue at end of period 261,877 261,877
Weighted average number of shares in issue (pro rata temporis) 262,315 261,877
Weighted average number of treasury shares (pro rata temporis) (1,654) (1,656)
Dilutive impact of stock options and performance shares 816 609
Number of shares used in diluted EPS calculation 261,478 260,829
reported
(€ millions and €/share) HY FY21 HY FY22
r
Group share of net profit from recurring operations 1,087 1,438 32.3%
Diluted net earnings per share from recurring operations 4.16 5.51 32.6%
H1 FY22 Sales & Results 46
10 February 2022You can also read