FY21 results - Space to thrive - Growthpoint Properties Australia

Page created by Bernard Woods
 
CONTINUE READING
FY21 results - Space to thrive - Growthpoint Properties Australia
Growthpoint Properties Australia

FY21
results
25 August 2021

Space to thrive.
FY21 results - Space to thrive - Growthpoint Properties Australia
Agenda.

     Overview | 3                            Portfolio update | 7
     Timothy Collyer                         Michael Green
     Managing Director                       Chief Investment Officer

     Financial                               Outlook and
     results | 15                            summary | 19
     Dion Andrews                            Timothy Collyer
     Chief Financial Officer                 Managing Director

     Supplementary
     information | 24

2   Growthpoint Properties Australia –– FY21 results
FY21 results - Space to thrive - Growthpoint Properties Australia
Overview.
Timothy Collyer
Managing Director
FY21 results - Space to thrive - Growthpoint Properties Australia
FY21 highlights.
    ‒ Delivered FFO per security at upper              Profit after tax         WALE
      end of upgraded guidance
    ‒ Increased occupancy to 97% from                  $553.2m                  6.2yrs
                                                       FY20: $272.1m, +103.3%   30 June 2020: 6.2yrs
      93% and maintained long WALE of 6.2
      years due to substantial leasing
                                                       FFO                      Property portfolio value
      success
    ‒ Achieved largest like-for-like 12-month
      valuation uplift since Group’s inception
                                                       25.7cps                  $4.5b
                                                       FY20: 25.6cps, +0.4%     30 June 2020: $4.2b, +7.1%
    ‒ Reduced gearing and payout ratio to
      support Group’s growth ambitions                 Distribution             NTA per security

    ‒ Accelerated net zero target to 2025
                                                       20.0cps                  $4.17
                                                       FY20: 21.8cps, -8.3%     30 June 2020: $3.65, +14.2%

4   Growthpoint Properties Australia –– FY21 results
FY21 results - Space to thrive - Growthpoint Properties Australia
Growthpoint targets                                 Published inaugural
    ESG                                                        net zero                                            TCFD Statement

    Accelerating our                                           2025
                                                               Our net zero
    sustainability initiatives.                                pathway includes:

                                                                Reduction in   Meeting our     High-quality
                                                                our total      energy needs    carbon offsets      Published inaugural Modern
        NABERS                          Employee engagement
                                                                energy use     with carbon-    for residual        Slavery Statement
        Energy Rating                   and alignment scores                   free energy     emissions

        5.1
                                        in top quartile of
                                        benchmark group
        FY20: 4.9 stars
                                        Engagement score
        GRESB
        score                           77%
                                        FY20: 77%
        74/100                          Alignment score
                                                                                        Growthpoint sponsors
                                                                                        Healthy Heads in
        PCP: 72/100                                                                     Trucks and Sheds, a
                                        63%                                             foundation focused on
                                                                                        mental health and
                                        FY20: 64%
                                                                                        wellbeing for workers in
                                                                                        the road transport and
                                                                                        logistics industries
5   Growthpoint Properties Australia –– FY21 results
FY21 results - Space to thrive - Growthpoint Properties Australia
Historic performance

    Long-term track record of delivering superior returns.

        Total securityholder return1                                                       Return on equity
        to 30 June 2021                                             Growthpoint
                                                                                           to 30 June 2021 (per annum)
                                                                    S&P/ASX 200 A-REIT
        34.0%     33.2%                                             Accumulation Index

                                                                                            19.7%
                                                                                                                  16.9%
                                                                                                       15.6%                15.1%

                                                                          15.5%
                                                       11.6%                       11.8%
                              10.1%
                                         7.7%
                                                               5.8%

             1 year                  3 years              5 years             10 years      1 year     3 years    5 years   10 years

       1. UBS Investment Research. Annual compound returns to 30 June 2021.

6   Growthpoint Properties Australia –– FY21 results
FY21 results - Space to thrive - Growthpoint Properties Australia
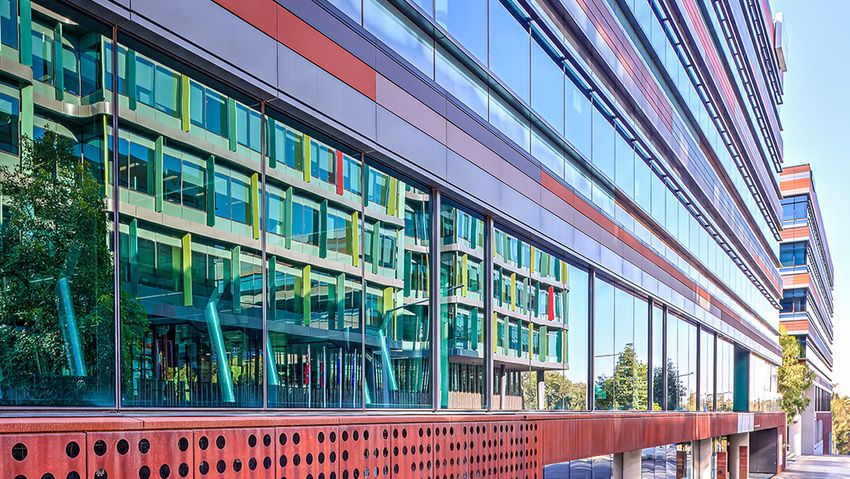
Portfolio
update.
Michael Green
Chief Investment Officer
FY21 results - Space to thrive - Growthpoint Properties Australia
Portfolio snapshot

    Record valuation uplift
    reflects strength and quality
    of portfolio.

                                                                                           Top tenants
                                                Total               Portfolio
                                                assets              occupancy
              Property
            portfolio value                     55                  97%
                                                30 June 2020: 58    30 June 2020: 93%
            $4.5b
             30 June 2020:                      Number of           Weighted average
             $4.2b, +7.1%                       tenants             lease expiry

                                                145                 6.2yrs
      Industrial                                30 June 2020: 163   30 June 2020: 6.2yrs
                     Office
      33%            67%

8   Growthpoint Properties Australia –– FY21 results
FY21 results - Space to thrive - Growthpoint Properties Australia
Office market update

    Healthy tenant demand sustained for
    high-quality metropolitan offices.
    Decline in key Sydney markets’ net                                  High-profile tenants committing to metro locations during COVID-19
    effective rents, 2Q21 vs 2Q20
                                    Sydney    Macquarie
           Sydney CBD Parramatta Olympic Park   Park    Sydney fringe
     0%                                                                     1   PARRAMATTA
                                                                                                      NORTH SYDNEY
                                                            -1.0%                                           3
                                                                                        2                                      4
    -5%                                          -4.0%
                                     -4.3%                                                                                 5       RICHMOND
                                                                                SYDNEY OLYMPIC PARK

    -10%
                                       Decline driven by increased
                                       incentives. Growthpoint’s
    -15%                               exposure limited to one
                                       asset, which has a 24-year
                                                                        1                    2             3         4    5
                                       remaining lease term with
    -20%
            -17.8%                     NSW Police Force.
                        -20.7%
    -25%

    Source: JLL REIS Data – 2Q21

9   Growthpoint Properties Australia –– FY21 results
FY21 results - Space to thrive - Growthpoint Properties Australia
Top valuations movements
                                                                                                                                                           +19%                             23.5 yr
    Office portfolio overview                                                                                                                                                               WALE

    Occupancy significantly increased                                                                                                                     1 Charles Street,
                                                                                                                                                          Parramatta, NSW
    due to substantial leasing success.                                                                                                                   $85m value increase as investor
                                                                                                                                                          demand strengthened and
                                                                                                                                                          return expectations lowered for
                                                                                                                                                          long-WALE assets
                           Portfolio                  Office               Weighted ave.             Weighted
                          occupancy               portfolio value           lease expiry          average cap rate

                           97%                     $3.0b                    7.0yrs                  5.3%                                                   +29%
                                                                                                                                                                                            7.6 yr
                                                                                                                                                                                            WALE
                        30 June 2020: 92%        30 June 2020: $2.9b      30 June 2020: 6.7yrs    30 June 2020: 5.6%

                                                                                                                                                          Botanicca 3, Richmond, VIC
                                                                                                                                                          $41m value increase
                                                                                                                                                          following leasing success.
                                                                                      On a like-for-like                                                  Including leasing done post
     Change in office property valuation1                                               basis, office                                                     30 June 2021, building now
     30 June 2020 to 30 June 2021 (by value)                                         portfolio increased                                                  82% occupied
                                                                                        by $215m or
                                                                                          +7.6%
                                                                                                                                                                                            6.7 yr
                                                                                                                                                           +16%                             WALE
                                                                                                                  Excluding
         16%          17%            67%                                                                        these assets,
                                                                                                                                                          75 Dorcas Street,
         Declined     Stable         Increased                                                                  office portfolio
                                                                                                                                                          South Melbourne, VIC
                                                                                                                   increased
    1. Declined – valuation reduced more than 1%. Stable – valuation change between -1% and 1%.                                                           $35m value increase as we
       Increased – valuation increased by more than 1%.
                                                                                                                  +2.7%                                   entered into a new 15-year
                                                                                                                                                          and 11-month lease with
10 Growthpoint Properties Australia –– FY21 results                                                                                                       Autosports Group (ASX: ASG)
Industrial market update

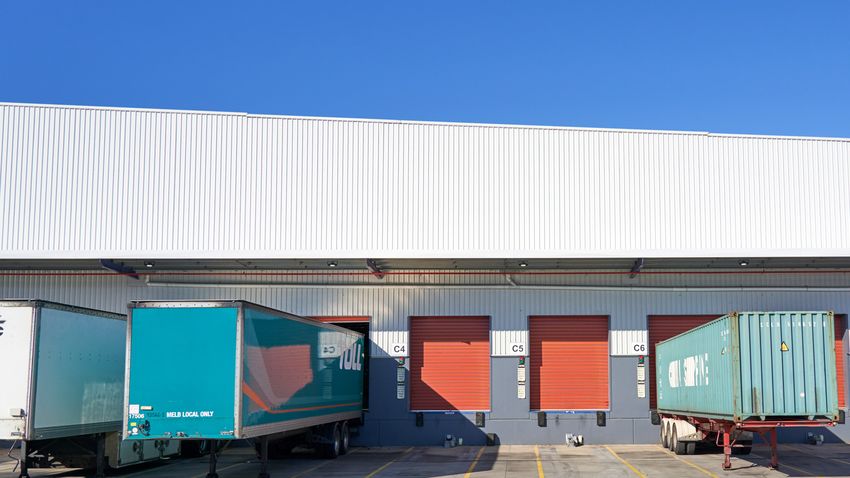
    Demand for well-located industrial                                                                            ~$45 billion of capital
                                                                                                                  chasing Australian
    space expected to stay elevated.                                                                              industrial assets2

    Online retail turnover as a % of total                             Industrial floorspace gross take-up across Australia2
                                                                                                                                                       In first half of
    Australian retail turnover1                                        (sqm)                                                                            2021, gross
                                                         9.4%   9.3%                                                                                  take-up already
                                                                        3,000,000
                                                                                                                                                      exceeds annual
                                                                                                                                                          average
                                                                        2,500,000

                                                  6.3%
                                                                        2,000,000
                                         5.6%

                                4.2%                                    1,500,000
                        3.5%
              3.1%
      2.6%                                                              1,000,000

                                                                         500,000

                                                                               0
      2014     2015     2016    2017     2018     2019   2020   2021                2008 2009 2010 2011 2012 2013 2014 2015 2016 2017 2018 2019 2020 2021
                                                                YTD                                                                                  YTD
                                                                                               Total             Annual average 2008 - 2020

    1. ABS May 2021.
    2. JLL July 2021.

11 Growthpoint Properties Australia –– FY21 results
Top valuations movements
                                                                                                                                                             +21%                               13.9 yr
    Industrial portfolio overview                                                                                                                                                               WALE

    Substantial rerating in industrial                                                                                                                      599 Main North Road,
                                                                                                                                                            Gepps Cross, SA
    sector drove strong valuation uplift.                                                                                                                   $39m increase due to further
                                                                                                                                                            strengthening of investor demand
                                                                                                                                                            for long-WALE institutional grade
                                                                                                                                                            industrial assets
                           Portfolio                 Industrial              Weighted ave.              Weighted
                          occupancy                portfolio value            lease expiry           average cap rate

                           98%                      $1.5b                     4.7yrs                   5.2%                                                  +20%
                                                                                                                                                                                                4.3 yr
                                                                                                                                                                                                WALE
                        30 June 2020: 96%         30 June 2020: $1.3b       30 June 2020: 5.0yrs     30 June 2020: 6.0%

                                                                                                                                                            20 Colquhoun Road,
                                                                                                                                                            Perth Airport, WA
                                                                                                                                                            $36m increase due to further
                                                                                          On a like-for-like                                                strengthening of investor
     Change in industrial property valuation1
                                                                                          basis, industrial                                                 demand for institutional grade
     30 June 2020 to 30 June 2021 (by value)                                             portfolio increased                                                industrial assets
                                                                                            by $202m or
                                                                                            +15.6%
                                                                                                                                                                                                1.2 yr
                                                                                                                                                             +25%                               WALE
                                                                                                                    Excluding
         17%                                      83%                                                             these assets,
         Declined                                 Increased                                                     industrial portfolio                        3 Maker Place, Truganina, VIC
                                                                                                                    increased                               $10m increase due to strong
    1. Declined – valuation reduced more than 1%. Increased – valuation increased by more than 1%.                                                          market rent growth in highly
                                                                                                                   +13.3%                                   sought-after location and yield
12 Growthpoint Properties Australia –– FY21 results                                                                                                         compression
Leasing update
                                                                                                                                                       FY21 leases                 Ave.

    Significant leasing activity in FY21 and
                                                                                                                                                     completed - %              lease term
                                                                                                                                                     portfolio income
                                                                                                                                                                                8.2yrs
                                                                                                                                                         12%
    negotiations for key FY22 expiries well advanced.
                                                                                                                                                                                FY20: 13.3yrs
                                                                                                                                                         FY20: 19%

      Key FY22 expiries                       Portfolio lease expiry
                                              per financial year, by income,                                                              Woolworths 4.1%                             29%
                                      1                                                                                                   ANZ 2.9%
                                              as at 30 June 2021
                                                                                                                                          Collection House 1.8%
                                                                                                                                          Monash Uni 1.3%
     70 Distribution Street,                                   1   Woolworths 5.5%                                                        Coffey 1.2%
     Larapinta, QLD                                                                                                    Federal Gov 2.6%                           BOQ 3.2%
     Woolworths have                                               2 Samsung 2.5%                                      Laminex 1.2%                               Federal Gov 2.5%
     indicated their                                                                                    Lion 2.4%      Linfox 1.2%                                Jacobs 1.6%
     intention to exercise                                                           Fox Sports 1.8%    Linfox 1.4%                       17%
                                                                       Downer 1.0%                                                                                Optus 1.2%
     5-year option. Market                                                           Central SEQ 1.7%   Peabody 1.3%
     rent review underway.                                             13%
                                                                                                                                                                  12%
                                                                                                        10%
                                      2                                              9%
                                                                                                                       7%                                                  WALE
      3 Murray Rose                                                                                                                                                        6.2yrs
      Avenue, Sydney                                   3%
      Olympic Park, NSW
      Samsung lease
      extended for
      5 years                                         Vacant           FY22          FY23               FY24           FY25               FY26                    FY27               FY28+

13 Growthpoint Properties Australia –– FY21 results
Portfolio rationalisation

    Strategic divestments and acquisitions executed
    to maximise income and improve quality of portfolio.
                                                                                               Olympic Park
                                                                                               train station

       $50.2m

      120 Northcorp Boulevard,
      Broadmeadows, VIC
      Non-income producing vacant asset

                                                         $52.0m
       $66.1m

                                                        11 Murray Rose Avenue,
      Quad 2 & Quad 3,                                  Sydney Olympic Park, NSW2
      Sydney Olympic Park, NSW
                                                        A-grade office, built in 2018
      WALE ~1.6 years                                   WALE 4.8 years
      17% of the Group’s tenants 1.5%
      of portfolio value1

                                                      1. As at 31 March 2021.
                                                      2. Settlement occurred 24 August 2021.
14 Growthpoint Properties Australia –– FY21 results
Financial
results.
Dion Andrews
Chief Financial Officer
Financial summary

    FY21 financial results.
                                                                                                        %
    Components of FFO                                                             FY21     FY20     change    Decrease primarily due to no contribution from Broadmeadows
                                                                                                              asset in FY21 (FY20: $10.4 million), partially offset by increased
    NPI                                                                     $m    235.6    242.1      (2.7)   income from recently-expanded Woolworths’ distribution centre
                                                                                                              in Gepps Gross and Botanicca 3
    Add back amortisation of incentives                                     $m     26.9     20.8      29.3
                                                                                                              Increase in incentives driven by long leases agreed with NSW
    NPI excluding amortisation of incentives                                $m    262.5    262.9      (0.2)
                                                                                                              Police Force and Bunnings
    Net finance costs                                                       $m    (48.2)   (47.5)      1.5
                                                                                                              Interest expense increased as interest no longer capitalised on
    Operating and trust expenses (less depreciation)                        $m    (15.7)   (14.6)      6.8    development projects, partially offset by reduced cost of debt
                                                                                                              and lowering borrowings
    Income tax expense (excluding deferred tax
                                                                            $m     (0.3)    (3.6)    (91.7)
    expense/benefit)                                                                                          MER of 0.35% in line with FY20 and slightly below 5-year
                                                                                                              average (0.38%)
    FFO1                                                                    $m    198.3    197.2       0.6
                                                                                                              No taxable development management fees in FY21, following
    Weighted average securities                                              m    772.0    771.0       0.1
                                                                                                              completion of profit-making developments in FY20
    FFO per security                                                      cents    25.7     25.6       0.4

    Distribution per security                                             cents    20.0     21.8      (8.3)   Lower distribution, reflecting the Group’s decision to maintain a
                                                                                                              more conservative payout ratio (75% - 85% of FFO) going
    Payout ratio2                                                            %       78       85        (7)
                                                                                                              forward

   1. Reconciliation of FFO to profit after tax is provided on page 27.
   2. Distributions ($ million) divided by FFO ($ million)

16 Growthpoint Properties Australia –– FY21 results
Financial summary

    Financial performance exceeded expectations.

       FFO per security movement                                                             NTA per security movement
       (cents per security )                                                                 (cents per security)
                                                                             +0.4%
                                                                                 since
                                                                             30 June 2020

                                                                                                                                                    +14.2%
                                                                                                                                                        since
                                                                                                                                                    30 June 2020

            FY20       NPI1          Net      Tax      FY21    Capitalised   Other    FY21      NTA       Office      Industrial     ADI       Retained    Other      NTA
            FFO                   borrowing         divestments interest              FFO    30-Jun-20 revaluations revaluations revaluation   cash from           30-Jun-21
                                    costs                                                                                                        FFO

      1. Excluding divestments.

17 Growthpoint Properties Australia –– FY21 results
Capital management

    Group’s gearing and payout                                                                                             Able to deploy ~$387m of undrawn debt
                                                                                                                           at a rate of ~1.0% and remain below
    ratio at record lows.                                                                                                  target gearing range

    Gearing1 as at 30 June                                                                                    Distribution payout ratio % of FFO

                                                                                       Target                                                               94.0%
     65%                                                                                                      95%
                                                                                    gearing range
                                                                                                                    94.0% 93.1%
                                                                                     35-45%
                                                                                                                                   89.4%            88.8%              85.3%
     55%                                                                                                      85%
                                                                                                                                           84.3%                            77.9%

     45%                                                                                                      75%
             40.3%                 41.2%
                                                 38.5%                                                                                                New target
                                                                                                                                                      payout ratio
                                                                     34.3%
     35%
                         36.3%
                                                                                 32.2%                        65%
                                                                                                                                                      75-85%
                                                           33.9%                             27.9%                                                        of FFO

     25%                                                                                                      55%
              FY14       FY15       FY16        FY17       FY18       FY19        FY20       FY21                   FY14    FY15   FY16    FY17    FY18     FY19    FY20   FY21

   1. Interest bearing liabilities less cash divided by total assets less ground leasehold assets and cash.

18 Growthpoint Properties Australia –– FY21 results
Strategy and
outlook.
Timothy Collyer
Managing Director
Our strategy

    Our goal is to provide Securityholders
    with sustainably growing income returns
    and long-term capital appreciation.
     We are focused on four strategic pillars.

        Invest in high-quality                  Maximise                          Maintain high-                   Enter into funds
   1 assets                                2 value                              3 occupancy                      4 management
        We seek to invest in high-              We develop asset retention        As we asset manage the           We are exploring
        quality, modern commercial              and management strategies         properties we own, we are        opportunities to diversify our
        real estate, that provide an
                                                for each of our properties to     able to develop long-term        income stream by entering
        attractive income yield and
                                                maximise income and value.        relationships with our           into funds management.
        long-term capital
        appreciation                            These include plans for           tenants. We are focused on
                                                                                                                   By leveraging our expertise,
                                                leasing, refurbishment,           ensuring our properties meet
        All our properties are located                                                                             we believe we can generate
                                                expansion, development or         our tenants’ needs now and
        in Australia, where we have                                                                                higher returns on capital
                                                divestment.                       in the future. This helps us
        an in-depth understanding of                                                                               employed for our
                                                                                  to maintain high occupancy
        the market.                                                                                                Securityholders.
                                                                                  levels and consistent rental
                                                                                  income.

20 Growthpoint Properties Australia –– FY21 results
Outlook

    Growthpoint well positioned to deliver
    growth, despite near-term uncertainty.
     Challenges in near-term                          Growthpoint's business model has
     operating environment                            demonstrated resilience throughout pandemic

        COVID-19 lockdowns likely
        to continue to occur until
        vaccine rate significantly
        higher in Australia                            Largest like-for-     Portfolio occupancy    Strong position to
                                                       like 12-month         increased to 97%       pursue growth
                                                       valuation uplift in   and long WALE of       opportunities with
        Economic recovery may be                       Group’s history       6.2 years maintained   gearing and payout
        delayed and slower return
                                                                                                    ratios at historic lows
        to working in office
        environment

21 Growthpoint Properties Australia –– FY21 results
Outlook

    FY22 guidance.
                                                                                                                Forecast
                                                                                               FY22         distribution yield1
                                                                                            distribution
                                                                                             guidance
                                                                                                               5.0%
                                           FY22
                                        FFO guidance
                                          at least
                                                                                           20.6cps
                                   26.3cps
                                                                                            +3.0% on FY21

                                          +2.3% on FY21

    1. Distribution yield is the FY22 DPS guidance of $0.206 per security divided by the
       closing ASX price as at 23 August 2021 of $4.09.

22 Growthpoint Properties Australia –– FY21 results
Thank you for joining us.

Questions.
Supplementary
information.

Financial     Property    Key market   Additional
information   portfolio   metrics      information
– 25          – 36        – 44         – 47
Financial
information.
Financial information

    Summary financials.
                                                                                                     FY21                FY20    Change    % Change
    NPI1                                                                          $m                235.6               242.1      (6.5)       (2.7)
    Like-for-like NPI                                                             $m                228.1               228.0       0.1         0.0
    Statutory accounting profit                                                   $m                553.2               272.1     281.1       103.3
    Statutory accounting profit per security                                        ¢                71.7                35.3      36.4       103.1
    FFO                                                                           $m                198.3               197.2       1.1         0.6
    Distributions                                                                 $m                154.4               168.3     (13.9)       (8.3)
    Payout ratio                                                                    %                77.9                85.3      (7.4)
    FFO per security                                                                ¢                25.7                25.6       0.1         0.4
    Distributions per security                                                      ¢                20.0                21.8      (1.8)       (8.3)
    ICR                                                                          times                 4.8                 4.6      0.2         4.3
    MER                                                                             %                0.35                0.35

                                                                                         As at 30 Jun 2021   As at 30 Jun 2020   Change    % Change
    NTA per stapled security                                                        $                4.17                3.65      0.52        14.2
    Gearing                                                                         %                27.9                32.2      (4.3)

    1. Net property income plus distributions from equity related investments.

26 Growthpoint Properties Australia –– FY21 results
Financial information

    Reconciliation from statutory profit to FFO.
                                                                                        FY21      FY20     Change    Change
                                                                                          $m        $m        $m         %
    Profit after tax                                                                    553.2     272.1     281.0     103.3
    Less FFO items:
    - Straight line adjustment to property revenue                                       (8.5)      1.0      (9.5)
    - Net loss in fair value on sale of investment properties                             1.5       0.0       1.5
    - Net (gain) in fair value of investment properties                                (356.5)   (116.9)   (239.6)
    - Net (gain) / loss in fair value of investment in securities                       (29.3)     15.7     (45.0)
    - Net (gain) / loss in fair value of derivatives                                     43.8     (31.5)     75.3
    - Net (gain) / loss on exchange rate translation of interest-bearing liabilities    (33.0)     28.5     (61.5)
    - Amortisation of incentives and leasing costs                                       26.9      20.8       6.1
    - Deferred tax expense / (benefit)                                                   (3.3)      3.8      (7.0)
    - Other                                                                               3.5       3.7      (0.2)
    FFO                                                                                 198.3     197.2       1.1       0.6

27 Growthpoint Properties Australia –– FY21 results
Financial information

    Financial position.                                   30 Jun 2021   30 June 2020
                                                                  $m             $m
    Assets
    Cash and cash equivalents                                    33.5           42.7
    Investment properties                                     4,619.6        4,325.7
    Investment in securities                                    104.8           69.9
    Other assets                                                 19.9           62.4
    Total assets                                             4,777.8        4,500.7

    Liabilities

    Borrowings                                                1,327.1        1,446.0
    Distributions payable                                        77.2           77.2
    Lease liabilities                                           106.8          111.2
    Other liabilities                                            45.3           43.7
    Total liabilities                                        1,556.4        1,678.1

    Net assets                                               3,221.4        2,822.6

    Securities on issue                               m         771.9          771.8
    NTA per security                                  $          4.17           3.65
    Balance sheet gearing                             %          27.9           32.2

28 Growthpoint Properties Australia –– FY21 results
Financial information

    Additional financial information.
    Reconciliation of operating cashflow to FFO                             Proportion of total billings collected1
                                                                   FY21                                                                                 FY21

                                                                     $m     Office                                                                      99%
    Operating cashflow                                             151.7    Industrial                                                              100%
    Lease incentives and leasing costs                              50.8    Total portfolio                                                             99%
    Net (prepaid)/accrued operating activities                      (3.0)
    Provision for income tax                                         1.2    COVID-19 rent relief
    Lease liability repayments classified as financing cashflows    (0.8)
                                                                                                             FY20                FY21                   Total
    Unamortised upfront costs                                       (1.6)
                                                                            Rent abatement                 $0.9m               $0.5m               $1.4m
    FFO                                                            198.3
    FY21 distributions provided for or paid during the period      154.4
                                                                            Rent deferred                  $1.9m               $0.3m               $2.2m
                                                                            Total                          $2.8m               $0.8m               $3.6m

                                                                            Industrial portfolio               8%                  0%                      -
                                                                            Office portfolio                 92%                100%                       -

                                                                            1. Rent abatements are not included in total billings. Rent that has been
                                                                               deferred is included. Data as at 30 June 2021.

29 Growthpoint Properties Australia –– FY21 results
Financial information

    Lease incentives.                                                                                         Consolidated Statement of Profit and Loss                              FY21
                                                                                                                                                                                       $m
                                                                                                                                                                                              FY20
                                                                                                                                                                                                $m
                                                                                                              Property revenue (excluding incentives)                                315.6    308.1
    Lease incentives includes fit out, rent free, rental
                                                                                                              Amortisation of tenant incentives                                      (26.9)   (20.8)
    abatement and cash payments. The tables on this page
                                                                                                              Property revenue                                                       288.7    287.3
    show the financial impact of incentives on Growthpoint’s
                                                                                                              Net changes in value of investment properties (excluding incentives)   331.1    107.2
    financial statements1
                                                                                                              Net value of tenant incentive changes during the period                 25.4      9.7
    Average lease incentives                                  FY19          FY20         FY21
                                                                                                              Net changes in value of investment properties                          356.5    116.9

                        23%                              25%
                                       20%                                               19%                  Consolidated Cash Flow Statement                                       FY21     FY20
                                                                                                                                                                                       $m       $m
               12%                              12%                              13%
       10%                                                                                                    Cash generated from operating expenses (excluding incentives)          180.7    181.9
                                                                         7%
                                                                                                              Incentives paid2                                                       (29.0)    (0.7)
                                                                                                              Cash generated from operating activities                               151.7    181.2

               Total                          Office                         Industrial
                                                                                                              Consolidated Statement of Financial Position                           FY21     FY20
  1. The financial impact includes all relevant historical impacts but not necessarily all future ones. For
     example, a cash payment would be captured here regardless of when a lease commences but                                                                                           $m       $m
     rent free for a future period would not be captured until the relevant period.                           Unamortised lease incentives, recognised within
                                                                                                                                                                                      79.6     55.7
  2. Includes cash incentives and fit out incentives only. Other non-cash tenant incentives provided in       investment property as a reconciling item
     FY21 were rent abatement of $6.0 million and rent free incentives of $14.2 million. These two
                                                                                                              Unamortised leasing costs recognised within investment
     amounts form part of the unamortised lease incentives balance in the Consolidated Statement of                                                                                    4.6      3.5
     Financial Position. Leasing costs of $2.2 million were also paid in FY21.                                property as a reconciling item3

  3. Includes establishment costs such as legal costs and agent fees.

30 Growthpoint Properties Australia –– FY21 results
Financial information

    Operating and capital expenses.
    Operating expenses

                                                                                                 FY21         FY20                  Average
    Total operating expenses                                                       $m             15.7         14.4               0.38%
    Average gross assets value                                                     $m          4,425.3     4,170.8               FY16 – FY21
    Operating expenses to average gross assets                                      %             0.35         0.35

    Capital expenditure                                                                                                           Expected to
                                                                                                                                    average
                                                                                                 FY21         FY20
                                                                                                                             0.3%-0.5%
    Total portfolio capex                                                         $m              21.2         18.5             over medium-term
    Average property asset value                                                  $m           4,384.8     4,154.7               based on current
                                                                                                                                     portfolio
    Capital expenditure to average property portfolio value                        %              0.48         0.44

    FY21 capex primarily driven by two significant projects:
    • The Group has an obligation to make available $6.0 million to spend on capital works at 1 Charles St, Parramatta, NSW. As at 30 June
      2021, $4.0 million of refurbishment works had been carried out.
    • $6.2 million of capital works at 75 Dorcas Street, South Melbourne, Victoria as agreed under the lease to ANZ.

31 Growthpoint Properties Australia –– FY21 results
Financial information

    Capital management.
    Maturity date                                     Time to maturity   Fixed rate   Principal Amount

    Interest rate swaps
    Jun-2023                                                 2.0 years      1.15%               $25m                           3.17%
    Jun-2023                                                 2.0 years      1.15%               $75m                         Weighted average
    Dec-2023                                                 2.5 years      0.22%               $20m                          fixed debt rate
    Dec-2023                                                 2.5 years      0.21%               $15m       4.3 yrs
    Feb-2024                                                 2.6 years      0.22%               $25m     Weighted average
    Jun-2024                                                 3.0 years      1.21%              $100m      fixed debt term
    Jun-2025                                                 4.0 years      1.29%              $100m
    Weighted average interest rate swaps                     2.9 years      1.05%              $360m                    50%-100%
                                                                                                                            Target fixed/hedged
    Fixed rate debt facilities
                                                                                                                                    debt
    Mar-2025                                                 3.8 years      4.67%              $200m
    Dec-2026                                                 5.5 years      3.27%              $100m
    Jun-2027                                                 6.0 years      5.28%              $133m
    Jun-2029                                                 8.0 years      5.45%                $53m
    Jun-2029                                                 8.0 years      5.35%                $26m
    Weighted average fixed rate debt facilities              5.3 years      4.67%              $512m

    Weighted average fixed debt                              4.3 years      3.17%              $872m

    Debt fixed at 30 June 2021                                   65%

32 Growthpoint Properties Australia –– FY21 results
Financial information

    Key debt metrics and changes during FY21.
                                                                  30 Jun 2021    30 Jun 2020    Change

    Gross assets                                           $m         4,777.8        4,500.7     277.1

    Interest bearing liabilities                           $m         1,327.1        1,446.0    (118.9)

    Total debt facilities                                  $m         1,720.0        1,813.0     (93.0)

    Undrawn debt                                           $m           387.5          360.0      27.5

    Gearing                                                  %           27.9           32.2      (4.3)

    Weighted average cost of debt (based on drawn debt)      %            3.3            3.4      (0.1)

    Weighted average debt maturity                        years           4.1            4.7      (0.6)

    Annual ICR / covenant ICR                             times      4.8 / 1.6      4.6 / 1.6

    Actual LVR / covenant LVR                                %       29.6 / 60      33.5 / 60

    Weighted average fixed debt maturity                  years           4.3            5.0      (0.7)

    % of debt fixed                                          %           65.0           67.3      (2.3)

    Debt providers                                          no.            20             21        (1)

33 Growthpoint Properties Australia –– FY21 results
Financial information
                                                                                                                                 Stress testing
    Capital management.                                                                                                          covenants                    ICR >1.6x
                                                                                                                                                                 GOZ: 4.8x
                                                                                                                                                               To breach this
                                                                                                                                                               covenant, NPI
   Gearing movement                                                                                                             LVR 85%
                                                                                                                                                               GOZ: 98%
                                                                                                                                                            Percentage must
                                                                                                                                                           remain above 85%

                                                                                              430bps
                                                                                                    Reduction since
                                                                                                     30 June 2020

           30-Jun-20     Investment    Divestments    Cash from     FX translation   Distribution     Capex and ADI 30-Jun-21
                        revaluations                  operating       and MTM           paid            securities              1. As at 30 June 2021. For illustrative purposes
                                                       activities    derivatives                        acquired                   only. Assumes no change to other inputs
                                                                                                                                   that could impact the calculation of this
                                                                                                                                   metric.

34 Growthpoint Properties Australia –– FY21 results
Financial information

    Group debt maturity profile.
    As at 30 June 2021 ($ million)
                                                                            Bank debt   Institutional term loan    Undrawn bank debt      USPP

    450

    400
                                                             138
    350

    300
                                     50
                                                      315
                                    40                                     50
    250
                                                             200
    200
                                                                           133                                    232

    150
                                   250
    100
                                                                    150    100
     50
                                                              62
      0
                FY22               FY23               FY24   FY25   FY26   FY27           FY28                    FY29             FY30

35 Growthpoint Properties Australia –– FY21 results
Property
portfolio.
84% of properties
    Property portfolio                                                                                                        located on
                                                                                                                              Eastern seaboard
    Geographic diversity                                                                                                                          26%
    – by property value.                                                                                                                          Queensland
                                                                                                                                                  $1,173.8 million

        Office metropolitan properties (21 assets)                         $4.5b                                                                  Office
                                                                                                                                                  Industrial
                                                                                                                                                               $910.9m
                                                                                                                                                               $262.9m
        Office CBD properties (3 assets)                                     Property
        Industrial properties (31 assets)                                  portfolio value                                                        25%
                                                                                                                  7       1     4                 New South Wales
                                                                                                                                                  $1,137.1 million
                                                      1   2                                                                                       Office       $873.5m

                               8%                                                            1   4
                                                                                                                                                  Industrial   $263.6m

                               Western Australia
                                                                                                                      4   5
                               $370.2 million
                               Office
                               Industrial
                                            $100.0m
                                            $270.2m                                                        8 16
                                                                                                                      2                           4%
                                                                                                                                                  Australian Capital
                                                                                                                                                  Territory
                                                              8%                        29%                                                       $176.0 million
                                                                                                                                                  Office       $176.0m
                                                              South Australia           Victoria
                                                              $346.5 million            $1,317.4 million
   May not sum due to rounding.
                                                              Office        $69.0m      Office       $896.2m
                                                              Industrial   $277.5m      Industrial   $421.2m

37 Growthpoint Properties Australia –– FY21 results
Property portfolio                       Sector diversity                              Geographic diversity                    Occupancy
                                             by value                                      by value                                by income
    Portfolio                                                                                                                         Vacant 3%
                                                                                                          WA 8%
    summary.                                                      Industrial 33%          NSW 25%             SA 8%
                                                                                                                   ACT 4%
    As at 30 June 2021

                                            Office 67%                                    VIC 29%                 QLD 26%
                                                                                                                                                     Occupied 97%

                                             Tenant type                                   Tenant use                              Annual rent review type
                                             by income                                     by income                               by income

                                                         SME 3%
                                                                     Large private                                                                  Fixed over 4.00% 7%
                                            Government              company 14%                              Logistics /
                                            23%                                                              distribution                                 Fixed 2.50%-2.99% 14%
                                                                                                             30%
                                                                                                                                                            CPI+1.00% 1%
                                                                                                                                                             CPI 6%
                                                                                                              Manufacturing 2%
                                              Listed                                                          Retail 3%
                                              company                                Office 63%              Car parking 1%
                                              60%                                                           Other 1%
                                                                                                                                 Fixed 3.00%-3.99% 72%

38 Growthpoint Properties Australia –– FY21 results
Property portfolio

    Portfolio metrics.
    Key metrics                                                                                        Like-for-like NPI growth (FY20 to FY21)
                                                                                                                                                 Distributions
                                                                  30 June 2021        30 June 2020
                                                                                                                                                  from equity
    Number of assets                                                             55              58                        Office   Industrial   investments     Total
    Property portfolio value                                         $4.5 billion       $4.2 billion
                                                                                                       NPI growth          -1.6%       3.3%             0.1%     0.0%
    Number of tenants                                                           145            163
    Portfolio occupancy                                                        97%            93%
    Tenant retention                                                           77%            85%
    WALE                                                               6.2 years          6.2 years
    Weighted average property age                                     12.4 years         12.1 years
    Weighted average capitalisation rate                                       5.2%           5.7%
    WARR                                                                   3.4%1             3.3%2

    1.   Assumes CPI change of 3.85% per annum as per ABS release for FY21.
    2.   Assumes CPI change of -0.35% per annum as per ABS release for FY20.

39 Growthpoint Properties Australia –– FY21 results
Property portfolio

    Top ten tenants – by income.
    Total portfolio                                            Office tenants                                     Industrial tenants
    as at 30 June 2021                                         as at 30 June 2021                                 as at 30 June 2021
                                    % portfolio       WALE                                 % portfolio   WALE                                    % portfolio   WALE
                                       income          (yrs)                                  income      (yrs)                                     income      (yrs)

    Woolworths                               13         5.4    NSW Police Force                    12     23.5    Woolworths                             40      5.4
    NSW Police Force                          8        23.5    Commonwealth of Australia           10      5.1    Linfox                                 10      3.7
    Commonwealth of Australia                 7         5.1    Country Road Group                   5     11.0    Australia Post                          6     10.0
    Country Road Group                        4        11.0    Bank of Queensland                   5      5.6    Laminex Group                           4      4.0
    Linfox                                    3         3.7    ANZ Banking Group                    4      4.7    HB Commerce                             3      1.2
    Bank of Queensland                        3         5.6    Bunnings Warehouse                   4      9.8    Brown & Watson International            3      4.1
    ANZ Banking Group                         3         4.7    Samsung Electronics                  4      0.7    The Workwear Group                      2      6.0
    Bunnings Warehouse                        3         9.8    Lion                                 4      2.8    Autocare Services                       2      9.3
    Samsung Electronics                       3         0.7    Jacobs Group                         3      4.4    Symbion                                 2      7.5
    Lion                                      2         2.8    Fox Sports                           3      1.5    Mainfreight Distribution                1      1.4
    Total / weighted average                 49         8.5    Total / weighted average          54%       9.5    Total / weighted average             73%       5.4
    Balance of portfolio                     51         4.1    Balance of portfolio              46%       4.1    Balance of portfolio                 27%       2.9
    Total portfolio                         100         6.2    Total portfolio                  100%       7.0    Total portfolio                     100%       4.7

40 Growthpoint Properties Australia –– FY21 results
Property portfolio

    Leasing – office leases executed in FY21.
    Location                                                       Tenant                               Start date   Term (yrs)   NLA (sqm) Car parks (no.)
    333 Ann Street                         Brisbane          QLD   Brisbane Housing Corporation         Q1, FY21           8.0          867              9
    333 Ann Street                         Brisbane          QLD   Condor Energy Services               Q1, FY21           5.7          295               -
    Building 3, 570 Swan Street            Richmond          VIC   Jones Lang LaSalle (VIC)             Q1, FY21           5.0          157              3
    333 Ann Street                         Brisbane          QLD   Omada Rail Systems                   Q2, FY21           6.0          385               -
    Building B, 211 Wellington Road        Mulgrave          VIC   Monash University                    Q2, FY21           5.4        8,995            400
    Building 3, 570 Swan Street            Richmond          VIC   Bunnings Warehouse                   Q2, FY21          10.6       13,886            308
    333 Ann Street                         Brisbane          QLD   Prosperity Services                  Q2, FY21           5.0          410               -
    33-39 Richmond Road                    Keswick           SA    SA Government                        Q2, FY21          10.0        3,476             90
    Building C, 219-247 Pacific Highway    Artarmon          NSW   Multiplex Constructions              Q2, FY21           2.0        1,106             15
    333 Ann Street                         Brisbane          QLD   Titan Recruitment                    Q3, FY21           3.3          129               -
    333 Ann Street                         Brisbane          QLD   WP Engine                            Q3, FY21           2.0          240               -
    333 Ann Street                         Brisbane          QLD   First Focus IT                       Q3, FY21           5.5          540              5
    Car Park, 572-576 Swan Street          Richmond          VIC   General Electric International Inc   Q3, FY21           3.0            0             52
    Building B, 211 Wellington Road        Mulgrave          VIC   Monash University                    Q4, FY21           5.0        1,842            140
    A1, 32 Cordelia Street                 South Brisbane    QLD   RMA Engineers                        Q4, FY21           3.5          215              4
    A4, 52 Merivale Street                 South Brisbane    QLD   Stantec Australia (1)                Q4, FY21           7.0          605              9
    100 Skyring Terrace                    Newstead          QLD   Prometheus Group Australia           Q4, FY21           7.0        1,098             10
    109 Burwood Road                       Hawthorn          VIC   EHG Services                         Q4, FY21           6.2        1,585             20
    75 Dorcas Street                       South Melbourne   VIC   Autosports Group                     Q4, FY21          15.9        7,381             20

41 Growthpoint Properties Australia –– FY21 results
Property portfolio

    Leasing – office leases executed in FY21(cont.)
    Location                                                           Tenant                        Start date   Term (yrs)   NLA (sqm) Car parks (no.)
    Building 3, 570 Swan Street            Richmond              VIC   Mitsubishi Motors Australia   Q1, FY22           5.0          332              6
    Building 3, 570 Swan Street            Richmond              VIC   Recruitment firm              Q1, FY22          10.0          856             15
    A4, 52 Merivale Street                 South Brisbane        QLD   Stantec Australia (2)         Q1, FY22           7.0          633               -
    5 Murray Rose Avenue                   Sydney Olympic Park   NSW   George Rassos                 Q4, FY22           0.6           69               -
    Building C, 219-247 Pacific Highway    Artarmon              NSW   GG Leasing                    Q3, FY24           1.0           71              1
    100 Skyring Terrace                    Newstead              QLD   Redchip Lawyers               Q3, FY26           3.7        1,010             20
    A4, 52 Merivale Street                 South Brisbane        QLD   Stantec Australia (3)         Q4, FY27           1.0        1,239             16

    Weighted average / total                                                                                            8.6       47,422          1,143

42 Growthpoint Properties Australia –– FY21 results
Property portfolio

    Leasing – industrial leases executed in FY21.
    Location                                                                    Tenant                     Start date   Term (yrs)   NLA (sqm)
    58 Tarlton Crescent                               Perth Airport       WA    Couriers Please            Q1, FY21           3.0        3,638
    13 Business Street                                Yatala              QLD   Volo Modular               Q1, FY21           5.0        8,951
    3 Millennium Court                                Knoxfield           VIC   Opal Packaging Australia   Q3, FY21           5.0        8,040
    12-16 Butler Boulevard                            Adelaide Airport    SA    Australia Post (1)         Q3, FY21          10.5      16,835
    1-3 Pope Court                                    Beverley            SA    Furnx                      Q4, FY21           5.2        3,571
    40 Annandale Road                                 Melbourne Airport   VIC   Australia Post (2)         Q1, FY22          10.0      44,424
    130 Sharps Road                                   Melbourne Airport   VIC   Laminex Group              Q4, FY22           3.0      28,100

    Weighted average / total                                                                                                  7.2     113,559

43 Growthpoint Properties Australia –– FY21 results
Key market
metrics.
Key market metrics                                                                                                                                                                 3% of
                                                                                                                                                                                    Growthpoint      Brisbane - CBD
                                                                                                                                                                                                                                 17% of
                                                                                                                                                                                                                               Growthpoint    Brisbane - Fringe
                                                                                                                                                                                     Portfolio                                  Portfolio

    Office markets.
                                                                                                                                                                                                      Vacancy 15.9%                             Vacancy 17.2%
                                                                                                                                                                                                    Prime      Secondary                       Prime        Secondary
                                                                                                                                                                                             R    $764 gross $595 gross                R     $596 gross $476 gross
                                                                                                                                                                                             I      41%           43%                   I      43%            43%
                                                                                                                                                                                             Y 5.00-6.25% 5.75-7.00%                   Y 5.75-7.25% 6.00-7.75%

     R – Average face rent per sqm per annum
     I – Average incentives                                                                                                                                                                                                                                    12% of
     Y – Average core market yield                                                                                                                                                                                               Sydney - Parramatta Growthpoint
                                                                                                                                                                                                                                                              Portfolio
                                                                                                                                                                                                                                      Vacancy 15.4%
                                                                                                                                                                                                                                    Prime      Secondary
                                                                                                                                                                                                                           R      $596 net      $445 net
      2% of                                 0% of                                                                                                                              Brisbane                                    I        35%           29%
   Growthpoint    Perth – West Perth     Growthpoint         Perth - CBD                                                                                                                                                   Y 4.88-5.88% 5.50-6.00%
    Portfolio                              Portfolio
                     Vacancy 22.3%                           Vacancy 19.7%                          0% of                                                                                                                                                      5% of
                   Prime     Secondary                     Prime       Secondary                 Growthpoint       Adelaide - CBD                                                                                                Sydney Olympic Park Growthpoint
                                                                                                  Portfolio                                                                                                                                                   Portfolio
           R      $361 net   $263 net           R         $625 net     $379 net                                       Vacancy 16.9%                                                                                                   Vacancy 24.3%
                                                                                     Perth                                                                                    Sydney
           I        37%        36%               I          49%          51%                                       Prime     Secondary                                                                                              Prime
                                                                                                          R     $534 gross $364 gross Adelaide                     Canberra                                                R      $434 net
           Y     6.75-7.75% 7.00-9.25%          Y        5.00-7.75% 6.50-9.50%
                                                                                                          I        37%        38%                                                                                          I        30%
                                                                                                          Y 5.00-7.00% 6.00-8.50%                              Melbourne                                                   Y 5.25-6.25%
                                                                                                                                                                                                                                                                0% of
                                                                                                                                                                                                             4% of                    Sydney - CBD           Growthpoint
                                                                                                                                                                                         Canberra         Growthpoint                                          Portfolio
                                                                                                                                                                                                           Portfolio                  Vacancy 13.2%
                                              0% of                                   17% of                                  3% of                                                     Vacancy 7.0%
                                           Growthpoint       Melbourne - CBD        Growthpoint Melbourne - Fringe         Growthpoint       Melbourne – SES                                                                        Prime       Secondary
                                            Portfolio                                Portfolio                               Portfolio                                               Prime        Secondary
                                                               Vacancy 14.1%                      Vacancy 15.3%                                Vacancy 11.5%                                                               R     $1,214 net     $884 net
                                                                                                                                                                               R   $476 gross $397 gross
                                                             Prime      Secondary               Prime         Secondary                     Prime      Secondary                                                           I        33%           33%
                                                                                                                                                                               I      23%           25%
                                                     R      $626 net     $465 net         R    $488 net       $391 net             R       $397 net     $307 net                                                           Y 4.38-5.00% 4.75-5.25%
                                                                                                                                                                               Y   4.75-6.50% 5.75-9.75%
     Sources: JLL, Knight Frank,                     I        36%          33%             I     32%            32%                   I      28%          28%
     Growthpoint research                            Y 4.38-5.13% 4.50-5.50%              Y 4.75-5.63% 5.00-6.00%                     Y   4.75-5.75%   5.25-6.75%

45 Growthpoint Properties Australia –– FY21 results
Key market metrics

    Industrial markets.                                                                                                                                                                            Brisbane
                                                                                                                                                                                                                        6% of
                                                                                                                                                                                                                     Growthpoint
                                                                                                                                                                                                                      Portfolio
                                                                                                                                                                                                V: 612,732 sqm1
                                                                                                                                                                                               Prime     Secondary
                                                                                                                                                                                     R        $116 net    $89 net
     R – Average face rent per sqm per annum                                                                                                                                          I       10-25%      10-20%
     I – Average incentives                                                                                                                                                           Y   4.50-5.50% 5.75-7.75%
     Y – Average core market yield
     V – Vacancy

                                                                                                                                                                                                                        6% of
                                                                                                                                                                                                    Sydney           Growthpoint
                                                                                                                                                             Brisbane                                                 Portfolio
                                                                                                                                                                                                V: 575,149 sqm1
                                                                                                                                                                                               Prime     Secondary
                                                                                                                                                                                      R       $160 net    $145 net
                                                                                                                                                                                      I        8-15%       8-18%
                                                                                      Perth                                                                 Sydney                    Y   3.75-4.50% 4.25-5.25%

                                                                                                                                     Adelaide

                                                   6% of                                         6% of                                          Melbourne
                                                Growthpoint             Perth                 Growthpoint         Adelaide
                                                  Portfolio                                    Portfolio                                                                                             9% of
                                                                    566,2452                                    V: Not Available                                              Melbourne           Growthpoint
                                                                                                                                                                                                   Portfolio
                                                                Prime      Secondary                          Prime      Secondary                                          V: 886,314 sqm1
                                                       R       $99 net      $84 net                  R       $91 net       $67 net                                         Prime     Secondary
                                                        I       5-20%       10-25%                    I       5-20%       10-25%                                     R    $97 net     $76 net
                                                       Y      5.25-5.75% 6.25-6.75%                  Y      5.00-8.00% 6.25-10.25%                                   I    15-25%     10-20%
                                                                                                                                                                     Y   4.00-4.50% 4.50-5.25%
   Sources: JLL, Knight Frank, Colliers, Growthpoint research
   1. Total market vacancy, only spaces over 5,000sqm captured.
   2. Total market vacancy, only spaces over 2,000sqm captured.

46 Growthpoint Properties Australia –– FY21 results
Additional
information.
Additional information

    Glossary.                              Term
                                           ABS
                                                                 Definition
                                                                 Australian Bureau of Statistics
                                                                                                                                       Term
                                                                                                                                       MER
                                                                                                                                                          Definition
                                                                                                                                                          Management expense ratio
                                           A-REIT                Australian Real Estate Investment Trust                               NABERS             National Australian Built Environment Rating System
                                           ASX                   Australian Securities Exchange                                        NLA                Net lettable area
                                           b                     Billion                                                               NPI                Net property income plus distributions from equity related
                                           bps                                                                                                            investments
                                                                 Basis points
                                                                                                                                       NSW                New South Wales, Australia
                                           capex                 Capital expenditure
                                                                                                                                       NTA                Net tangible assets
                                           cap rate or           The market income produced by an asset divided by its value
                                           capitalisation rate   or cost                                                               Payout ratio       Distributions ($million) divided by FFO ($million)
                                           CBD                   Central business district                                             Q                  Quarter
                                           CPI                   Consumer price index                                                  QLD                Queensland, Australia
                                           cps                   Cents per security                                                    ROE or return on   Calculated as the percentage change in NTA plus the
                                                                                                                                       equity             distributions for a given period divided by the opening NTA
                                           DPS                   Distribution per security
                                                                                                                                       SA                 South Australia, Australia
                                           FFO                   Funds from operations
                                                                                                                                       sqm                Square metres
                                           FY                    Financial year
                                                                                                                                       TCFD               Task Force on Climate-related Financial Disclosures
                                           gearing               Interest bearing liabilities less cash divided by total assets less
                                                                 finance lease assets less cash                                        Total              Change in security price plus distributions paid or payable for
                                                                                                                                       securityholder     the relevant period
                                           GOZ                   Growthpoint or Growthpoint’s ASX trading code or ticker
                                                                                                                                       return
                                           GRESB                 Global Real Estate Sustainability Benchmark
                                                                                                                                       USPP               United States Private Placement
                                           Growthpoint or        Growthpoint Properties Australia comprising the Company,
                                                                                                                                       VIC                Victoria, Australia
                                           the Group             the Trust and their controlled entities
                                                                                                                                       WALE               Weighted average lease expiry
                                           ICR                   Interest coverage ratio
                                                                                                                                       WARR               Weighted average rent review
                                           JLL                   The Australian arm of Jones Lang LaSalle, an international
                                                                 professional services and investment management firm                  Woolworths         Woolworths Group Limited
                                           LVR                   Loan to value ratio                                                   yr                 Year
                                           m                     Million

48 Growthpoint Properties Australia –– FY21 results
Additional information

    Important information.
    This presentation has been prepared by Growthpoint Properties Australia Limited (ACN 124 093 901) in its personal capacity and as responsible
    entity of Growthpoint Properties Australia Trust (ARSN 120 121 002) about the activities of Growthpoint Properties Australia (ASX: GOZ)
    (Growthpoint). This presentation contains general information about Growthpoint and does not purport to be complete or comprehensive or
    contain any form of investment, legal or other advice. It is not an offer or invitation for subscription or purchase of securities or other financial
    products.
    Information in this presentation has been prepared without taking into account any investor’s objectives, financial situation or needs. Before
    making an investment decision, investors should consider the appropriateness of the information in this presentation, which should be read in
    conjunction with Growthpoint’s other continuous disclosure announcements lodged with the ASX, including Growthpoint’s half year report and
    financial statements for the twelve months ended 30 June 2021. Investors should seek such independent financial, legal or tax advice as they
    deem necessary or consider appropriate for their particular jurisdiction.
    This presentation contains forward looking statements, opinions and estimates based on assumptions, contingencies and market trends made by
    Growthpoint which are subject to certain risks, uncertainties and may change without notice. Should one or more of the risks or uncertainties
    materialise, or should underlying assumptions prove incorrect, there can be no assurance that actual outcomes for Growthpoint will not differ
    materially from statements made in this presentation.
    To the maximum extent permitted by law and regulations (including ASX Listing Rules), Growthpoint, and their officers and employees, do not
    make any warranties or representations, express or implied, as to the currency, accuracy, reliability or completeness of the information in this
    presentation and disclaim all responsibility and liability for the information (including, without limitation, liability for negligence).
    Past performance information given in this presentation should not be relied upon as an indication of future performance.
    The statements in this presentation are made as at 25 August 2021. All reference to dollars ($) are to Australian dollars.
    This presentation was authorised by Growthpoint’s Board of Directors.

49 Growthpoint Properties Australia –– FY21 results
Contact us.
Retail investors
Computershare
1300 665 792 (within Australia)
+61 (3) 9415 4366 (outside Australia)
webqueries@computershare.com.au

Institutional investors
Virginia Spring
Investor Relations and Communications Manager
+61 (3) 8681 2933
investor.relations@growthpoint.com.au
                                                2021 calendar.
                                                • 28 October – 1Q22 Update
                                                • 22 November – Annual General Meeting
Growthpoint Properties Australia
Level 31, 35 Collins Street
Melbourne VIC 3000
www.growthpoint.com.au
                                                Dates are indicative and subject to change.
You can also read