For the six month period to 30 September 2019 - 20 November 2019 - uandiplc.com

Page created by Anita Thornton
 
CONTINUE READING
For the six month period to 30 September 2019 - 20 November 2019 - uandiplc.com
For the six month period to
    30 September 2019

    20 November 2019       Circus Street, Brighton
1
For the six month period to 30 September 2019 - 20 November 2019 - uandiplc.com
+ Flexibility in pipeline and projects, with   + Phase 1 of £1.4bn GDV Mayfield,   + Reflecting market decline in        + At 2.4 pence (H1 2019: 2.4
  potential to deliver gains (e.g. Harwell)      Manchester scheme in October;       retail sector property values (H1     pence)
                                                 planning also submitted at          2019: -2.6%*)
                                                 Newtown Works, Broke Hill Golf
                                                 Course and Tunbridge Wells

        *including share of JVs
    2
For the six month period to 30 September 2019 - 20 November 2019 - uandiplc.com
+ Giving WIP monetisation,          + C.£24m of assets under offer post H1;     + C.£1m annualised overhead reduction in + Continue to target £35-45m of gains
  substantial profits and             up to £175m potential assets identified     H1; clear path to deliver a total of c.£4m   in FY 2020
  Development Management fees         through transfer of U+I’s own high          of annualised savings by FY 2022
  to c.£6.5m per annum by FY 2022                                                                                            + The Board is confident in U+I’s plans
                                      quality development assets                + Marcus Shepherd appointed CFOO to            for the full year
                                                                                  drive forward efficiencies strategy

  3
For the six month period to 30 September 2019 - 20 November 2019 - uandiplc.com
Politicised; under-resourced        Impact of Brexit and election on activity levels      Affecting decision making

    Engage with all stakeholders from             Strong cross-party relationships –       Operating in geographies with
    outset to design schemes with                 projects help towards policies to        greatest need
    local communities at their heart              support communities
                                                                                           Our schemes are targeted at mid-
    Trusted relationships support                 Demand for housing and mixed-            market, where there is the
    repeat business                               use regeneration is growing – high       greatest shortfall
                                                  on the political agenda
    Mixed-use schemes appealing to
    wide range of demand                          Our size and flexibility means we
                                                  can respond quickly to change
    Use of Planning Performance
    Agreements to provide additional              Geographic diversity, including
    resources to Local Authorities                Ireland

4
For the six month period to 30 September 2019 - 20 November 2019 - uandiplc.com
5   Dirt Factory, Mayfield & Co, Manchester
For the six month period to 30 September 2019 - 20 November 2019 - uandiplc.com
H1 2020                   H1 2019*                    FY 2019*
Development and trading gains                                                                                      £3.6m                     £12.8m                      £42.8m
Basic net asset value (NAV)                                                                                    £327.0m                     £356.2m                     £360.1m
Basic NAV per share                                                                                                  263p                        284p                        289p
(Loss) / profit before tax                                                                                  (£23.9)m**                       (£4.2)m                       £6.3m
Basic (loss) / earnings per share                                                                                (18.3)p                       (3.5)p                         4.2p
Dividend per share (in respect of period reported)                                                                   2.4p                         2.4p                        5.9p
Supplemental dividend per share declared                                                                                   -                           -                      4.1p
Net debt                                                                                                       £154.1m                     £118.7m                     £139.0m
Gearing                                                                                                           47.1%                       33.3%                       38.6%
 * U+I changed its financial year end to 31 March in 2019
** Loss mainly reflects gains of £3.6m, a reduction of £9.2m compared to 31 August 2018, £5.8m Investment Portfolio valuation decline and £6.5m impairment of a development asset

6
For the six month period to 30 September 2019 - 20 November 2019 - uandiplc.com
Target                 H1 2020           H2 2020
Project                                                                                                                       Progress in H1 2020 and value trigger
                                                     FY 2020 gains               Actual           Guidance
                                                                                                                H1 progress: fitting out first floor as Cat A office space; marketing
                                                                                                                campaign underway.
Arts Building, London                                   £8-10m                      -               £6-8m       Revised range to reflect market conditions.
                                                                                                                Value trigger: completion of refurbishment, letting and subsequent
                                                                                                                sale.
                                                                                                                H1 progress: submitted for planning.
Newtown Works, Ashford                                   £5-7m                      -               £5-7m       Value trigger: surplus arising from either development of the site or
                                                                                                                refinancing of the site post planning.
                                                                                                                H1 progress: Inquiry commenced on 5 November, completed on 15
                                                                                                                November.
Kensington Church Street, London*                        £4-6m                                      £4-6m
                                                                                                                Value trigger: surplus arising from either development of the site or
                                                                                                                refinancing of the site post planning decision.
                                                                                                                H1 progress: built first turbine; pursuing accreditation.
Hendy Wind Farm, Wales                                   £4-6m                      -               £4-6m       Value trigger: accreditation under Ofgem’s RoC scheme and
                                                                                                                forward sale.
                                                                                                                H1 progress: finalising revised planning application.
Rhoscrowther Wind Farm, Wales                            £1-3m                      -               £1-3m
                                                                                                                Value trigger: planning and sale.
                                                                                                                Progress: decision taken to recapitalise JV. Phase 1 Marketing
Harwell, Oxfordshire*                                 undisclosed                   -            undisclosed    commenced.
                                                                                                                Value trigger: complete recapitalisation.
                                                                                                                H1 progress: ongoing activities to drive forward gains target.
Other smaller projects                                  £13-15m                  £3.6m             £12-14m      Value trigger: various smaller projects individually contributing
For the six month period to 30 September 2019 - 20 November 2019 - uandiplc.com
H1 2020                           FY 2019
                                                                                                                                              £m                                £m
Gross debt                                                                                                                                  170.4                             179.8
Cash                                                                                                                                          (16.3)                               (40.8)
Net debt                                                                                                                                      154.1                                139.0
Gearing                                                                                                                                      47.1%                            38.6%
Share of net debt in joint ventures                                                                                                            109.2                                87.3
Net debt including joint ventures                                                                                                              263.3                               226.3
Gearing including joint ventures                                                                                                           80.5%*                             62.8%

Analysis of gross debt (excluding JVs)
Fixed rate                                                                                                                                   62.4%                             64.2%
Capped / SWAP                                                                                                                                23.9%                             22.5%
Floating rate                                                                                                                                13.7%                             13.3%
Weighted average interest rate                                                                                                                 4.7%                                4.6%
Weighted average maturity                                                                                                                5.9 years                         6.2 years
    * Reflecting completion of the office refurbishment programmes in Dublin, now being let, and the pre-sold residential development joint venture at Circus Street in Brighton
      Main investment facility has approximately 20% valuation headroom (LTV covenant 75% vs 61.8% actual)

8
For the six month period to 30 September 2019 - 20 November 2019 - uandiplc.com
£m 70

       60

       50                            41.7

       40

                                                                                                                                                                 65.4
       30
                                  ❷
            ❶
                5.0
                                     16.8
       20

       10    20.3
                                              ❸
                                     13.4
                                                  9.5

        0
            Mar-20      Mar-21     Mar-22      Mar-23      Mar-24     Mar-25      Mar-26     Mar-27        Mar-28       Mar-29   Mar-30       Mar-31   Mar-32   Mar-33

                                        Drawn Investment             Drawn Development                Paid-off post period end            Corporate

            ❶ Development debt at Bromley being repaid from sales. £17.4m repaid year to date; all will be repaid by March 2020 from forecast sales
            ❷ Arts Building
            ❸ White Heather and Dublin Industrial Estates

9
For the six month period to 30 September 2019 - 20 November 2019 - uandiplc.com
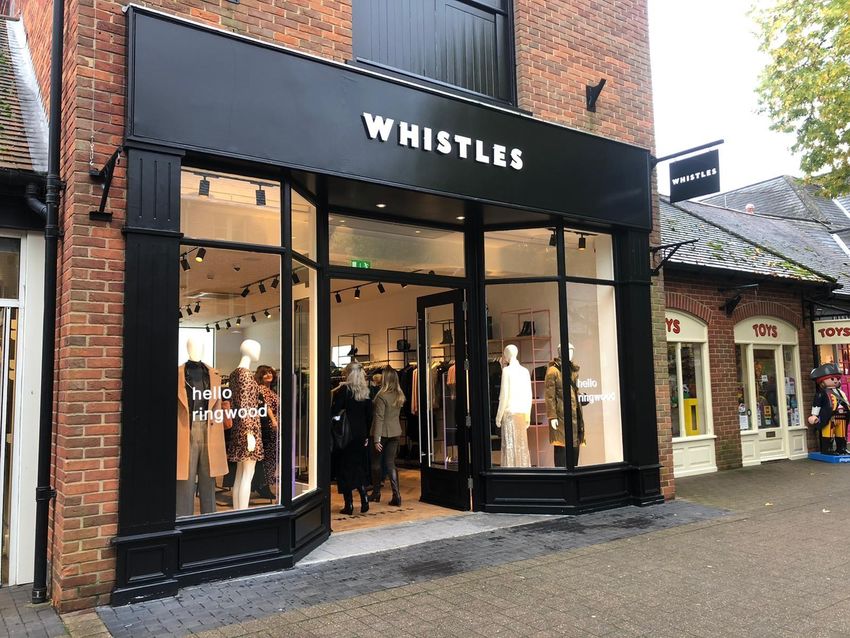
Reviewed our operations from top to bottom               Reduce number of legacy/small projects as we move       More efficient cost base
     Implemented new finance and back office systems          from 55 to 22 (excluding new project wins)              Right talent with right infrastructure
     and processes to streamline how we work                  Natural reduction in volume related back office costs   20% recurring overhead reduction over three years
     Identified plan to deliver c.£4m of annualised savings   Continuing reduction in corporate marketing             Greater efficiencies in procurement
     within 3 years to March 2022 (20% of cost base)          Constant review of all corporate costs for value for
     In H1 2019 actioned c.£1m annualised savings (5%         money, including premises and all corporate advisors
     of cost base)

10
11   St Mark’s Square, Bromley
12
13
Excellent progress on Mayfield in H1
     GDV increased to £1.4bn – mass and
     efficiency improved
     Detailed planning submission –
     300,000+ sq.ft. commercial
     development; major new park; public
     realm; multi storey car park

14                                          Mayfield, Manchester
Manchester occupier demand strong
     Construction start: summer 2020

     Major leasing targeted 2020
     Planning decisions on c.£2.7bn GDV
     imminent – Mayfield, 8 Albert
     Embankment, Landmark Court,
     Kensington Church Street, Tunbridge
     Wells

15                                         Mayfield, Manchester
Significant planning activity in H1
     Submission for 1,000 homes at Broke
     Hill Golf Course
     Two imminent submissions totalling
     £1bn GDV (Westminster Industrial
     Estate, Morden Wharf)
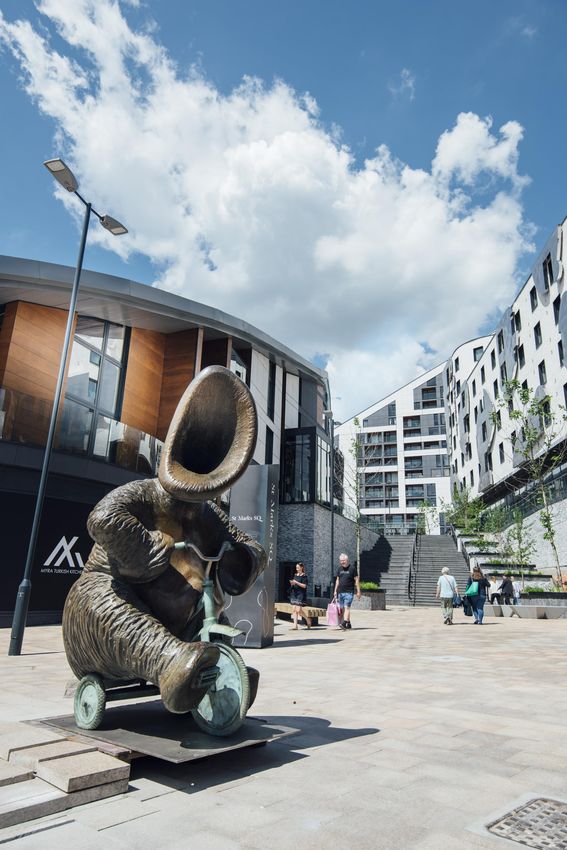
     Excellent progress on Morden Wharf
     in H1 – £840m GDV world-class
     scheme; one of the last Thameside
     opportunities on Greenwich
     Peninsular. Target consent in 2020

16                                         Morden Wharf, Greenwich
17        Airport House, Croydon
     17     Airport House, Croydon
3.2% capital value decline (including
     share of JVs)
     Core portfolio initial yield 7.0% (H1 19:
     6.6%)
     C.80% of portfolio delivered largely flat
     capital value performance
     Low average rate per square foot of
     £13.05
     Occupancy resilient at 91.5%
     No CVA impact in H1

18                                               New Whistles store opened, The Furlong Shopping Centre, Ringwood
Planning permission secured at Swanley;
     marketing commenced in October for sale
     of residential component

     C.£24m assets under offer post H1 at
     overall premium to September 2019
     valuation

19                                             Swanley Shopping Centre CGI, Swanley
Identified up to £175m of regeneration assets.
     Transfer >£50m of development assets          Optionality over quantum transferred
     into investment portfolio in next two
     years, with four already identified and
     being assessed
     Build more dynamic portfolio of           Generating superior rental and capital growth
     experiential and innovation space
     assets in our core geographies where
     demand remains strong

                                                 More diversified income streams; reduced
                                                         focus on traditional retail

                                                 Greater efficiency in both acquisition and
                                                         management processes

20
21   The Hive, Dublin
Confident for the future and delivering
sustainable long-term returns for
shareholders.

22
23
To deliver sustainable returns to our shareholders and long-term socio-economic
                                                 benefits for the communities in which we work

       Focus on attracting and
      retaining talent. Maintain                                                      Focus on regeneration
                                                                                                                 Focus on maintaining           Focus on maintaining a
          trusted partnership                                                        and asset management
                                                                                                                balance of PPP, Trading           strong and efficient
        relationships to deliver                 Focus on fewer, larger              projects in core markets
                                                                                                                and Investment projects         balance sheet alongside
      projects that benefit the                 projects others can’t do               that can collectively
                                                                                                                to deliver 12% average           a clear capital returns
      communities in which we                                                       deliver >£50m gains every
                                                                                                                    post tax returns                     policy
                 work                                                                           year

                                              average per annum target                                                         average post tax per annum target

                                                                                                 GEARING

                                                                                                 40-50%
                                             average per annum target                                                  on balanceonsheet
                                                                                                                                     balance
                                                                                                                                          andsheet
                                                                                                                                              50-60%and 50-60%
                                                                                                                                 including
                                                                                                                       including our shareour  share of joint
                                                                                                                                           of joint
                                                                                                                                 venture
                                                                                                                       venture debt      debt

     * Total return comprises NAV growth including dividends paid to shareholders
24
32%                       42%                                                         26%
     Of gross assets*          Of gross assets*                                            Of gross assets*

     £191.1m**                 £254.3m**                                                   £156.0m
     Capital value***          Capital value***                                            Capital value***

     2.0x-5.0x                 1.5x
     Equity multiple           Equity multiple
                                                                                                             Delivers
                        Delivers
                                                                                                          Income return
          Longer-term development profit
                                                                                                          Capital growth
             Shorter-term trading profit
                                                                                                 Future development opportunities
       Elements of completed developments
        retained within investment portfolio
                                                                                                             Key value drivers
                   Key value drivers                                                                       Asset management
                                                                                                             Planning gain
                    Planning gain
                Arbitrage / mispricing
                Development margin                                                                             HY 2020 KPIs
                                                                                                   £147.1m portfolio (directly held)
                     HY 2020 KPIs
                       £3.6m profit
25
     *Group share where appropriate
     **Assets held at cost, not revalued                                                  All figures as at 30.09.19
     ***Capital value includes all property interests held both directly and indirectly
U+I is driven by a purpose to deliver great places which by definition deliver huge socio-economic gain with world-class
     sustainable regeneration. We therefore have an immediate opportunity to deliver superior ESG performance

     U+I creates sustainable value in three ways:
       Our places
       Our buildings
       Our people

     U+I is delivering best in class sustainable developments through its places and buildings and also through its people and
     supplier relations

     Data is being collected during FY 2020 as major projects move onto site. This data will allow us to baseline our
     performance and present a compelling case that will support U+I’s ambition to be best in class against ESG criteria

26
Region,                        Profit Range,               Planning          Rates
Scheme                    Acqn Date             GDV      U+I Equity      Timeframe   Status            (psf)           Scheme details

Cambridge Northern     London City Region,      £3bn     £20-30m,        2024-2037   Pre-planning      Resi: £500      120 acres; 5,000+ residential units, c.500,000 sq.ft.
                                                                                                                       office/employment space, 200,000 sq.ft. leisure, retail and community
Fringe East, Cambridge July 2018                         £5m                                           Office: £35
                                                                                                                       space.
                                                                                                       Retail: £25

Mayfield, Manchester* Manchester,               £1.4bn   £40-60m,        2021-2030   Pre-planning      Resi: £400-450 24 acres; 1,500+ residential units, 2.3m sq.ft. GIA office space; 650
                      December 2016                      £20m (max)                  Phase 1           Office: £28-35 bed hotel, retail and leisure space, 6.5 acre public park and an
                                                                                                                      additional 6.5 acres of public realm.
                                                                                     Submitted: 2019   Retail: £25-40

Morden Wharf,             London City Region,   £840m    £15-20m,        2020-2022   Pre-planning      Resi: £700-900 19 acres; 1,500 residential units, 30,000 sq.ft. offices plus c.200,000
Greenwich                 March 2012                     £16m (max)                  Submit: 2020      Office: £30    sq.ft. other uses.
                                                                                                       Retail: £20

Harwell, Oxfordshire*     London City Region,   £565m    £5-12m,         2019+       Part secured, part Resi: £350-400 1.5m+ sq. ft. mixed-use commercial accommodation, up to 1,000
                          December 2013                  £10m                        pre-planning       Office: £35+   residential units.
                                                                                                        Hi-tech: £18

8 Albert Embankment,      London City Region,   £500m    £25-35m,        2020-2025   Pre-planning      Resi: £1,517    2.6 acres, 443 residential units, hotel, 85,000+ sq.ft. office, fire station
Lambeth                   August 2016                    £15m (max)                  Submitted: 2019   Office: £56     & museum, gym and retail.
                                                                                                       Retail: £25

Landmark Court,           London City Region,   £240m    £10-15m,        2019-2024   Pre-planning                      1.7 acres; 200,000 sq.ft. of office space, retail, workspace and new
                          December 2017                  £7m (max)                   Submitted: 2019                   homes. Conditional JV agreement signed with public sector partner.
Southwark

The Future Works,         London City Region    £210m    £4-8m,          2019-2024   Secured           Office: £36     3 acres; 350,000 sq.ft. of office accommodation being delivered in
Slough                    December 2009                  £8m (max)                                                     three phases.

Preston Barracks,         London City Region,   £200m    £2-5m,          2019-2023   Secured                           5 acres; 369 residential units, 50,000 sq.ft. offices, 555 student beds
                          July 2014                      £3m (max)                                                     and ancillary retail.
Brighton

Circus Street, Brighton London City Region,     £130m    £6-10m,         2019-2020   Secured           Resi: £575      2.4 acres; 142 residential units, 50,000 sq.ft. of office space, 450
                        April 2008                       £12m (max)                                    Office: £35     student bed accommodation (completed), 10,000 sq.ft. of ancillary
                                                                                                                       retail space and 14,000 sq.ft. dance space.
                                                                                                       Retail: £35

 *Held in joint venture

 27
GDV /
                                   Region,           land    Profit Range,                Planning              Rates
Scheme                             Acqn Date         value   U+I Equity      Timeframe    Status                (psf)            Scheme details

Kensington Church Street, London London City         £300m   £4-6m           2019-2020    Planning inquiry      -                43 residential units, 40,000 sq.ft. offices, 30,000 sq.
                                 Region,                     £10m (max)                                                          ft. retail.
W1*
                                 March 2011

Newtown Works, Ashford             London City      £20m     £5-7m           2020         Pre-planning          -                12 acres, film and studio floorspace, residential,
                                   Region, December          £2.6m                        Submitted: 2019                        hotel, quality public realm.
                                   2018

White Heather Industrial Estate,   Dublin, December €25m     €11-13m         2022         Pre-planning          Resi: €325 psf   2.8 acres, potential to rezone for residential use in
                                   2018                      €6m                                                                 next City Plan in 2022.
Dublin 8

Arts Building, London N4           London City       £35m    £6-8m           2019 -2020   N/A                   £390 psf on      c.50,000 sq.ft. of office building, part-let, part
                                   Region, January           £6m                                                acquisition      vacant. Reconfiguration works underway
                                   2019

Pincent’s Hill, Reading            London City       £15m    £5-10m          2022         Planning submitted    Resi: £315 psf   48 acres, 275 residential units.
                                   Region,                   £5m (max)                    February 2019
                                   April 2008
Kent Wool Growers, Ashford         London City       £60m    £2-3m           2020         Resolution to grant   Resi: £350 psf   3 acres, 250 residential units. In the market.
                                   Region,                   £4m (max)                    planning
                                   January 2018

*Held in joint venture

 28
Number of assets*            Valuation change (inc. JVs)   Size of portfolio           Initial Yield*

     31 March 2019: 19            31 March 2019: (£8.8)m        31 March 2019: £154.0m      31 March 2019: 6.6%

                                  Capital loss                                              After expiry of rent free periods

 Weighted unexpired lease term*   Estimated Rental Value*       Void rate*                  Equivalent Yield*

 31 March 2019: 8.8 yrs           31 March 2019: £13.1m         31 March 2019: 7.3%         31 March 2019: 7.9%

              WAULT to break*
 31 March 2019: 7.7 yrs                                         On shopping centre assets

*Core portfolio only                                                                               Figures as at 30.09.19 on a like for like basis

29
Project name                           Overview                                                        Key statistics
     Airport House, Croydon                 Serviced office building                                        Valuation: £12-18m
                                                                                                            Valuation change: ↔
                                                                                                            Running yield: 6.5%
                                                                                                            WAULT: 3.0 years
                                                                                                            ERV growth: 1%
                                                                                                            Average rent psf: £43.43

     The Furlong Shopping Centre,           Retail centre anchored by Waitrose (not owned)                  Valuation: £10-15m
     Ringwood                                                                                               Valuation change: ↔
                                            Key tenants: AGA; Café Nero; Oasis; Crew Clothing; Fat
                                                                                                            Running yield: 7.3%
                                            Face; Holland & Barrett; Joules; Phase Eight; Waterstones,
                                                                                                            WAULT: 4.9 years
                                            Osprey, Whistles
                                                                                                            ERV growth: 0.6%
                                                                                                            Top Zone A rent: £77

     Swanley Shopping Centre, Kent          Retail centre anchored by Wilkinson, Costa, Poundland,          Valuation: £10-15m
                                            Barclays, Boots, KFC and Subway                                 Valuation Change: ↔
                                                                                                            Running Yield: 8.8%
                                                                                                            WAULT: 5.4 years
                                                                                                            ERV growth: 0%
                                                                                                            Top Zone A: £45

     Waterglade Retail Park, Clacton-On- Retail park comprising B&M, Halfords, Iceland, Carpetright         Valuation: £10-15m
     Sea                                 and Next                                                           Valuation change: ↔
                                                                                                            Running yield: 5.7%
                                                                                                            WAULT: 6.3 years
                                                                                                            ERV growth: 0%

     St Peter’s Quarter, Bournemouth        Retail centre anchored by JD Wetherspoon, TK Maxx, King’s       Valuation: £10-15m
                                            Colleges Limited, Day’s Restaurant, STA Travel, Flight Centre   Valuation change: ↔
                                                                                                            Running yield: 7.8%
                                                                                                            WAULT: 9.6 years
                                                                                                            ERV growth: 0%

30
As at 30 September 2019                                   As at 31 March 2019

     Occupier                  Annual rent   % of              Occupier                  Annual rent   % of
                               £m            contracted rent                             £m            contracted rent
     Matalan Retail            0.5           4.7               Matalan Retail            0.5           4.7

     Sainsbury’s Supermarket   0.5           4.2               Sainsbury’s Supermarket   0.5           4.2

     Ricardo-Aea               0.5           3.8               Ricardo-Aea               0.5           3.9

     B&M Retail                0.4           3.2               B&M Retail                0.4           3.2

     Carpetright               0.3           2.7               Carpetright               0.3           2.7

31
300
     £m

          290   288.7            4.1

                                             284.6         0             0.2            4.5

                                                                                                      2.3
          280
                                                                                                                     7.3

                                                                                                                                   4.8
          270
                                                                                                                                                0.9      0.7        3.5

                                                                                                                                                                              262.5

          260

          250

          240
                  NAV        Supplemental   Adjusted   Investment       Gain on       Property     Development     Operating   Net interest   Taxation   Other   Final 2019     NAV
                April 2019     Dividend      NAV         portfolio    disposal of   revaluations     & trading      costs        costs                            Dividend    Sep 2019
                                 2019                  contribution   investment                    contribution
                                                                        assets

32
£m   400                                                                                                                                                                                  80%
                                                                                                                                   379.3

                                                                 363.3                                                                             356.2           360.1
                                                                                                   347.6
          350                    346.4           342.9                                                             340.5                                                                       70%
                335.5                                                            340.5
                                                                                                                                                                                   327.0

          300                                                                                                                                                                                  60%

          250                                                                                                                                                                                  50%

                                                         203.3
          200                                                                                                                                                                                  40%

                                                                         161.4                                                                                                         154.1
                        150.7
          150                                                                                                                                                              139.0               30%
                                                                                         128.0                             128.0
                                         125.7                                                             120.9                           119.1           118.7

          100                                                                                                                                                                                  20%

           50                                                                                                                                                                                  10%

            0                                                                                                                                                                                  0%
                 Aug-14           Feb-15          Aug-15          Feb-16          Aug-16            Feb-17          Aug-17          Feb-18           Aug-18         Mar-19          Sep-19

                                                                 Net assets (LHS)                Net debt (LHS)             Gearing excl JVs (RHS)
                           *On Balance Sheet

33
This presentation has been prepared by U and I Group PLC (the              apparent. Past performance is not indicative of future results and
“Company”). No representation or warranty (express or implied) of          forward-looking statements are not guarantees of future
any nature is given nor is any responsibility or liability of any kind     performance.
accepted by the Company or any of its directors, officers,
employees, advisers, representatives or other agents, with respect         This presentation is for information purposes only and does not
to the truthfulness, completeness or accuracy of any information,          constitute an offering document or an offer of transferable
projection, representation or warranty (expressed or implied),             securities to the public in the UK. This presentation is not intended
omissions, errors or misstatements in this presentation, or any            to provide the basis for any credit or other evaluation of any
other written or oral statement provided.                                  securities of the Company and should not be considered as a
                                                                           recommendation that any investor should subscribe for, dispose of
In particular, no responsibility or liability is or will be accepted and   or purchase any such securities or enter into any other transaction
no representation or warranty is or is authorised to be given as to        with the Company or any other person. The merits and suitability of
the accuracy, reliability or reasonableness of any forward-looking         any investment action in relation to securities should be considered
statement, including any future projections, management targets,           carefully and involve, among other things, an assessment of the
estimates or assessments of future prospects contained in this             legal, tax, accounting, regulatory, financial, credit and other related
presentation, or of any assumption or estimate on the basis of             aspects of such securities.
which they have been given (which may be subject to significant
business, economic or competitive uncertainties and contingencies          This presentation is being communicated or distributed within the
beyond the control of the management of the Company). Any such             UK only to persons to whom it may lawfully be communicated, and
forward-looking statements have not been independently audited,            has not been approved for the purposes of section 21 of the
examined or otherwise reviewed or verified.                                Financial Services and Markets Act 2000. It may not be reproduced
                                                                           (in whole or in part), distributed or transmitted to any other person
All views expressed in this presentation are based on financial,           without the prior written consent of the Company. In particular this
economic, market and other conditions prevailing as of the date of         presentation is not intended for distribution to, or use by, any
this presentation. The Company does not undertake to provide               person or entity in any jurisdiction or country where such
access to any additional information or to update any future               distribution or use would be contrary to local law or regulation. Any
projections, management targets, estimates or assessment of                recipients of this presentation outside the UK should inform
future prospects or any other forward-looking statements to reflect        themselves of and observe any applicable legal or regulatory
events that occur or circumstances that arise after the date of this       requirements in their jurisdiction, and are treated as having
presentation, or to correct any inaccuracies in this presentation          represented that they are able to receive this presentation without
which may become                                                           contravention of any law or regulation in the jurisdiction in which
                                                                           they reside or conduct business.

34
You can also read