Five years in: Assessing the impacts of Chicago's Large Lots Program - Measuring the effectiveness of Chicago's $1 residential lot sale program on ...
←
→
Page content transcription
If your browser does not render page correctly, please read the page content below
Five years in: Assessing the impacts
  of Chicago’s Large Lots Program

 Measuring the effectiveness of Chicago’s $1 residential
    lot sale program on crime and wealth-building

                   Matthew Stern
            Master’s Project – April 2019
       Department of City and Regional Planning
ii
Abstract
Since 2014, the City of Chicago has sold more than 1,200 city-owned vacant properties to same-block
landowners in the South and West sides for $1 each. This Large Lots Program is part of a national trend
in which cities encourage productive reuse of vacant land by heavily discounting the sale of empty lots in
distressed neighborhoods to local buyers. These experimental programs present opportunities for
marginalized communities such as wealth-building, crime reduction, and increased control of
neighborhood change processes. They also present risks and opportunity costs. Despite these trade-offs
vacant land disposition programs have been understudied and no published literature evaluates
whether programs actually achieve their stated goals. Using data from a variety of public and private
data sources I evaluate the impact of Chicago’s Large Lots program in three economically distressed
neighborhoods. I investigate who is buying Large Lots, how many parcels they are buying, and how far
they live from the parcels they are purchasing. Additionally, I perform a block-level difference-in-
differences analysis to explore whether the program reduces crime. Finally, I examine the potential
wealth generation affects for residents of low-income communities using a parcel-based projection of
land value changes.

Key Words
Shrinking cities; Legacy Cities; vacant land; side yards; Chicago; wealth-building;
difference-in-differences

Acknowledgements
Kyle Onda, PhD candidate in the Department of City and Regional Planning, helped me gain access to
and initially interpret ZTRAX data.

Dr. Bill Lester, my research advisor, was fundamental in guiding my perspective and analysis, and taught
me just about everything I know about statistics.

                                                                                                        iii
iv
Table of Contents
I.        Introduction .......................................................................................................................................... 1
II.       Literature & Policy Review .................................................................................................................... 2
      Shrinking cities and the foreclosure crisis................................................................................................. 2
      The stages and impacts of property distress ............................................................................................ 3
      Property distress, crime, and wealth ........................................................................................................ 4
      Review of vacancy management policies ................................................................................................. 5
      Vacancy and municipal sales of vacant lots in Chicago ............................................................................ 6
      Extant evaluations of vacancy management ............................................................................................ 9
III.          Research Strategy & Data Methods ................................................................................................ 10
      Research questions and analysis geography .......................................................................................... 10
      Data sources & dataset construction...................................................................................................... 11
IV.           Methodology................................................................................................................................... 15
       RQ1: Who is buying Large Lots parcels? ................................................................................................. 15
       RQ2: Do Large Lots sales reduce crime? ................................................................................................. 16
       RQ3: How much wealth is generated? ................................................................................................... 18
V.        Findings ............................................................................................................................................... 20
       Study area context .................................................................................................................................. 20
       RQ1: Who is buying Large Lots parcels? ................................................................................................. 21
       RQ2: Do Large Lots sales reduce crime? ................................................................................................. 27
       RQ3: How much wealth is generated? ................................................................................................... 31
VI.           Discussion & Policy Implications ..................................................................................................... 36
VII.          Conclusion ....................................................................................................................................... 38
Bibliography ................................................................................................................................................ 40
Appendix A: Stata log of ZTRAX Interpretation program ............................................................................ 45
Appendix B: Detailed Data Assembly and GIS Methodology ...................................................................... 60

                                                                                                                                                                   v
Table of Figures
Figure 1: Population in Chicago and its metropolitan region ....................................................................... 6
Figure 2: Residential Land vacancy in Chicago.............................................................................................. 7
Figure 3: Large Lots eligible buyers ............................................................................................................... 8
Figure 4: When Large Lots sales occurred .................................................................................................. 14
Figure 5: Blockface capture design ............................................................................................................. 15
Figure 6: Distribution of the incidence of crime and log crime in blockface-periods ................................. 17
Figure 7: Distribution of independent and dependent variables over entire crime panel ......................... 18
Figure 8: Source of lot size data by neighborhood for residentially zoned vacant parcels ........................ 19
Figure 9: Parcels purchased by buyer type ................................................................................................. 22
Figure 10: Visualizing the distance between buyers and their parcels....................................................... 24
Figure 11: Buyer-Parcel distance by Large Lots phase ................................................................................ 25
Figure 12: Buyer-Parcel distance by buyer type ......................................................................................... 26
Figure 13: Distribution of sales by buyer mailing address .......................................................................... 26
Figure 14: Pre-Large Lots vacancy and crime correlation ........................................................................... 28
Figure 15: Reductions in crime by buyer distance from parcel, negative binomial regressions ................ 30
Figure 16: Count of parcels in “same neighborhood” and “less than 10,000 feet” distance classifications,
by buyer-parcel distance............................................................................................................................. 30
Figure 17: Crime over time: No sales, Any Sales, and In-Neighborhood Sales ........................................... 31
Figure 18: Wealth generation by model and buyer typologies .................................................................. 33
Figure 19: Average vacant land sale prices over time ................................................................................ 34
Figure 20: Average vacant land sale prices per square foot over time, with forecasts .............................. 35
viTable of Tables
Table 1: Regulations of Chicago’s ANLAP and Large Lots Program .............................................................. 9
Table 2: Large Lots Program and Analysis Subset ....................................................................................... 11
Table 3: Data and Sources........................................................................................................................... 12
Table 4: Parcel Status .................................................................................................................................. 13
Table 5: Blockfaces included in panel for Research Question 2 ................................................................. 14
Table 6: Incidence of non-zero crime observations by type ....................................................................... 17
Table 7: Size and vacancy rates by study area ............................................................................................ 20
Table 8: Typology of buyers per Large Lots phase ...................................................................................... 21
Table 9: Buyers by number of lots purchased ............................................................................................ 23
Table 10: Distribution of sales by buyer mailing address ........................................................................... 27
Table 11: Pre-Large Lots vacancy and crime correlation regression output .............................................. 28
Table 12: Crime Panel – OLS Regression Output ........................................................................................ 29
Table 13: Crime Panel – Negative Binomial Regression Output ................................................................. 29
Table 14: Four models of Large Lots wealth generation ............................................................................ 32
Table 15: Wealth generation by model and buyer typologies ................................................................... 33
Table 16: Forecast of value generated by the Large Lots Program in 2020 and 2025 ............................... 34
viiviii
I.    Introduction
Urban land vacancy is both a problem and an opportunity. Decades of urban shrinkage and the recent
foreclosure crisis have contributed to high levels of urban vacancy that decrease tax revenue, increase
municipal costs, wreak havoc on real estate markets, and have been linked to increased crime. On the
other hand, extreme vacancy also presents a canvas on which planners and communities can
experiment with visionary new neighborhood designs (e.g. “greening” and urban agriculture), find space
for the construction of affordable housing, and increase family wealth in low-income communities. In
Chicago, with a booming real estate market overall but south- and west-side submarkets defined by
extreme vacancy and disinvestment, this duality is clearly visible.

In Chicago and elsewhere, extreme vacancy is geographically bound up with race and class, and often
dates back to red-lining and mid-century urban renewal. Therefore, questions about the consequences
of vacancy and the actions taken to address it have impacts not only on municipal finances and
neighborhood quality generally, but on our cities’ most vulnerable communities specifically. The ideal
policy solution to extreme urban vacancy would create safer, more vibrant communities; restore a
functional market for land; and increase the tax base. It would also be co-designed with the
communities that have experienced decades of disinvestment, so that they can both steer the process
of neighborhood change and benefit from the development and improved property values that result.

These were, in brief, the goals of the City of Chicago’s Large Lots program when it was founded in 2014.
The program made vacant, city-owned, residentially-zoned parcels available for sale to non-delinquent
same-block landowners for $1. According its organizers, the Large Lots program sought to “return
property to the tax rolls…allow local residents to have greater control over vacant land in their
neighborhood, create wealth… increase safety, build community, and raise home values” (ChiHackNight
2017). At the end of 2017, the City had sold 1,248 parcels through the program via five neighborhood-
specific pilots and one city-wide expansion. Local journalists and bloggers have captured stories of lots
converted into playgrounds and gardens (Koski 2015), and then-Mayor Rahm Emmanuel put his support
behind the expansion of the program (Spielman 2016). However, no evaluation of the program has been
published.

Chicago’s Large Lots program is one of many similar programs across the country. New Orleans,
Cleveland, Buffalo, St. Louis, and Detroit are among the cities that make vacant land available to citizens
through side yard programs, usually heavily discounted and restricted in some way to the local
community. The few studies that have analyzed these programs tend to focus on measures of how
successful cities have been at implementing them (Dewar 2006; Ganning and Tighe 2015; Dewar 2015),
rather than the impacts of the programs themselves. I have located no published studies that measure
the impact any vacant land disposition program against the goals described in the first paragraph. 1

This study seeks to rectify this gap in scholarship by answering three questions about Chicago’s Large
Lots program. First, who is purchasing parcels? I use data from the Zillow ZTRAX real estate transactions
database that suggests that 13.5% of parcels are bought by purchasers who buy more than 2 parcels per

1
 Ongoing research at UIUC in partnership with the US Dept. of Agriculture is documenting what buyers of Large
Lots parcels in Chicago are doing with their land (ChiHackNight 2017). Although they have not yet published their
work, they have recently presented in conference proceedings (Gobster et al. 2018).

                                                                                                                    1
program round, in violation of city policy; up to 28% of buyers may not live on the block where they are
purchasing, and at least 7% of buyers appear to be professional developers. Second, what is the impact
of large lots sales on crime? I combine data from the Chicago Department of Planning and Development,
the Zillow ZTRAX database, and the Chicago police department to demonstrate that the presence of at
least one Large Lots sale on a block reduces crime by between 2.9% and 6.5%. Third, how much wealth
might these property transfers be potentially creating? I run models based on multiple data sources to
demonstrate that Large Lots program activity in three neighborhoods has generated between $16 and
$83 million in wealth, and could generate as much as between $97 and $214 million by 2025. Based on
these findings I suggest that the Large Lots program is quite effective but could be improved by placing
some additional limitations on buyer eligibility and collecting more information from applicants to
better inform the aldermen who approve and deny applications.
This paper begins with a review of the literature applicable to this study, vacancy management policies
used in cities around the country, and a history of vacancy and vacancy management in Chicago in
particular. Then, in section 3, I explain and motivate my research questions and document the data
sources and dataset construction methods that underpin the analysis. In section 4 I detail the
methodology used to answer the three research questions and, in section 5, I review general
information about the study areas for context, and the findings for each research question. Finally I
discuss the implications of critical findings and make concluding remarks.
II. Literature & Policy Review
Shrinking cities and the foreclosure crisis
Many American cities in the northeast and Midwest have been shrinking over the last half century. In
the 1950s, 29 cities (including 8 of the country’s largest 10) experienced peak population; another 66
peaked in the ‘60s and ‘70s (Mallach 2017). Scholarship on that shrinkage—and how planners should
respond to it—was slow to develop because the American fixation on growth limited discourse on
decline and because discourse that did exist was problematically intermingled with conversations about
race, decay, and deindustrialization in the urban crisis dialogue (Dewar 2006; Mallach 2017).
In more recent years, scholars have more carefully inspected this shrinking cities trend, seeking to
“measure changes, where they are, what has caused the decline, what they represent, and how
planning efforts can resolve attendant problems” (Hackworth 2014, 6). Frequently cited causes for
urban shrinkage include deindustrialization, suburbanization, and natural demographic change
(Großmann et al. 2013); post World War II job losses in cities (Dewar 2006); “the decreasing ability of
cities to annex, migration to the Southwest and West, and the spread of automobile ownership”
(Beauregard 2001, 130); and white flight (Mallach 2017). Twentieth century federal government policy
and programs such as HOLC red-lining maps, the suburban focus of new federal home mortgage
insurance products, investment in highway construction, and urban renewal are accepted by many as
partially or mostly responsible for this trend (e.g. Jackson 1985), although Beauregard (2001) refutes
these claims.
Urban shrinkage has created issues of mass vacancy and property distress, which have been shown to
have a variety of negative effects including declining property tax revenues, blight, decimation of real
estate markets, decreased liquidity and equity for surviving nearby homeowners, and increased crime.
More recently, home foreclosures following the sub-prime mortgage crisis in the late 2000’s have
2provided a new source of urban vacancy (Ellen, Lacoe, and Sharygin 2013; Cui and Walsh 2015; Mallach
2018). These challenges disproportionately plague communities whose residents are predominantly
poor and non-white (Immergluck and Smith 2006; Schilling and Logan 2008). The resulting concentration
of vacancy is therefore both a “symptom and a disease” of poverty and de facto segregation (Schilling
and Logan 2008, 452; Butler 2016).
Shrinkage and extreme vacancy are also widely recognized as creating a range of opportunities, and
scholars and practitioners engaged with shrinking cities are exploring how to utilize them (e.g. Pagano
and Bowman 2000; Schilling 2002). Vacant properties can be converted into community assets via land
banking (Tappendorf and Denzin 2011), greening (Schilling and Logan 2008), or the construction of
affordable housing (Kelly 2016); they can be used as wealth-building mechanisms in communities hard-
hit by decades of disinvestment; and they present unique opportunities to experiment with innovative
urban design. Related to this is an active wider conversation about what the right size of a city is and
should be and how to go about achieving it (Hummel 2015).
The stages and impacts of property distress
Vacancy is a label that applies to certain conditions within an interrelated ecosystem of property
distress. Tax and mortgage delinquency can lead to foreclosure and/or property abandonment as well as
the creation of zombie properties that have no clear owner or title. In healthy real estate markets,
private capital will see opportunity in these conditions and a new owner will restore the property to
productive use (Mallach 2011; Kelly 2016). In weaker markets, however, these properties frequently
remain vacant for extended periods of time, generating blight as well as dangerous conditions as
structures begin to decompose (National Vacant Properties Campaign 2005; Butler 2016; Kelly 2016).
Such properties are not only the result of weak markets but are also causes of them as their presence
impacts surrounding land value through poor appearance and a surplus of supply (Schilling and Logan
2008). Property abandonment and declines in land valuation both depress property tax revenues and,
where ownership and/or responsibility for upkeep fall to cities and counties, municipal expenditures are
increased (Mallach 2018). These self-reinforcing effects together create a cycle of decreasing value and
increasing costs difficult for cities, neighborhoods, and remaining residents to recover from. The result is
often extreme levels of geographically clustered vacancy which have fundamental impacts on the
physical, social, and economic fabric of neighborhoods. Alan Mallach calls this effect hypervacancy, a
label he assigns to any geography experiencing a vacancy rate of over 20% (Mallach 2018, 5).
Additionally, a significant distinction exists between vacant structures (in which an unused structure
exists on a lot) and vacant land (in which no structure exists). In cities and neighborhoods that have
experienced large-scale population loss and a decimation of demand, land vacancy is often achieved
through intentional demolition—the final step of the disinvestment cycle (Whitaker and Fitzpatrick IV
2013). This demolition is frequently financed with public dollars on properties that have fallen into local
government control and is performed in an attempt to decrease the public costs and negative
externalities of the vacant structures (Frazier, Bagchi-Sen, and Knight 2013; Mallach 2011). However,
scholars have argued elsewhere that demolition simply “replace[s] one problem with another”
(Goldstein, Jensen, and Reiskin 2001, 7), and that it is a neoliberal “spatio-temporal fix” for uneven
disinvestment and the foreclosure crisis (Rosenman and Walker 2016275). Regardless, demolition is
always the first step towards converting vacant properties to green space (Hummel 2015; Schilling and
Logan 2008) and publically-funded demolition is frequently a mandatory ingredient for any positive
3reuse where structures have fallen into extreme disrepair in low value neighborhoods (Kelly 2016,
1028).
Property distress, crime, and wealth
The negative impacts of various stages of property distress on neighborhood health have been
thoroughly studied. This section reviews existing scholarship measuring impacts on crime and wealth,
the two outcome variables utilized in this paper. The methods and findings of these studies underpin the
analysis herein.
The range of theoretical connections between property distress and crime are well reviewed in recent
literature (see for example Arnio, Baumer, and Wolff 2012; Ellen, Lacoe, and Sharygin 2013; Cui and
Walsh 2015; Spader, Schuetz, and Cortes 2016; Twinam 2017). These theories include links between
crime and physical deterioration; the absence of eyes on the street (Jacobs 1961); routine activity theory
(crime requires potential offenders, targets, and an absence of capable guardians; Cohen and Felson
1979); and broken windows (Wilson and Kelling 1982).
A growing body of research demonstrates these connections empirically. Ellen et al. (2013) provide a
robust analysis of foreclosures in New York City, using both ordinary least squares and negative binomial
difference-in-differences models to demonstrate significant causal linkages between the number of
properties in active foreclosure and crime at the blockface (a single city block) level. They find that each
additional foreclosure on a block leads to an uptick in crime between 0.7% and 1.4%. Building on Ellen et
al.’s work, Cui and Walsh (2015) study foreclosures and vacancy in Pittsburgh, Pennsylvania, by
comparing the number of crimes within a radius of each distressed property to a wider donut-shaped
control area, again with a D-in-D methodology. They find that increases in crime are driven by
foreclosure-associated vacancies (rather than foreclosures per se), and that longer vacancies lead to
greater increases in crime.
Some studies in this vein use Chicago as a proving ground: Twinam (2017) looks broadly at land use and
crime in the city, using an instrumental variable-informed circle and donut method. He finds that higher
density mixed-use areas experience less crime than the average residential area and that increasing
residential density is weakly correlated with decreased crime—both arguments suggest that repurposing
vacant lots could have positive neighborhood effects. Spader et al. (2016) seek to demonstrate that
demolishing or rehabbing vacant structures can reduce crime. Using data from Neighborhood
Stabilization Program projects in Chicago, Cleveland, and Denver, they also construct a D-in-D circle-in-
donut model; they find that demolitions reduce certain types of nearby crime in Cleveland but that this
impact lasts only four quarters; they report no significant results for Chicago or Denver.
Research has also connected property distress to decreased home values. Immergluck and Smith (2006),
again using a circle-and-ring methodology, find in a Chicago study that each foreclosure within 1/8 of a
mile of a given home reduces the value of that home by at least 0.9%. They also note that foreclosures
are more likely to occur in low-income census tracts and the effect of foreclosures in these tracts is
higher (1.4% decrease in price per foreclosure). Campbell et al. (2011) find that recent foreclosures
within a ¼ mile radius of a home decreases the natural log of its selling price by 1.7%, and for
foreclosures even closer (within 1/10 of a mile), the effect increases to 8.7%. Whitaker and Fitzpatrick
(2013) argue that foreclosures are actually a lagging indicator of property neglect and a non-
comprehensive predictor of vacancy; they use property tax delinquency as well as vacancy data from
4USPS in their analysis of distressed properties in Cuyahoga County, and find that within 500 feet of a
property for sale in low-income neighborhoods, the presence of vacant properties reduces sale price by
1.1%, tax delinquent properties by 2%, and vacant and delinquent properties by 4.6%.
Overall, this body of work contains compelling theoretical and empirical arguments in support of the
idea that concentrated property distress can have substantial impacts on neighborhood health. This
work implies (or demonstrates, as in Twinam 2017) that making city blocks more vibrant can have a
positive spillover effect on the lives of neighborhood residents. And yet, it is worth inspecting whether
attempts to do so actually have these predicted impacts. After all, as explained by Spader et al. (2016),
urban renewal, public housing development, and property demolition programs have all been motivated
by similar intentions, with mixed results.
Review of vacancy management policies
Because of the opportunities inherent in urban vacancy as well as the problems theoretically solved by
vacancy reduction, policies that encourage the productive reuse of vacant urban land have garnered
support from many corners. Advocates include those interested in equity and social justice, land-use
efficiency, and municipal fiscal health. In recent decades many cities have sought to encourage
redevelopment of vacant urban land. In this section, I review a non-comprehensive selection of such
programs to capture the diversity of extant policies.
In some cases, cities see municipally-owned vacant property primarily as an opportunity to expand their
stock of affordable housing. For example, beginning in the late 1980s, Portland, Oregon and Richmond,
Virginia both transferred ownership of city-owned vacant property to community development
corporations with the express direction that they establish affordable housing on the sites (Schilling
2002). More recently, since 2014 New York City has sold 200 lots to housing developers for $1 in
exchange for commitments to keep housing units affordable, often for between 20 and 60 years (596
Acres 2018).
Certain programs are designed to target specifically vacant and blighted structures. In the early 1990s,
San Diego, California found success working with owners of privately held vacant buildings, tightening
codes and changing enforcement practices while helping owners renovate, demolish, or sell (Schilling
2002). Buffalo, NY offers up derelict homes for $1 via their four-decade-old Urban Homesteading
Program; buyers must renovate them within 18 months and live in them for at least 36 (City of Buffalo
n.d.; Fahey 2015). During the recession, the federal Neighborhood Stabilization Program funded
demolition and rehabilitation of vacant homes in low-income neighborhoods hard-hit by the foreclosure
crisis in cities across the United States (Spader, Schuetz, and Cortes 2016).
A select few programs target non-homeowners specifically. Detroit, for example, administers the unique
Occupied Buy-Back Program, in which tenants of properties which are foreclosed upon by their owners
get the opportunity to purchase the home for $1000 (Gallagher 2018). At least 400 people have become
homeowners through the program, which includes financial counselling services (Hunter 2018).
Finally, policies frequently referred to as side yard programs have focused on transferring ownership of
vacant land to nearby homeowners. Columbus, Ohio sells unused parcels to any interested buyer for
market value but 50% rebates are available to owner-occupants adjacent to available parcels if they
keep the land mowed for three years; another dollar-for-dollar rebate for improvements made to the
land can cover the other 50% (City of Columbus 2016). In Saint Louis, Missouri, owners of occupied
5residential or commercial structures adjacent to vacant lots owned by the city can pay a $125
application fee and mow the land for two years in exchange for the deed (St. Louis Land Reutilization
Authority n.d.). In New Orleans, any landowner sharing a common boundary with an available property
can buy it at market value but the city will credit owners for improvements made (NORA n.d.). In
Detroit, more than 10,000 city-owned vacant parcels have been sold; owners can buy lots next to their
homes for $100 (Gallagher 2018). Cleveland, Pittsburgh, Buffalo, and Philadelphia have similar
programs.
Vacancy and municipal sales of vacant lots in Chicago
Chicago, which had a 2010 population more than 25% lower than its 1950 peak, is one of America’s
shrinking cities (Mallach 2017; US Census Bureau and Steiner 2018). The effect of suburbanization on
Chicago’s growth patterns are clearly visible in Figure 1, which documents a shift of regional population
growth away from the city, first into Cook County (1930-1970), and more recently into the surrounding
metropolitan region. In the last fifty years, the city has also experienced substantial income bifurcation,
with middle-class neighborhoods declining from 50% to 16% of census tracts since 1970, and requisite
increases in both higher and lower income areas (22% and 62% in 2017, respectively) (Lutton 2019).
Figure 1: Population in Chicago and its metropolitan region
8
Millions
7
6
5
4
3
2
1
0
1840 1860 1880 1900 1920 1940 1960 1980 2000
Chicago Cook County 8 County Metropolitan Division
Source: US Census Bureau and Steiner 2018; Minnesota Population Center 2011
The city’s south and west sides, home to the highest concentrations of poverty, also contain the
substantial majority of the city’s residential vacant land. In all, according to the Chicago Metropolitan
Agency for Planning’s 2013 land use inventory, there are 27,000 vacant residential parcels in the city,
occupying over 2600 acres. 2 Figure 2 demonstrates the overwhelming concentration of these parcels to
the south and west of downtown. By its own count, the City of Chicago as of February 2019 owns 11,600
of these parcels, and has sold an additional 4,200 in recent years. 3 These parcels are similarly
concentrated in the south and west sides.
2
To arrive at these numbers, I imposed CMAP’s land use inventory, which captures congruous land use areas, on
the Cook County Assessor’s parcel map, and limited results to within Chicago city limits.
3
Data from the Chicago Data Portal’s City Owned Land Inventory, retrieved 2/20/19. It is believed that this data
remains not completely accurate, although city staff are actively working to improve the city’s land inventory
system (Dickhut personal interview, 2018).
6Figure 2: Residential Land vacancy in Chicago
Data from the Chicago Metropolitan Agency for Planning 2014 Land Use Inventory, and Chicago DPD
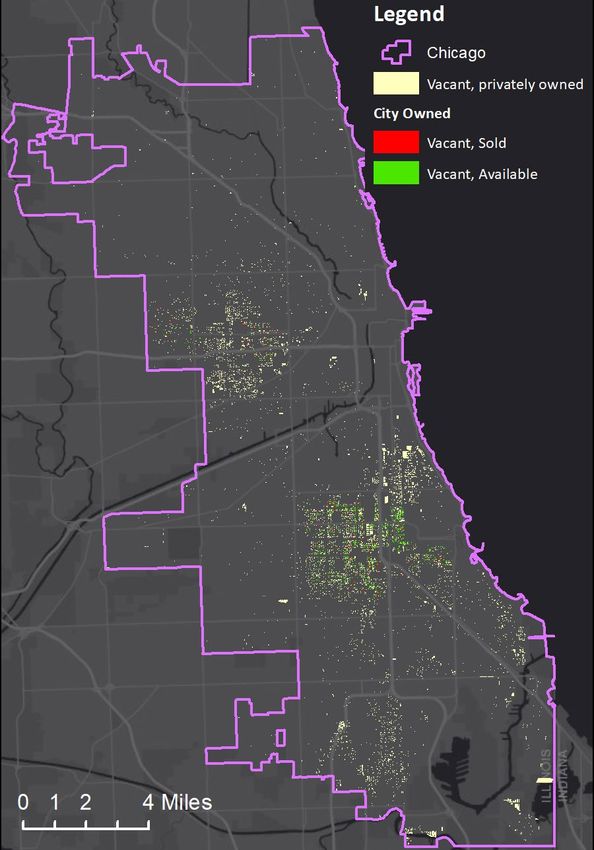
7Like many of the cities described above, Chicago has Figure 3: Large Lots eligible buyers
offered vacant, city-owned parcels for sale for
decades. Though the Adjacent Neighbors Land
Acquisition Program (ANLAP), which has existed
since the 1980s, owner-occupants adjacent to city
owned property could buy a single lot at below-
market-rate. However, this program saw limited
success and some viewed ANLAP as “actually
preventing,” rather than facilitating, the purchase of
vacant lots (Drummer, qtd at 2:05 in ChiHackNight
2017; Dickhut 2018).
In the early 2010’s, community organizations in
Englewood, one of the neighborhoods in Chicago’s
south side, began working with the city’s
Department of Planning and Development to
develop a program to replace ANLAP. The result of
this collaboration, called the Large Lots Program, was launched as a part of the city’s Green Healthy
Neighborhoods plan in 2014. The Large Lots program loosened many of ANLAP’s requirements, including
broadening eligibility from owner-occupants to owners (including nonprofit block clubs and corporations
such as churches): buyers no longer need to reside on the block. According to DPD Deputy
Commissioner Kathy Dickhut, this change was made because many homeowners in Englewood—often
African American families who had moved to Chicago during the Great Migration— maintained close
ties with their property and neighborhood despite having moved elsewhere since (Dickhut 2018).
Eligible Large Lot purchasers may own anywhere on the same block as an available parcel (including
across the street or across the back alleys common in the city; see Figure 3), can purchase two parcels
per program round, and must retain ownership for five or more years. As long as they comply with city
code, there is no restriction on what an owner does with their property. More thorough detailing of the
requirements of both the ANLAP and Large Lots Program can be found in Table 1.
The Large Lots program was first implemented in the Englewood neighborhood in 2014, where over 300
parcels were sold (ChiHackNight 2017). Since that initial success, the program has been repeated in four
other neighborhoods (East Garfield Park, Austin, Roseland/Pullman, and Auburn/Gresham) and then
two rounds that included parcels from across the south and west sides. In total, 1,248 sales have been
recorded through the program, although this figure does not yet include sales in the second (2018)
expansion round, which as of writing are not believed to have been finalized. The program is expected
to continue (Dickhut 2018).
8Table 1: Regulations of Chicago’s ANLAP and Large Lots Program
ANLAP Large Lots Program
Eligible parcels City-owned, vacant, residentially zoned lots
Cost $1000 or more per lot, depending on $1 per lot
assessed value
Eligible buyers Owner-residents immediately adjacent to Owners of land on same block as eligible
eligible parcel parcel, including nonprofit block clubs and
corporations
Max purchase 1 lot 2 lots per program cycle
Sale restrictions Cannot be sold separately from primary Cannot resell for 5 years
parcel within first 10 years
Other restrictions In first 10 years, improvements limited to None.
landscaping or construction of garage or
integrated house extension
Purchase process Rolling applications Interactive website; door-to-door canvassing
about program; applications accepted in
cycles
Aldermanic Approval Letter of support from alderman required Alderman approves list of properties to be
with application offered during a cycle, then approves sales at
end of cycle
(City of Chicago n.d.; ChiHackNight 2017; Dickhut 2018)
Extant evaluations of vacancy management
Although the study of urban shrinkage is not new, not enough scholarly attention has been focused on
how cities have responded to shrinkage (Großmann et al. 2013). Few studies, for example, have
evaluated the impacts of side yard programs. Margaret Dewar, one of the few authors who has studied
this topic, suggested over a decade ago that “existing research on how to handle vacant and abandoned
properties is strong on recommendations but weak on evaluation, especially for programs currently
operating” (2006, 167); a review of the literature since then suggests that little has changed. More
recently, Nassauer & Raskin (2014) posed a series of yet-to-be-answered questions about the impacts of
“patchy” land vacancy—and informal and formal responses to it—on social capital and other “socio-
ecological systems.”
What studies do exist tend to focus on institutional hurdles to vacant land disposition and evaluate
cities’ relative successes at managing these challenges. Dewar, for example, has compared Cleveland’s
and Detroit’s disposition efforts recognizing the importance of embedding sales in wider planning
strategies, using land banks to clear titles before sale, and implementing programs to encourage positive
reuse of sold parcels (2006). Ganning and Tighe, in a study of St. Louis, Missouri’s side yard program,
evaluate the policy constraints that prevent a large number of sales in that program. They find that local
policy structure and state regulations both have substantial impact on success of lot sales but do not
seek to measure the impacts of the sales on buyers or the surrounding community (2015). One notable
exception is Schilling’s case study of Richmond, Virginia’s Neighborhoods In Bloom program, which
found a 37% reduction of violent crime and a 19% reduction in property crime in the program’s target
neighborhoods after two years (Schilling 2002, 17).
Some analysis has been done on what owners of new parcels do with their land. Dewar has studied
outcomes of managed versus auction sales in Flint and Detroit, finding that positive property reuse is
much more likely following a managed sale such as through a side-yard program (2015). In an ongoing
9study of Chicago’s Large Lots Program, a team led by Gobster and Stewart are performing visual
assessments of improvements made by new parcel owners (Gobster et al. 2018).
There appears to be no formal evaluations of program success at a more fundamental level. The goals of
policymakers who seek to dispose of municipally-owned vacant land are both direct (decreasing the
city’s financial liability and increasing tax revenue) and indirect (improving neighborhood health,
reducing crime, encouraging reinvestment, and rebuilding wealth). No recent formal scholarship exists
investigating how successful existing policies are at achieving this second set of goals.
Furthermore, critical scholars present arguments that complicate the narrative of urban blight
management and vacancy management all together. Kelly suggests that vacancy management programs
must grapple with a the dual realities that increasing development in distressed areas requires an influx
of private capital and yet the market-based approaches that attract that capital are likely to reinforce
segregation and inequality (2016, see pp. 1026, 1034). Sefransky, in study of the urban open space trend
in Detroit, suggests that the greening of poor urban neighborhoods of color may be acts of urban
colonialism that reclaim space from the poor for the benefit and profit of those better-off:
“accumulation by green dispossession” (2014, 244). Rosenman and Walker, who review Cleveland’s
post-recession investment in intensive demolition, characterize extreme hypervacancy and that city’s
“demolition coalition” in a neoliberal framework, and characterize choices about how to manage high
foreclosure rates as an “austerity machine” (2016). If demolition is “a necessary form of public
investment to groom the urban landscape for future growth,” (2016, 283) is the transfer back into the
private market of vacant parcels that have been “groomed” both physically and legally (in terms of a
clean title) simply the next step in a neoliberal process of uneven capital accumulation? These questions
further motivate evaluations of the impacts of vacancy management policies.
III. Research Strategy & Data Methods
Research questions and analysis geography
To address the gap in scholarship described above, this study seeks to evaluate Chicago’s Large Lots
program and investigate what impacts lot sales have had. Considering the breadth of the program’s
desired direct and indirect outcomes, many angles of potential evaluation exist. This project seeks to
opportunistically answer three distinct research questions based on available quantitative data. This
section describes, motivates, and outlines a methodology to answer each research question.
First, who is buying Large Lots parcels? The Large Lots program seeks to transfer control of land to and
generate wealth within the communities where the conjoined problems of land vacancy and suppressed
property value are most severe. To keep these gains local, the program gives local alderman veto-power
over specific sales and requires buyers to already own property on the same block. As long as they can
demonstrate existing ownership, buyers can be individuals or incorporated groups such as (but not
limited to) block groups, non-profits, or limited liability corporations. There is no mechanism for block-
or neighborhood-residents who are not owners to participate in the program, and no requirement that
owners actually live in the community to be eligible. I use the names and mailing addresses recorded on
Large Lots deed transfers to explore who has purchased parcels, how many parcels they have
purchased, and where they live.
Second, has the Large Lots program had an impact on crime? Originators of the Large Lots program
argued that returning neighborhood land to local control, increasing community self-determination over
land use, and decreasing the number of vacant lots would have a positive impact on crime levels. The
10literature suggests this argument has merit. I perform a block-level panel statistical analysis to compare
the location of lots available and lots sold through the Large Lots program to the frequency and severity
of crime.
Third, how much wealth creation is the Large Lots program expected to generate? One of the
program’s initial stated goals was to support the generation of wealth in communities that have been
victims of historical disinvestment and whose residents have experienced institutional roadblocks that
have limited access to wealth-generating homeownership. Transferring developable lots to community
members at only a nominal cost at a time when property values across the city are rising—in some
neighborhoods quite quickly—has the potential to achieve this goal. I use neighborhood-based property
value trends and assessed values of sold lots to project the value of property transferred through the
program, and therefore the expected generation of individual wealth, over time.
Due to data availability this analysis focuses on the 844 Large Lots sales conducted in three broadly
construed sale ‘neighborhoods’, which I call study areas, between 2014 and 2017. Studied parcels
include those sold during the first three neighborhood-specific pilot implementations of the program as
well as those sales from the first all-neighborhood expansion round (LL6) that occurred in the
neighborhoods previously treated in the first three pilots. Details of Large Lots sales considered and not
considered in this analysis are reviewed in Table 2.
Table 2: Large Lots Program and Analysis Subset
PROGRAM DATE SALES INCLUDED IN ANALYSIS SALES NOT INCLUDED
LL1: Greater Englewood Spring 2014 279
LL2: East Garfield Park Summer 2014 155
LL3: Austin Fall 2014 50
LL4: Roseland Pullman Fall 2015 15
LL5: Auburn Gresham Spring 2016 32
LL6: Expansion 1 Fall 2016 360 346
LL7: Expansion 2 Spring 2018 All (data not yet published)
TOTAL 844 404
Data: author’s analysis of multiple data sources. Sums are not always perfect due to data source inconsistency.
Data sources & dataset construction
To answer these questions, data from seven distinct data sources were combined. These sources are
described below and summarized in Table 3.
• The Large Lots website (www.largelots.org) makes certain data available for download (LISC
Chicago and DataMade n.d.). Data available was found to include parcel eligibility for LL1, LL2,
and LL3, and sales for LL1 and LL2.
• Staff at the City of Chicago Department of Planning and Development (DPD) directly provided
additional Large Lots data. This data included Large Lots sales for all programs through the first
expansion round (LL6). Where this data overlapped with largelots.org data, data was relatively
congruent; where sources disagreed, DPD data was preferred.
• Cook County’s 2014 tax assessment parcel data was collected from the County’s open data
portal (https://datacatalog.cookcountyil.gov/). This data included polygons for all parcels in the
county and their 14 digit parcel identification number, crucial in establishing the location of
Large Lots parcels (Cook County Clerk 2016).
11• Parcel-level land use data was obtained from the Chicago Metropolitan Agency for Planning’s
2013 Land Use inventory, available from CMAP’s data hub (https://datahub.cmap.illinois.gov)
(Chicago Metropolitan Agency for Planning 2017).
• Crime, street grid, city-owned parcels, and Chicago community areas (neighborhoods) data
were obtained from the City of Chicago’s open data portal (https://data.cityofchicago.org). This
data was used to generate the unit of analysis and dependent variables for research question 2
(City of Chicago 2019).
• Transaction and land valuation data was obtained from the Zillow ZTRAX database (Zillow
2019). 4 ZTRAX, a national dataset of real estate assessment and transaction information
available to academic researchers, provided crucial data that underpins analysis for all three
research questions. This data includes transaction dates, transaction values, detailed
information on buyers and sellers, and parcel size and assessment information from the county
assessor.
• Finally, neighborhood price trends were obtained from the Cook County House Price Index
produced by Institute for Housing Studies at DePaul University (https://price-
index.housingstudies.org/) to inform the forecasting component of research question 3
(Institute for Housing Studies 2018a, 2018b).
Table 3: Data and Sources
DATA SOURCE ACCESSIBILITY
Crime Chicago Data Portal Public
Roads Chicago Data Portal Public
City-owned parcels Chicago Data Portal Public
Chicago Community Areas (neighborhoods) Chicago Data Portal Public
Parcels Cook County Data Portal Public
Land Use CMAP Data Hub Public
Program Lot Status LargeLots.org Public
Program Lot Status Chicago DPD Private
Transaction dates Zillow ZTRAX Private
Transaction values Zillow ZTRAX Private
Buyer and seller data Zillow ZTRAX Private
Tax assessment data Zillow ZTRAX Private
Neighborhood price trends DuPaul Inst. Housing Studies Public
The core analysis work addressing all three research questions was performed using a dataset
constructed by the author that combines the individual data sources described above. Dataset
construction can be understood as two distinct but overlapping processes: ZTRAX data construction and
data assembly.
ZTRAX data construction: Zillow ZTRAX is a nationwide dataset containing terabytes of data on decades
of real estate transactions and assessments, itself assembled from third party data sources. The data
available to researchers is stored in state-based tables that represent exports from a relational
database. ZTRAX’s Illinois transaction and assessment data was combined and subsetted to produce a
record of pertinent data on all properties in the three study areas. This was performed by writing a
STATA program capable of extracting specified fields from certain ZTRAX transaction tables and merging
4
Access to the Zillow ZTRAX database was made possible by Dr. Bill Lester, who is using the data for ongoing
research. This project contributes analysis to that ongoing work.
12them into a single dataset. The exact methodology for this stage is detailed in the Stata log in Appendix
A, and is summarized here.
The program amalgamates data from five ZTRAX transactions tables (main [transaction details], property
info, buyer name, buyer address, and seller name) and two ZTRAX assessment tables (main and value).
At times, multiple buyers and sellers are recorded for each transaction. I kept data for the first three
buyers and the first three sellers for each transaction. Additionally, all records in Cook County contained
only one single buyer mailing address, which was kept. The ZTRAX data contains up to three date fields
per transaction: the date the deed was produced (document date), signed (signature date), and
recorded (recording date). Per Zillow, the document date was used preferentially as the transaction
date, with the recording date substituted only where the document date did not exist (Zillow n.d.). This
occurred only 3 times.
The program tags transactions that are likely to be Large Lots sales in the 3 neighborhoods studied by
searching for quit claim transactions (per DPD, Large Lots are transacted almost universally with Quit
Claim deeds (Dickhut 2018)) on parcels found to be inside the boundaries of the three study
neighborhoods sold by the City of Chicago since January 1st, 2014.
Data assembly: All data sources were assembled in ArcGIS. This process is summarized and
contextualized here; a detailed step-by-step methodology can be found in Appendix B.
First, shapefiles from the Large Lots program website containing parcel eligibility and limited sale data
for the first three program pilots were combined with parcel data from the Cook County Assessor to
produce a map of all parcels in the three study neighborhoods. Land use data from the Chicago
Metropolitan Area for Planning was joined with the parcel data to assign every parcel a land use as of
2014. Tabular data on all Large Lots program sales between 2014 and 2018 (LL1 through LL6; see Table
4) received from Chicago DPD was paired with parcels via PIN and the distinct sources of sale data were
compared for accuracy. The much-more-comprehensive DPD data source was used for sale information
while the parcel eligibility data from the shapefiles was maintained to create the comprehensive parcel
status field described in Table 4. When this data is combined with the transaction dates from Zillow we
can visualize the actual closing dates of parcels transacted in each Large Lots phase in relationship to the
closing of the application window for that phase (Figure 4).
Table 4: Parcel Status
CODE MEANING ENGLEWOOD EAST GARFIELD PARK AUSTIN
-1 Ineligible parcel 39,991 5,751 21,274
0 Available for sale in LL1, LL2, or LL3, but not 3,484 235 166
purchased in pilot or expansion
1 Purchased in LL1 (Englewood) 279
2 Purchased in LL2 (East Garfield Park) 155
3 Purchased in LL3 (Austin) 50
4 Purchased in LL6 (First Expansion) 304 24 32
13Figure 4: When Large Lots sales occurred
200 200
Englewood (LL1)
180
East Garfield Park (LL2)
160
Austin (LL3)
140
Deed Transfers Recorded
Expansion (LL6)
120 LL application deadlines
100
80
60
LL1 LL2 LL3 LL6
40
20
0 0
Jun-14
Jun-15
Jun-16
Jun-17
Apr-14
Apr-15
Apr-16
Apr-17
Aug-14
Dec-14
Aug-15
Feb-15
Dec-15
Aug-16
Feb-16
Dec-16
Aug-17
Feb-17
Dec-17
Feb-18
Oct-14
Oct-15
Oct-16
Oct-17
Separately, the City of Chicago’s roads shapefile was used to construct blockfaces (single city blocks) and
assign parcels to them. Every block in the three neighborhoods was manually inspected to evaluate
whether the block was (1) relatively straight, (2) not a major commercial thoroughfare, (3) occupied by
primarily residential land uses, and (4) subdivided into primarily single-family-house-sized parcels that
(5) faced the street. Blocks that fit all of these standards were determined to be good for analysis in the
panel dataset used for research question 2. Additionally, where a single blockface was divided into
separate street polylines, these polylines were combined. 24% of blocks in the three neighborhoods,
containing 72% of Large Lots sales, are included in the crime panel (See Table 5). All 844 Large Lots sales
in the study neighborhoods are included in research questions 1 and 3.
Table 5: Blockfaces included in panel for Research Question 2
CATEGORY BLOCKFACES SOLD PARCELS
Included in crime panel (RQ 2) 1,345 611
Not included in crime panel 4,221 233
Total 5,566 844
% Included in crime panel 24.2% 72.4%
The polylines representing single blockfaces included in the crime panel were shortened by 50 feet from
either end to avoid accidentally capturing parcels across streets, then inflated width-wise by 75’ on
either side to create block capture areas. These capture area polygons were then joined to the parcel
data to assign each parcel to the correct blockface. Any parcel on a street corner where two analysis
blocks meet was duplicated for the sake of the crime panel as it is reasonably expected that the impact
of that sale would accrue to both blocks. However, this occurred for only 212 parcels (0.3%), of which
only 10 were eligible for Large Lots sales and only 3 of which were sold (0.4%). Furthermore, crime data,
which was geocoded based on city-provided coordinates that are anonymized to the blockface-level (it
14is not known where exactly on the blockface each crime occurred), was assigned to a blockface using the
block capture polygons. This process is visually depicted in Figure 5.
Figure 5: Blockface capture design
IV. Methodology
RQ1: Who is buying Large Lots parcels?
To evaluate who is purchasing Large Lots parcels, I inspect Zillow ZTRAX transaction data about those
parcels’ buyers. Of the 844 Large Lots sales in the study areas, 725 (86%) matching transactions were
located in ZTRAX. I first ask who buyers are and how many parcels they buy. More than 99% of records
had only one or two buyers listed so this analysis was performed on the first two buyer fields. Using
clues from the organization names and basic internet searches, 5 I categorize non-individual buyers into
four types: community-based organizations (including block groups, churches, and registered non-
profits); developers (LLCs with names that connote property development goals or associated with
individuals described as professional developers online); trusts, estates, and other family investment
vehicles; and other entities (including where the type is unknown) 6. To tally parcels purchased by the
same buyer, I count multiple instances of the same buyer name or buyer address due to typographical
errors in the data. Where these two sums differed, data was manually inspected to determine whether
the purchaser is likely to be the same entity.
This evaluation also includes an investigation, to the degree possible with available data, of how local
buyers of Large Lots parcels are. In order to evaluate the proximity of Large Lot buyers to their
purchased parcels, I geocoded the mailing addresses of the buyers associated with the transaction
5
Non-individual buyers with names that included words like “development”, “properties”, “property
management”, “capital”, and “real estate” were categorized as developers. Additionally, organizations were
categorized as “developers” where google searches yielded news articles or other web sources confirming the
entity or an associated individual was labeled as a “developer”
6
It is the author’s expectation that these organizations are either individuals who have placed their properties in
LLCs for tax and liability reasons or developers.
15You can also read