Experimental Study on the Reliability of Scaling Down Techniques Used in Direct Shear Tests to Determine the Shear Strength of Rockfill and Waste ...

Page created by Carmen Flynn
 
CONTINUE READING
Experimental Study on the Reliability of Scaling Down Techniques Used in Direct Shear Tests to Determine the Shear Strength of Rockfill and Waste ...
Article
Experimental Study on the Reliability of Scaling Down
Techniques Used in Direct Shear Tests to Determine the Shear
Strength of Rockfill and Waste Rocks
Akram Deiminiat and Li Li *

                                          Department of Civil, Geological and Mining Engineering, Research Institute on Mining and Environment,
                                          Polytechnique Montreal, Montreal, QC H3T 1J4, Canada; akram.deiminiat@polymtl.ca
                                          * Correspondence: li.li@polymtl.ca

                                          Abstract: The determination of shear strength parameters for coarse granular materials such as
                                          rockfill and waste rocks is challenging due to their oversized particles and the minimum required
                                          ratio of 10 between the specimen width (W) and the maximum particle size (dmax ) of tested samples
                                          for direct shear tests. To overcome this problem, a common practice is to prepare test samples by
                                          excluding the oversized particles. This method is called the scalping scaling down technique. Making
                                          further modifications on scalped samples to achieve a specific particle size distribution curve (PSDC)
                                          leads to other scaling down techniques. Until now, the parallel scaling down technique has been the
                                          most popular and most commonly applied, generally because it produces a PSDC parallel and similar
                                          to that of field material. Recently, a critical literature review performed by the authors revealed that
                                          the methodology used by previous researchers to validate or invalidate the scaling down techniques
         
                                   in estimating the shear strength of field materials is inappropriate. The validity of scaling down
Citation: Deiminiat, A.; Li, L.           techniques remains unknown. In addition, the minimum required W/dmax ratio of 10, stipulated
Experimental Study on the Reliability     in ASTM D3080/D3080M-11 for direct shear tests, is not large enough to eliminate the specimen
of Scaling Down Techniques Used in        size effect (SSE). The authors’ recent experimental study showed that a minimum W/dmax ratio of
Direct Shear Tests to Determine the       60 is necessary to avoid any SSE in direct shear tests. In this study, a series of direct shear tests
Shear Strength of Rockfill and Waste      were performed on samples with different dmax values, prepared by applying scalping and parallel
Rocks. CivilEng 2022, 3, 35–50.
                                          scaling down techniques. All tested specimens had a W/dmax ratio equal to or larger than 60. The
https://doi.org/10.3390/
                                          test results of the scaled down samples with dmax values smaller than those of field samples were
civileng3010003
                                          used to establish a predictive equation between the effective internal friction angle (hereafter named
Academic Editors: João                    “friction angle”) and dmax , which was then used to predict the friction angles of the field samples.
Castro-Gomes, Cristina Fael and           Comparisons between the measured and predicted friction angles of field samples demonstrated that
Miguel Nepomuceno                         the equations based on scalping scaling down technique correctly predicted the friction angles of
Received: 16 November 2021                field samples, whereas the equations based on parallel scaling down technique failed to correctly
Accepted: 5 January 2022                  predict the friction angles of field samples. The scalping down technique has been validated, whereas
Published: 8 January 2022                 the parallel scaling down technique has been invalidated by the experimental results presented in
                                          this study.
Publisher’s Note: MDPI stays neutral
with regard to jurisdictional claims in
published maps and institutional affil-
                                          Keywords: direct shear tests; scaling down technique; shear strength; maximum particle size;
iations.                                  scalping technique; parallel technique

Copyright: © 2022 by the authors.         1. Introduction
Licensee MDPI, Basel, Switzerland.
                                               The determination of shear strength parameters is challenging for coarse granular
This article is an open access article
                                          materials such as rockfill and waste rocks due to their oversized particles and the minimum
distributed under the terms and
                                          required ratio of 10 between specimen width (W) and the maximum particle size (dmax ) of
conditions of the Creative Commons
                                          tested samples for direct shear tests [1]. For the convenience of laboratory tests, it is always
Attribution (CC BY) license (https://
                                          preferable to use specimens as small as possible. However, when the specimens are too
creativecommons.org/licenses/by/
                                          small, the measured shear strength can be significantly different from that of the tested
4.0/).

CivilEng 2022, 3, 35–50. https://doi.org/10.3390/civileng3010003                                            https://www.mdpi.com/journal/civileng
Experimental Study on the Reliability of Scaling Down Techniques Used in Direct Shear Tests to Determine the Shear Strength of Rockfill and Waste ...
CivilEng 2022, 3                                                                                               36

                   material in field conditions. Thus, the tested specimens must be large enough to eliminate
                   any specimen size effect (SSE) [2–11]. The minimum required specimen volume to avoid
                   any SSE is called the representative element volume [12–14].
                         For direct shear tests, several standards have been proposed and used in practice.
                   Among them, the ASTM D3080/D3080M-11, hereafter called ASTM, is the most popular
                   and the most used worldwide [2,11,15–23]. It was published as ASTM D3080 in 1972 and
                   updated every eight years by the ASTM technical committees. Recently, it was temporarily
                   withdrawn due to over eight years passing since the last update [1]. The withdrawn
                   rationale has nothing to do with dmax ; therefore, it can be expected that the updated ASTM
                   standard for direct shear tests will remain unchanged with respect to the minimum required
                   specimen sizes. The width (W) and thickness (T) of the tested square specimen should be:
                   W ≥ 50 mm; T ≥ 13 mm; W/dmax ≥ 10; T/dmax ≥ 6; W/T ≥ 2. Similar requirements can be
                   found in other standards [24–26].
                         For fine particle materials such as clay, silt and sand with a dmax smaller than or equal
                   to 1 mm, applying ASTM in specimen preparation is not a problem because the standard
                   direct shear test system is usually equipped with a square shear box 60 mm wide (i.e.,
                   W = 60 mm). The specimens prepared with this standard shear box automatically have a
                   W/dmax ratio up to 60, a value largely exceeding the ASTM’s minimum required ratio of 10.
                   For coarse materials such as gravel, rockfill and waste rocks, applying ASTM in specimen
                   preparation can become problematic. The problem is particularly prominent with rockfill
                   and waste rocks, which usually contain fine particles as small as silts and coarse particles as
                   large as boulders. Conducting laboratory tests with original field material and respecting
                   the ASTM’s requirements are economically impossible if technically not impossible.
                         To overcome this problem, a common practice is to prepare test samples by excluding
                   the oversized particles [10,27–40]. The method is called the scalping scaling down technique.
                         Scalping technique is probably the simplest and earliest method to obtain laboratory
                   samples having an admissible dmax from field materials [10,29,33,37,40–47]. By applying
                   this technique, the particle size distribution curve (PSDC) of the obtained samples can
                   differ from that of the field material due to the reduction in coarse particles. Some re-
                   searchers made use of this method when the excluded oversized particles represented 10%
                   to 30% [37,42,48,49].
                         Further modifications on scalped samples to achieve a specific PSDC have led to
                   other scaling down techniques. When the PSDC of the scaled down sample is modified
                   to be parallel to that of field material, the method is called the parallel scaling down
                   technique [50–52]. The PSDC of the obtained sample thus looks like a horizontal shift of
                   the PSDC of the field material towards the finer side in the semi-log plane of the PSDC.
                         The third scaling down technique, called the replacement method, consists of replacing
                   the oversized particles by the same mass of particles having size between 4.75 mm (No.
                   4 sieve) and the admissible dmax [46,53–55]. The obtained samples can have a PSDC very
                   different from that of the field material [2,56,57].
                         The fourth scaling down method, called the quadratic grain-size technique, produces a
                   PSDC by following an equation that has nothing to do with the PSDC of field materials [10].
                   The physical meaning of the proposed modification is unclear, and it will not be discussed
                   further in this study.
                         Until now, the parallel scaling down technique has been the most popular and
                   the most widely used [10,15,17,30–32,38,39,57–65]. This is mainly because the parallel
                   scaled down samples are considered to be the most faithful to the field material, due
                   to the similarity between the PSDC of scaled down samples and that of the field mate-
                   rial [10,32,39,40,50–52,58–61,65,66]. This is, however, a not valid justification. Recently, a
                   critical review given by Deiminiat et al. [10] has shown that it is impossible to reproduce a
                   PSDC strictly parallel to that of field material without adding fine particles smaller than
                   the minimum particle size of the field material, as shown by Sukkarak et al. [64]. Adding
                   finer particle material, either by grinding material or from a different source, results in
                   an entirely different material from the field material. Changes in particle size and shape
CivilEng 2022, 3                                                                                                    37

                   associated with particle breaking during sample preparation are other aspects that do not
                   guarantee a faithful scaled down sample to the field material [10,58,61,63,65–70]. Therefore,
                   none of the four scaling down techniques can be used to produce a scaled down sample
                   faithful to the field material. In addition, the critical analysis of Deiminiat et al. [10] revealed
                   that the methodology used in previous studies [33,39,46] to validate or invalidate scaling
                   down techniques through direct comparisons between the effective internal friction angles
                   (hereafter named “friction angle” for the sake of simplicity) of field materials and those of
                   scaled down samples is inappropriate. The subsequent conclusion is invalid.
                         To correctly evaluate the reliability of a scaling down technique, a series of shear tests
                   should be performed on several scaled down specimens having different dmax values. A relation-
                   ship between the shear strength and dmax can then be established and used to predict the shear
                   strength of the field material by applying the extrapolation technique [15,16,19,58,59,62,63,71–73].
                   This methodology was followed by several researchers [74,75]. However, their direct shear
                   tests were performed by using a W/dmax ratio equal to or even smaller than the minimum
                   required value of 10 stipulated by the ASTM standard, exactly the procedure carried out
                   by other researchers [9,16,19–23,31,58,59,62,63,73,76]. Recently, Deiminiat et al. [10] have
                   shown that the minimum required W/dmax ratio of 10, stipulated by the ASTM standard,
                   is too small to eliminate SSEs. Deiminiat et al. [11]) further showed that the minimum
                   required W/dmax ratio should be around 60 to avoid any SSE. The published experimental
                   results obtained by using the minimum required W/dmax ratio of 10 and the subsequent
                   conclusions are not reliable. The validation or invalidation of scaling down techniques
                   shown in previous studies is questionable. Further validation or invalidation of the scaling
                   down techniques is necessary against reliable experimental results. To this end, a series of
                   direct shear tests were performed by using specimens having W/dmax ratios equal to or
                   larger than 60, prepared by applying the scalping and parallel scaling down techniques;
                   the replacement scaling down technique could not be applied because the dmax value of
                   the “field” material is too close to the critical value of 4.75 mm. It is important to note that
                   the shear strength of coarse granular materials is not only controlled by dmax , but also by
                   particle shapes, content of fine or gravel particles, compact or relative density, water content,
                   normal stress, specimen shape, etc. One methodology is to simultaneously consider all the
                   influencing parameters together. This is good for a specific project of design and construc-
                   tion, but it is not suitable in research because the test results would be a consequence of
                   the combined effects of several influencing factors. The results do not allow a good and
                   accurate understanding of the effect of each individual influencing parameter. The unique
                   scope of this paper is to verify the validity/invalidity of scaling down techniques associated
                   with variation in the dmax value; thus, the only allowed changing parameter is the dmax
                   value. For one given material, all other influencing parameters must be kept constant.
                         In this paper, some of the experimental results are presented. The test results are then
                   used to test the validity of the scalping and parallel scaling down techniques through the
                   processes of curve-fitting and prediction by extrapolation.

                   2. Laboratory Tests
                   2.1. Testing Materials
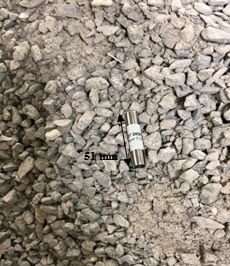
                       In this study, two types of waste rocks, called WR1 and WR2, were tested. Figure 1
                   shows a photograph of WR1 (Figure 1a) and a photograph of WR2 (Figure 1b). The two
                   waste rocks contained a wide range of sub-angular and sub-rounded particles. They were
                   used to prepare three testing materials, called M1, M2 and M3. M1 and M2 were made of
                   WR1 and WR2, whereas M3 was made of WR2 based on the PSDC of WR1.
                       The largest shear box had a square section of 300 mm by 300 mm; therefore, the largest
                   admissible dmax was 5 mm in order to have W/dmax ratios not smaller than 60 [11].
CivilEng 2022, 3, FOR PEER REVIEW                                                                                                                4

 CivilEng 2022, 3                                                                                                                                38
CivilEng 2022, 3, FOR PEER REVIEW                                                                                                                4

                                                                           (a)                                        (b)
                                Figure 1. Photos of (a) WR1
                                                        (a) and (b) WR2.                                              (b)
                                    Figure 1.1.Photos
                                         The
                                     Figure     Photosofshear
                                               largest  of(a)
                                                            (a)WR1
                                                                boxand
                                                                WR1 and(b)
                                                                    had    WR2.
                                                                         a square
                                                                        (b) WR2. section of 300 mm by 300 mm; therefore, the larg-
                                est admissible dmax was 5 mm in order to have W/dmax ratios not smaller than 60 [11].
                                      The
                                      To    largest shear
                                        Toprepare
                                            prepare    the    box had
                                                       the testing
                                                            testing       a square
                                                                      samples
                                                                       samples  withsection
                                                                                 with        of 300
                                                                                      different
                                                                                       different dmax
                                                                                                   dmaxmm   by 300
                                                                                                        values,
                                                                                                          values,     mm;
                                                                                                                 a aportion  therefore,
                                                                                                                       portion of of
                                                                                                                                  waste   therocks
                                                                                                                                          rocks
                                                                                                                                      waste    larg-
                                                                                                                                                 was
                                est admissible
                                 first  sorted      d
                                                 with     was
                                                      maxsieves 5 mm
                                                                  of    in order
                                                                     opening      to
                                                                               sizes  have
                                                                                      of 5, W/d
                                                                                            3.36,    ratios
                                                                                                  2.36,
                                                                                                 max         not
                                                                                                          1.4,    smaller
                                                                                                               1.19,  0.85,   than
                                                                                                                             0.63,
                                was first sorted with sieves of opening sizes of 5, 3.36, 2.36, 1.4, 1.19, 0.85, 0.63, 0.315, 0.16  60  [11].
                                                                                                                                    0.315,  0.16 and
                                 0.08 Tomm.prepare
                                               Thus,   the
                                                        all testing
                                                            the        samples
                                                                  particles      with
                                                                             larger     different
                                                                                     than  5 mm     d max values,
                                                                                                   were    excluded.a
                                and 0.08 mm. Thus, all the particles larger than 5 mm were excluded. The obtained sam- portion
                                                                                                                         The      of  waste
                                                                                                                               obtained       rocks
                                                                                                                                            samples
                                was
                                 with
                                ples  first
                                      with  sorted
                                         dmax  = 5=mm
                                             dmax    5with
                                                        mm   sieves
                                                           were
                                                              were    of opening
                                                                  considered
                                                                     considered as sizes
                                                                                   “field”
                                                                                   as     of materials.
                                                                                             5, materials.
                                                                                       “field”  3.36, 2.36,To1.4,  1.19,
                                                                                                               avoid
                                                                                                               To avoid   0.85,
                                                                                                                        anyany   0.63, 0.315,
                                                                                                                              confusion
                                                                                                                                 confusion  with0.16
                                                                                                                                                  the
                                                                                                                                               with
                                and
                                 in in
                                the   0.08
                                     situ   mm.
                                           field
                                         situ fieldThus,
                                                  materials,all
                                                      materials,the  particles
                                                                 thethe
                                                                      laboratorylarger
                                                                         laboratory     than
                                                                                   “field”
                                                                                      “field” 5 mm
                                                                                             materials were
                                                                                               materials       excluded.
                                                                                                          areare
                                                                                                               hereafter
                                                                                                                  hereafter The
                                                                                                                            called obtained
                                                                                                                               calledfield     sam-
                                                                                                                                            samples.
                                                                                                                                        field sam-
                                ples  with
                                 Figure    2 d max = 5the
                                             shows      mm    were
                                                            PSDCs     considered
                                                                      of field     as
                                                                               samples “field”
                                                                                          of M1,materials.
                                ples. Figure 2 shows the PSDCs of field samples of M1, M2 and M3. M2    and    To
                                                                                                              M3.  avoid   any   confusion     with
                                the in situ field materials, the laboratory “field” materials are hereafter called field sam-
                                ples. 100
                                       Figure 2 shows the PSDCs of field samples of M1, M2 and M3.

                                                              90          Field sample M1 and M3 with dmax of 5 mm
                                                             100
                                                              80
                                                              90          Field sample M2
                                                                                       M1 with dmax
                                                                                          and M3    of dmax
                                                                                                 with  5 mm of 5 mm
                                                             70
                                                             80           Field sample M2 with dmax of 5 mm
                                                   passing

                                                             60
                                                             70
                                                             50
                                              passing

                                                             60
                                          Percent

                                                             40
                                                             50
                                                             30
                                      Percent

                                                             40
                                                             20
                                                             30
                                                             10
                                                             20
                                                              0
                                                             10
                                                                   0.01               0.1                     1                    10
                                                               0                            Grain size (mm)
                                                                   0.01               0.1                     1                     10
                                Figure
                                 Figure2.2.PSDCs
                                            PSDCsofoffield
                                                       fieldsamples
                                                             samplesM1,
                                                                     M1,M2
                                                                         M2and
                                                                            andM3.
                                                                         Grain size
                                                                                M3. (mm)

                                    Figure 2. PSDCs
                                          Table
                                         Table       of field
                                                11shows
                                                   shows  the samples
                                                            the
                                                              differentM1,
                                                                different  M2 andof
                                                                          portions
                                                                        portions   M3.
                                                                                   offield
                                                                                       fieldsamples
                                                                                             samplesM1,
                                                                                                     M1,M2
                                                                                                         M2and
                                                                                                            andM3.
                                                                                                                M3.They
                                                                                                                    Theywere
                                                                                                                         wereused
                                                                                                                              used
                                asasthe
                                     thebase
                                         basematerials
                                                materialsfor
                                                           formaking
                                                               makingscaled-down
                                                                           scaled-downsamples
                                                                                           sampleswith
                                                                                                     withdmaxdmaxvalues
                                                                                                                   values
                                                                                                                        ofof1.19,
                                                                                                                              1.19,1.4,
                                                                                                                                     1.4,2.36,
                                                                                                                                           2.36,
                                  and Table
                                       3.36  1
                                            mm shows
                                                  by   the different
                                                     applying   the    portions
                                                                      scalping    of
                                                                                 and field samples
                                                                                      parallel       M1,
                                                                                                scaling
                                and 3.36 mm by applying the scalping and parallel scaling down techniques.  M2
                                                                                                          down  and  M3. They
                                                                                                                  techniques.   were    used
                                as theTobase  materials
                                           apply          for making
                                                   the scalping  scaling scaled-down      samples
                                                                             down technique,     onewith
                                                                                                      candeither
                                                                                                             max values of 1.19,
                                                                                                                    calculate  the1.4,  2.36,
                                                                                                                                    required
                                and   3.36 mm   by
                                  mass1.ofPortion
                                Table               applying
                                           each range          the
                                                        of particle
                                                  distributions      scalping
                                                                     sizesamples
                                                                of field        and
                                                                            based on parallel
                                                                                   M1,Table    scaling
                                                                                            1 to M3.
                                                                                        M2 and         down      techniques.
                                                                                                 obtain a sample by controlled mixture
                                  (hereafter called the controlled scalped sample), or directly pour field sample through a
                                Table
                                  sieve1.with
                                          Portion             Portion
                                               thedistributions
                                                    target dmax oftofield (%)
                                                                           samples
                                                                      obtain                and M3. any control Passing%
                                                                                   M1, M2without
                                                                               a sample                              (hereafter called the
                                  uncontrolled scalped sample).         For
                                                              Portion (%)    a given  admissible   d max , the  scalped samples obtained
                                                                                                                     Passing%
Sieve Open-
                                                Range of Parti-
                                                                     M1 and M3                     ing SizeM2      M1 and M3           M2
                                                   cle Size
CivilEng 2022, 3                                                                                      (mm)                                     39
                                                   3.36–5 mm           30.3            23.8              5            100.0           100.0
                                                 2.36–3.36 mm          22.0            18.1            3.36            69.7            76.2
                                                 1.40–2.36 mm          10.4            10.7            2.36            47.7
                                               by applying the two methods should be identical. In reality, difference can appear      58.1as the
                                                 1.19–1.40 mm           2.9             5.2             1.4            37.3
                                               source materials are not entirely homogeneous. In this study, controlled scalped samples47.4
                                                 0.85–1.19
                                               were        mmfrom field
                                                     obtained          12.3            11.3
                                                                         sample M1, whereas            1.19 scalped 34.4
                                                                                                uncontrolled           samples of field42.2
                                                                                                                                         sample
                                               M2   were obtained
                                                 0.63–0.85 mm      directly
                                                                        8.0 from WR2.9.1  Controlled scalped
                                                                                                       0.85     samples  made of field30.9
                                                                                                                       22.1              sample
                                               M3   were obtained
                                                0.315–0.63  mm by again 2.5 considering 4.7the PSDC of   field sample M1.
                                                                                                       0.63            14.0 Figure 3 shows
                                                                                                                                       21.8 the
                                               PSDC   of scalped
                                                0.16–0.315 mm    samples  of
                                                                        1.8  M1  and  M3  (Figure
                                                                                        4.5       3a)  and
                                                                                                      0.315 those of M2 (Figure
                                                                                                                       11.5     3b); the  PSDCs
                                                                                                                                       17.1
                                               of0.08–0.16
                                                  field samples
                                                           mm M1 to M3  5.4 are also plotted
                                                                                        6.7 on the figure.
                                                                                                       0.16             9.8            12.7
field and scaled down samples. The scaled down sample is thus a material obtained from
                                                 the controlled mixture, not a fully natural material.
                                                       As an example, one explains how to prepare the parallel scaled down sample having
CivilEng 2022, 3
                                                 dmax = 3.36 mm from the field sample with dmax = 5 mm. One first obtains the scaled down        40
                                                 ratio N = 1.488 (=5 mm/3.36 mm). Afterwards, applying this scaled down ratio to all the
                                                 ranges of particle sizes of the field sample results in new ranges of particle sizes for the
                                                 scaled down sample, as shown in Table 2. For the calculated range of particle sizes, which
                                                 the scaled
                                                 do not  havedown   sample,
                                                              matched         as shown
                                                                          sieves,        in Table has
                                                                                  approximation   2. For  themade,
                                                                                                      to be   calculated range
                                                                                                                   as shown  in of particle
                                                                                                                                Table  2. In sizes,
                                                                                                                                             addi-
                                                 which   do not have  matched   sieves, approximation   has  to be made, as shown   in Table
                                                 tion, fine particles in the range from 0.053 to 0.1 mm and fine particles smaller than 0.053 2. In
                                                 addition, fine particles in the range from 0.053 to 0.1 mm and fine particles smaller than
                                                 mm have to be added. The parallelism between the PSDCs of scaled down samples and
                                                 0.053 mm have to be added. The parallelism between the PSDCs of scaled down samples
                                                 field samples is impossible for these fine particle parts. The same method has been fol-
                                                 and field samples is impossible for these fine particle parts. The same method has been
                                                 lowed by several researchers [33,40,50,65,66,74]. An alternative method is addressed in
                                                 followed by several researchers [33,40,50,65,66,74]. An alternative method is addressed in
                                                 the Discussion section.
                                                 Section 4.
                                                 Table 2. Calculation and selection of particle sizes for making parallel scaled samples with dmax =
                                                 Table 2. Calculation and selection of particle sizes for making parallel scaled samples with
                                                 3.36 mm for field samples M1, M2 and M3.
                                                 dmax = 3.36 mm for field samples M1, M2 and M3.
                                                   Range of Particle Sizes of Parallel Scaled Down Sam-
   Range of Particle Size of                                                 Range of Particle Sizes of Parallel                         Portion (%)
                                                   Range of Particle Size      plesScaled Down Samples                                    Portion (%)
       Field Material
                                                                Calculated
                                                     of Field Material                           Chosen                             M1 and M3           M2
                                                                               Calculated            Chosen                          M1 and M3            M2
            3.36–5 mm                                          2.26–3.36 mm                  2.36–3.36 mm                              30.3             23.8
                                                        3.36–5 mm            2.26–3.36 mm        2.36–3.36 mm                            30.3            23.8
          2.36–3.36 mm                                         1.60–2.26 mm                  1.60–2.36 mm                              22.0             18.1
                                                       2.36–3.36 mm           1.60–2.26 mm       1.60–2.36 mm                            22.0            18.1
          1.40–2.36 mm                                         0.95–1.60
                                                       1.40–2.36  mm      mm 0.95–1.60 mm 1.0–1.60      mm
                                                                                                  1.0–1.60 mm                          10.4
                                                                                                                                         10.4           10.7
                                                                                                                                                         10.7
          1.19–1.40 mm                                         0.80–0.95
                                                       1.19–1.40  mm      mm 0.80–0.95 mm 0.80–1.0      mm
                                                                                                  0.80–1.0 mm                           2.9
                                                                                                                                          2.9            5.2
                                                                                                                                                          5.2
          0.85–1.19 mm                                 0.85–1.19  mm
                                                               0.56–0.80 mm   0.56–0.80 mm       0.56–0.80
                                                                                             0.56–0.80 mm  mm                            12.3
                                                                                                                                       12.3              11.3
                                                                                                                                                        11.3
          0.63–0.85 mm                                 0.63–0.85  mm
                                                               0.42–0.56 mm   0.42–0.56 mm       0.42–0.56
                                                                                             0.42–0.56 mm  mm                             8.0
                                                                                                                                        8.0               9.1
                                                                                                                                                         9.1
                                                      0.315–0.63 mm          0.21–0.42 mm        0.21–0.42 mm                             2.5             4.7
          0.315–0.63 mm                                        0.21–0.42
                                                      0.16–0.315  mm      mm 0.10–0.21 mm 0.21–0.42      mm
                                                                                                 0.10–0.21 mm                           2.5
                                                                                                                                          1.8            4.7
                                                                                                                                                          4.5
          0.16–0.315 mm                                        0.10–0.21
                                                       0.08–0.16  mm      mm 0.053–0.10 mm 0.10–0.21     mmmm
                                                                                                0.053–0.10                              1.8
                                                                                                                                          5.4            4.5
                                                                                                                                                          6.7
          0.08–0.16 mm
CivilEng 2022, 3                                                                                                               41

                                    As previously outlined, the scope of this study is to analyze the reliability of scaling
                              down techniques. It is thus very important to ensure that variations in the measured
                              friction angle of one given material prepared by following one scaling down technique are
                              only due to the variations in dmax , instead of a result due to the combined effects of several
                              influencing factors. The scaled down samples and the field samples should have the same
                              compactness (void ratio) and the same moisture content, under the same normal stresses.
                              All the samples were thus prepared with dry waste rocks. Another advantage associated
                              with dry materials is the removal of any possible influence of loading rate on the shear test
                              results [33,77]. The tested specimens were prepared by slowly placing the materials in the
                              shear boxes to determine the loosest state. The density of the loosest field sample was first
                              obtained by considering the volume of the large shear box of 300 mm × 300 mm × 180 mm
                              and the mass of the filled material at the loosest state. The specific gravity (Gs ) of the sample
                              was measured to be equal to 2.65 by following ASTM C128 [78]. The maximum void ratio
                              (emax ) of the loosest field sample can then be obtained. To obtain the same void ratio and
                              density for scaling down specimens, the required masses were calculated by using the
                              volume of the large shear box and the values of Gs and emax of the field sample.
                                    Table 3 shows the tested specimens along with their specimen sizes to dmax ratios and
                              emax . For each sample, direct shear tests were repeated three times to obtain three values of
                              friction angle; each value was obtained by performing three direct shear tests with normal
                              stresses of 50, 100 and 150 kPa, respectively. These values are relatively small, due to
                              the limited capacity of air compressor on the large size specimens of 300 mm × 300 mm.
                              The void ratios of the tested specimens after the application of the normal stresses before
                              applying shear strains were estimated and are presented in Table 4. It can be seen that the
                              void ratios of the tested specimens decrease slightly as the applied normal stress increases
                              from 0 to 50 kPa. The decrease degree becomes smaller when the normal stress is further
                              increased from 50 to 150 kPa. When the system became stable, shear loads were applied by
                              using a strain rate of 0.025 mm/s (1.5 mm/min). A total number of 243 direct shear tests
                              were performed to complete the test program in this study.
                                    Figure 5 shows typical shear stress–shear displacement curves obtained with the large
                              shear box on the field and scaled down samples of M1 (graphs on left column), M2 (graphs
                              in the center column) and M3 (graphs on right column). One sees that the shear stress and
                              displacement curves of different specimens of the same material under a given normal
                              stress (σn ) have the same variation trend. For example, for M1 under a normal stress of
                              50 kPa, all the shear stress and displacement curves of field, scalped and parallel scaled
                              down samples exhibit a loose sand-like mechanical behavior. This indicates that the tested
                              samples are all very loose and their compactness states are close to each other.

                              Table 3. Tested specimens along with sizes to dmax ratios and emax for M1, M2 and M3.

                                                 emax [79]                  Large Shear Box              Small Shear Box
         Samples          dmax (mm)
                                         M1         M2        M3         W/dmax         T/dmax        W/dmax          T/dmax
       Field sample          5          0.59       0.70       0.68         60             36              –             –
                            3.36        0.58       0.69       0.66          89             54             –              –
      Scalping down         2.36        0.57       0.68       0.68         127             76             –              –
    technique samples       1.4         0.60       0.67       0.65         214            129            71             32
                            1.19        0.60       0.66       0.67         252            151            84             38
                            3.36        0.58       0.68       0.66          89             54             –              –
  Parallel scaling down     2.36        0.61       0.67       0.65         127             76             –              –
   technique samples        1.4         0.60       0.68       0.68         214            129            71             32
                            1.19        0.62       0.67       0.66         252            151            84             38
3.36               0.50        0.49         0.48       0.65      0.62         0.62       0.60        0.60         0.60
 Scalping down
                                            2.36               0.49        0.48         0.48       0.64      0.61         0.61       0.63        0.63         0.62
 technique
CivilEng 2022, sam-
               3                                                                                                                                                   42
                                             1.4               0.52        0.51         0.50       0.63      0.60         0.61       0.60        0.60         0.59
        ples
                                            1.19               0.52        0.50         0.50       0.63      0.60         0.60       0.62        0.61         0.61
                                            3.36               0.51        0.50         0.49       0.62      0.61         0.60       0.60        0.60         0.59
  Parallel down                                                 Table 4. Void ratio (e) of the tested specimens after the application of normal stresses (σn ) before
                                            2.36               0.52        0.51         0.50       0.63      0.61         0.61       0.61        0.60         0.59
 technique sam-                                                  applying shear strains.
                                             1.4               0.53        0.52         0.50       0.64      0.62         0.61       0.62        0.62         0.61
       ples
                                            1.19d              0.53    e of0.52
                                                                            M1 under σ n0.51
                                                                                         of        0.63 e of M2
                                                                                                             0.61         0.61
                                                                                                                under σ n of         0.60 e of M30.60
                                                                                                                                                  under σ n of0.60
                Samples                             max
                                                 (mm)             50 kPa     100 kPa                           150 kPa          50 kPa           100 kPa   150 kPa                             50 kPa       100 kPa         150 kPa
     Field sample                                    5
                                                                       Figure 5 shows typical shear stress–shear displacement curves obtained with the
                                                                    0.52        0.51        0.49       0.64       0.63       0.63         0.62        0.62        0.61
                                                   3.36          large
                                                                    0.50 shear box
                                                                                0.49 on the0.48
                                                                                             field and 0.65
                                                                                                        scaled down
                                                                                                                  0.62 samples
                                                                                                                             0.62of M1 (graphs
                                                                                                                                          0.60     on 0.60
                                                                                                                                                       left column),
                                                                                                                                                                  0.60 M2
    Scalping down                                  2.36          (graphs in the center column) and M3 (graphs on right column). One sees that the0.62
                                                                    0.49        0.48        0.48       0.64       0.61       0.61         0.63        0.63          shear
  technique samples                                 1.4             0.52        0.51        0.50       0.63       0.60       0.61         0.60        0.60        0.59
                                                   1.19          stress
                                                                    0.52  and displacement
                                                                                0.50           curves
                                                                                            0.50       of different
                                                                                                       0.63         specimens
                                                                                                                  0.60          of
                                                                                                                             0.60   the same
                                                                                                                                          0.62  material
                                                                                                                                                      0.61under  a  given
                                                                                                                                                                  0.61
                                                   3.36          normal
                                                                    0.51 stress    (σn) have
                                                                                0.50           the same
                                                                                            0.49          variation
                                                                                                       0.62          trend. For
                                                                                                                  0.61       0.60example, 0.60for M10.60under a normal
                                                                                                                                                                  0.59
    Parallel down                                  2.36             0.52 of 50 kPa,
                                                                 stress         0.51 all the0.50       0.63and displacement
                                                                                             shear stress         0.61       0.61
                                                                                                                               curves of0.61          0.60 and parallel
                                                                                                                                            field, scalped        0.59
  technique samples                                 1.4             0.53        0.52        0.50       0.64       0.62       0.61         0.62        0.62        0.61
                                                   1.19          scaled
                                                                    0.53   down   samples
                                                                                0.52        exhibit
                                                                                            0.51     a loose
                                                                                                       0.63   sand-like
                                                                                                                  0.61   mechanical
                                                                                                                             0.61       behavior.
                                                                                                                                          0.60      This
                                                                                                                                                      0.60 indicates
                                                                                                                                                                  0.60that
                                                                 the tested samples are all very loose and their compactness states are close to each other.

                          160                                                               160                                                                                 160
                                    M1, field sample                                                           M2, field sample                                                            M3, field sample

                          120
                                                                                Shear stress (kPa)

                                                                                            120
     Shear stress (kPa)

                                                                                                                                                                                120

                                                                                                                                                           Shear stress (kPa)
                           80                                                                        80                                                                          80

                           40                                                                        40                                                                          40
                                                   Normal stress 50 kPa                                                         Normal stress 50 kPa                                                      Normal stress 50 kPa
                                                   Normal stress 100 kPa                                                        Normal stress 100 kPa                                                     Normal stress 100 kPa
                                                   Normal stress 150 kPa                                                        Normal stress 150 kPa                                                     Normal stress 150 kPa
                            0                                                                         0                                                                           0
                                0           10             20           30                                0              10           20            30                                0            10             20         30
                                     Shear displacement (mm)                                                    Shear displacement (mm)                                                       Shear displacement (mm)

                  120           M1, scalped dmax = 1.19 mm                                 120                                                                           120
                                                                                                                                                                                          M3, scalped dmax = 1.19 mm
                                                                                                              M2, scalped dmax = 1.19 mm
     Shear stress (kPa)

                                                                                Shear stress (kPa)

                                                                                                                                                           Shear stress (kPa)

                          80                                                                         80                                                                          80

                          40                                                                         40                                                                          40

                                                   Normal stress 50 kPa                                                        Normal stress = 50 kPa                                                     Normal stress 50 kPa
                                                   Normal stress 100 kPa                                                       Normal stress = 100 kPa                                                    Normal stress 100 kPa
                                                   Normal stress 150 kPa                                                       Normal stress = 150 kPa                                                    Normal stress 150 kPa
                           0                                                                          0                                                                           0
                                0       5     10          15      20    25                                                                                                            0        5    10       15        20       25
                                    Shear displacement (mm)                                               0        2.5          5          7.5      10
                                                                                                                 Shear displacement (mm)                                                       Shear displacement (mm)
                                                                                          120                                                                        120                  M3, parallel dmax = 1.19 mm
                120                 M1, parallel dmax = 1.19 mm                                               M2, parallel dmax = 1.19 mm
     Shear stress (kPa)

                                                                                Shear stress (kPa)

                                                                                                                                                            Shear stress (kPa)

                          80                                                                         80                                                                         80

                          40                                                                         40                                                                         40
                                                    Normal stress 50 kPa                                                                                                                                Normal stress 50 kPa
                                                    Normal stress 100 kPa                                                     Normal stress = 50 kPa
                                                                                                                                                                                                        Normal stress 100 kPa
                                                    Normal stress 150 kPa                                                     Normal stress = 50 kPa                                                    Normal stress 150 kPa
                          0                                                                                                   Normal stress = 150 kPa                            0
                                                                                                      0
                                0      5     10        15         20    25                                                                                                            0        5    10       15        20       25
                                      Shear displacement (mm)                                             0              5            10            15
                                                                                                                  Shear displacement (mm)                                                    Shear displacement (mm)

                                                                Figure 5. Shear stress vs. shear displacement curves obtained with the large shear box on field
                                                                samples and scaled down samples with dmax value of 1.19 mm for M1 (graphs on left column), M2
                                                                (graphs in the center column) and M3 (graphs on right column).
CivilEng 2022, 3                                                                                                             43

                           2.3. Experimental Results
                                For each sample with three shear stress–shear displacement curves obtained by direct
                           shear tests under three normal stresses, three peak shear strength values can be obtained.
                           A friction angle can then be determined by linear fitting on the three points.
                                Table 5 presents the friction angles of the field, scalping and parallel scaled down
                           samples with different dmax values for the three materials. The average friction angles
                           were then calculated for each sample. Notably, all the friction angles increased as dmax
                           increased, even though the tested waste rocks had sub-angular and sub-rounded shapes
                           (see Figure 1). This trend shows a typical behavior of rounded particle materials, not
                           angular or sub-angular materials. This aspect is further addressed in Section 4.

                           Table 5. Measured friction angles (ϕ) of the field and scaled down samples made of M1, M2 and M3.

                                                  M1                           M2                           M3
          Samples        dmax (mm)
                                         ϕ (◦ )        Avg. ϕ (◦ )    ϕ (◦ )      Avg. ϕ (◦ )      ϕ (◦ )      Avg. ϕ (◦ )
                                          39.5                        38.7                         38.4
        Field sample         5            40.1            39.8        38.6           38.7          38.3           38.5
                                          39.8                        38.9                         38.7
                                          38.7                        37.6                         37.4
                           3.36           39.1            39.0        37.5           37.5          38.1           37.8
                                          39.2                        37.3                         37.8
                                          37.9                        37.3                         37.1
                           2.36           38.4            38.2        37.2           37.0          37.5           37.2
                                          38.2                        36.6                         36.9
       Scalping down
     technique samples                    37.6                        35.4                         36.2
                           1.40           37.2            37.3        35.8           35.6          35.9           35.9
                                          37.1                        35.6                         35.6
                                          37.2                        35.2                         35.9
                           1.19           37.0            37.1        35.5           35.5          35.7           35.6
                                          37.0                        35.7                         35.3
                                          39.0                        37.1                         37.5
                           3.36           38.7            38.6        37.9           37.8          36.8           37.2
                                          38.0                        38.5                         37.2
                                          38.7                        36.2                         37.3
                           2.36           38.1            38.0        36.6           36.6          36.8           36.7
                                          37.2                        37.2                         36.1
       Parallel down
     technique samples                    37.4                        35.5                         36.4
                            1.4           36.9            37.1        35.8           36.0          35.7           36.0
                                          37.1                        36.8                         36.0
                                          37.0                        35.4                         35.9
                           1.19           36.1            36.3        35.9           35.9          35.1           35.5
                                          35.7                        36.5                         35.6

                           3. Validation of Scaling Down Techniques
                                 The friction angles obtained by direct shear tests on scaled down samples prepared
                           by applying scalping and parallel scaling down techniques are first used to establish
                           relationships between friction angle ϕ and dmax values.
                                 Figure 6 shows the variation of the average friction angle as function of dmax for
                           samples M1 (Figure 6a), M2 (Figure 6b) and M3 (Figure 6c). The relationships established by
                           applying curve-fitting technique on the test results of scaled down samples are presented
                           in Table 6. The measured friction angles of field samples are also plotted on Figure 6,
                           whereas the friction angles of the field samples predicted by applying the curve-fitting
                           equations are presented in Table 6. From the figure, one sees that the friction angles of the
                           field samples can be correctly predicted by the curve-fitting equations of scalped samples,
Figure 6 shows the variation of the average friction angle as function of dmax for sam-
                                   ples M1 (Figure 6a), M2 (Figure 6b) and M3 (Figure 6c). The relationships established by
                                   applying curve-fitting technique on the test results of scaled down samples are presented
                                   in Table 6. The measured friction angles of field samples are also plotted on Figure 6,
CivilEng 2022, 3                                                                                                                         44
                                   whereas the friction angles of the field samples predicted by applying the curve-fitting
                                   equations are presented in Table 6. From the figure, one sees that the friction angles of the
                                   field samples can be correctly predicted by the curve-fitting equations of scalped samples,
                                  but
                                   but fail
                                        fail to
                                              to be
                                                 be predicted
                                                    predicted by by the
                                                                     the curve-fitting
                                                                          curve-fitting equations
                                                                                          equations of of parallel
                                                                                                          parallel scaled
                                                                                                                   scaled down
                                                                                                                           down samples.
                                                                                                                                  samples.
                                  These
                                   Theseresults
                                           resultsthus
                                                    thustend
                                                          tendtotoindicate that
                                                                    indicate     thethe
                                                                              that    scalping  scaling
                                                                                         scalping        down
                                                                                                   scaling  downtechnique  cancan
                                                                                                                   technique   be used  for
                                                                                                                                   be used
                                  sample    preparation   in direct  shear  tests, whereas   the  parallel scaling down   technique
                                   for sample preparation in direct shear tests, whereas the parallel scaling down technique         is not
                                  appropriate     for sample
                                   is not appropriate          preparation
                                                         for sample           in direct
                                                                       preparation     inshear
                                                                                          directtests.
                                                                                                 shear tests.

            40                                                                    39              Scalped samples
                                                                                                  Parallel scaled down samples
            39                                                                                    Fied sample
                                                                                  38              Scalping best-fit curve
            38                                                                                    Parallel best-fit curve
                                                                                  37

                                                                           φ (°)
    φ (°)

                                      Scalped samples
            37
                                      Parallel scaled down samples
            36                        Field sample                                36
                                      Scalping best-fit curve
                                      Parallel best-fit curve
            35                                                                    35
                   0   1      2     3  4             5                                  0          1        2      3         4          5
                             dmax (mm)                                      (b)                             dmax (mm)
    (a)
                                            40           Scalped samples
                                                         Parallel scaled down samples
                                                         Field sample
                                            39
                                                         Scalping best-fit curve
                                                         Parallel best-fit curve
                                            38
                                        φ (°)

                                            37

                                            36

                                            35
                                                 0        1      2     3           4          5
                                          (c)                   dmax (mm)
                                  Figure 6. Variations of average φ values as a function of dmax, obtained by direct shear tests on scaled
                                  Figure 6. Variations of average ϕ values as a function of dmax , obtained by direct shear tests on scaled
                                  down and field samples (a) M1, (b) M2 and (c) M3.
                                  down and field samples (a) M1, (b) M2 and (c) M3.
                                   Table 6. The φ values of field samples measured and predicted by applying the scalping and parallel
                                  Table 6. The ϕ values of field samples measured and predicted by applying the scalping and parallel
                                   prediction equations for field samples of M1, M2 and M3.
                                  prediction equations for field samples of M1, M2 and M3.
                           Curve Fitting Equations Based on                        Friction Angle φ (°) of Field Samples (dmax = 5
  Mate- Scaling Down                                                                          Friction Angle ϕ (◦ ) of Field Samples
               Scaling down
                           the Test  Results of Scaled Down
                                  Curve Fitting Equations Based on the
                                                                       R2                                mm)
   rial    Technique                                                                                     (dmax = 5 mm)
  Material       Technique              Samples
                                  Test Results of Scaled Down Samples                R2 Predicted                     Measured
            Scalping         = 1.834718 Ln          + 36.6953         0.97                   39.6Predicted              Measured
   M1             Scalping = 2.045707                                                                                     39.8
     M1     Parallel                      Ln
                                    ϕ = 1.834718    +
                                                   Ln (36.16165
                                                       dmax ) + 36.6953
                                                                      0.86          0.97     39.4 39.6                      39.8
                  Parallel          ϕ = 2.045707 Ln(dmax ) + 36.16165               0.86            39.4
            Scalping         = 2.070025   Ln        + 35.05597        0.96                   38.4
   M2             Scalping          ϕ = 2.070025 Ln(dmax ) + 35.05597               0.96            38.4                  38.7
                  Parallel = 1.749663     Ln        +(d35.46517
     M2     Parallel                                                  0.80                   38.3 38.3                      38.7
                                    ϕ = 1.749663   Ln   max ) + 35.46517            0.80
                       Scalping        ϕ = 2.118069 Ln(dmax ) + 35.24663               0.96              38.7
      M3                                                                                                                         38.5
                       Parallel        ϕ = 1.488585 Ln(dmax ) + 35.4078                0.86              37.8
CivilEng 2022, 3                                                                                                45

                   4. Discussion
                        In this paper, the reliability of scalping and parallel scaling down techniques used to
                   prepare samples for direct shear tests has been evaluated through experimental studies. All
                   the direct tests have been performed by using W/dmax ratios not smaller than 60, a value
                   recently established by Deiminiat et al. [11] to avoid any SSE. Equations were established by
                   applying a curve-fitting technique on the test results of the scaled down sample. They were
                   then used to predict the friction angles for field samples. The comparisons between the
                   measured and predicted friction angles of field samples tended to show that the scalping
                   technique can be used to predict the friction angle of field samples, whereas the application
                   of a parallel scaling down technique cannot guarantee a reliable prediction of the friction
                   angle of field materials. Despite these interesting results, however, the test program was
                   realized with several limitations. For instance, the three samples (M1, M2 and M3) were
                   made of two types of dry waste rocks. The direct shear tests were realized by delicately
                   placing the materials in shear boxes to reach the loosest state. This was to ensure that
                   the variations in the test results are only due to the variation in dmax value for one given
                   material with one chosen scaling down technique. More tests are needed where tested
                   samples are prepared with more materials of different source origins having different
                   particle shapes, initial fine and gravel contents, compactness, and moisture contents under
                   different ranges of normal stresses to determine whether the conclusions are generally
                   valid or only specifically valid for the tested (specific) materials under the tested (specific)
                   conditions. In addition, the differences between the dmax values of scaled down and field
                   samples are not very large. More experimental work is thus necessary, using larger shear
                   boxes with field samples having larger dmax values. The reliability of the replacement
                   scaling down technique can also be studied. In all cases, it is important to note that any
                   new tests should be performed by following the methodology presented in this paper.
                        In this study, the parallel scaled down samples were prepared by considering a given
                   percentage and reducing the ranges of particle sizes. Approximations had to be made for
                   the calculated sizes, which did not have any match with available sieves [33,40,50,65,66,74].
                   In future, the following process of preparation can be considered:
                   •    Calculate the scaled down ratio N;
                   •    Draw the PSDC of the scaled down sample, which is parallel to the PSDC of the field
                        sample in the semi-log plane;
                   •    Determine the percentage of each available sieve.
                         Most previous studies showed a decreasing trend in the friction angle of sub-angular
                   and angular materials as dmax increased [10,15,31,32,40,58,59,62,63,74,80]; however, the
                   experimental results obtained with sub-angular and sub-rounded materials presented in
                   Table 5 and Figure 6 show an increase in the friction angles as dmax increases. This difference
                   is probably due to the fact that most previous experimental studies were realized by using
                   large confining pressures. Large shear stresses were thus necessary to shear the tested
                   samples. Particle crushing during the application of confining and/or shear stresses could
                   be an associated and pronounced phenomenon [34,38,70,81,82]. The decrease in friction
                   angle with increasing dmax was explained by the breakage of rock particles. The strength
                   of rock decreases with specimen size, known as the size effect of rock strength [83–85];
                   therefore, the friction angle of coarse particle materials decreases with increasing dmax
                   values [34]. In this study, however, the maximum value of the normal stresses was 150 kPa.
                   The PSDCs of tested samples before and after shear tests shown in Figure 7 clearly indicate
                   that there was no particle crushing or breakage during and after the application of normal
                   and shear stresses. Size effects of rock strength were not involved. The trend in friction
                   angle obtained in this study corresponded to what is usually observed in practice: at the
                   same compact state, sand usually has a smaller friction angle than rockfill because the
                   former usually has smaller dmax values than the latter.
CivilEng 2022, 3, FOR PEER REVIEW

CivilEng 2022, 3                                                                                                                       46
                                                                  same compact state, sand usually has a smaller friction angle than rockfill becau
                                                                  former usually has smaller dmax values than the latter.

                                                     100
                                                                      Field sample
                                                                      Tested field sample
                                                                      Scalping dmax = 3.36 mm
                                                     80
                                                                      Tested scalping dmax = 3.36 mm
                                                                      Scalping dmax = 2.36 mm
                                   Percent passing                    Tested scalping dmax = 2.36 mm
                                                     60
                                                                      Parallel dmax = 2.36 mm
                                                                      Tested parallel dmax = 2.36 mm
                                                                      Parallel, dmax = 3.36 mm
                                                     40               Tested parallel dmax = 3.36 mm

                                                     20

                                                      0
                                                           0.01                     0.1                       1                         10
                                                                                          Grain size (mm)

                                  Figure 7. PSDCs of Figure
                                                       scaled7. down
                                                                PSDCsand
                                                                       of scaled  down and
                                                                           field samples    field
                                                                                         of M2    samples
                                                                                                before     of lines)
                                                                                                       (solid M2 before  (solid(dashed
                                                                                                                     and after  lines) and  after (dashe
                                                                                                                                        lines)
                                  direct shear tests.direct shear tests.

                                        Finally, because Finally,   because
                                                          scaling down        scaling down
                                                                           techniques are nottechniques
                                                                                              only used inaredirect
                                                                                                               not only
                                                                                                                    shearused
                                                                                                                           tests,inbut
                                                                                                                                    direct
                                                                                                                                       also shear te
                                                    also used in triaxial
                                  used in triaxial compression               compression
                                                                   tests, more            tests,
                                                                                experimental     more experimental
                                                                                               investigation             investigation
                                                                                                              is necessary,  performing   is necessar
                                                    forming
                                  triaxial compression   teststriaxial   compression
                                                                with scaled            tests with
                                                                              down samples         scaled
                                                                                              to test      down of
                                                                                                      the validity  samples   to test
                                                                                                                       the scaling      the validity
                                                                                                                                     down
                                  technique. Of course,
                                                    scalingthe
                                                            downtested  specimens
                                                                     technique.  Ofused  in triaxial
                                                                                    course,           compression
                                                                                             the tested specimenstestsusedmust     be large
                                                                                                                            in triaxial  compressio
                                  enough to avoidmust any be
                                                           SSElarge
                                                                [11].enough to avoid any SSE [11].

                                  5. Conclusions 5. Conclusions
                                        In this study, the   validity
                                                         In this      of the
                                                                  study,  scalping
                                                                              validityandof parallel
                                                                                            scalpingscaling      downscaling
                                                                                                        and parallel      techniques
                                                                                                                                 downusedtechniques u
                                  to prepare samples     for  direct shear   tests  has  been   for  the  first time   evaluated
                                                   prepare samples for direct shear tests has been for the first time evaluated    through through
                                  experimental workimental   work W/d
                                                        by using         max ratios
                                                                    by using   W/dmaxnot  smaller
                                                                                        ratios       than 60.than
                                                                                               not smaller       The 60.
                                                                                                                      testThe
                                                                                                                           results
                                                                                                                              test are thusare thus e
                                                                                                                                   results
                                  exempt from SSE.    TheSSE.
                                                   from     experimental   results show
                                                                The experimental           that
                                                                                      results     the friction
                                                                                               show    that theangles    with
                                                                                                                  friction    scaled
                                                                                                                            angles    down
                                                                                                                                   with   scaled dow
                                  samples prepared     by  both  scalping  and   parallel  scaling   down     techniques    decrease
                                                   ples prepared by both scalping and parallel scaling down techniques decrease       as  the     as
                                  dmax values increase  even
                                                   values      thougheven
                                                            increase   the particle
                                                                            thoughshapes      are notshapes
                                                                                       the particle     rounded.are This  variation trend
                                                                                                                     not rounded.           is
                                                                                                                                    This variation   t
                                  quite different from
                                                   quitethat  presented
                                                          different  fromin the
                                                                             thatliterature,
                                                                                    presentedprobably
                                                                                                 in the due    to the low
                                                                                                          literature,       normaldue
                                                                                                                        probably    stresses
                                                                                                                                         to the low
                                  applied in this study. In addition, the comparisons between the friction angles obtained by
                                                   stresses applied in this study. In addition, the comparisons between the friction
                                  measurements and those predicted by applying curve-fitting equations established on the
                                                   obtained by measurements and those predicted by applying curve-fitting equati
                                  friction angles of scaled down samples indicate that the scalping technique can be used to
                                                   tablished on the friction angles of scaled down samples indicate that the scalpin
                                  predict the friction angle of field samples, whereas the application of parallel scaling down
                                                   nique can be used to predict the friction angle of field samples, whereas the applica
                                  technique cannot guarantee a reliable prediction on the friction angle of field materials.
                                                   parallel scaling down technique cannot guarantee a reliable prediction on the frict
                                                   gle of field materials.
                                  Author Contributions: Conceptualization, L.L. and A.D.; methodology, A.D. and L.L.; formal analy-
                                  sis, A.D. and L.L.; investigation, A.D. and L.L.; writing—original draft preparation, A.D.; writing—
                                                    Author
                                  review and editing,        Contributions:
                                                       L.L. and              Conceptualization,
                                                                 A.D.; supervision,                L.L. and A.D.; L.L.;
                                                                                    L.L.; project administration, methodology,    A.D. and L.L.; form
                                                                                                                        funding acquisition,
                                                    ysis, A.D. and L.L.; investigation, A.D. and L.L.; writing—original draft preparation, A.D.; w
                                  L.L. All authors have read and agreed to the published version of the manuscript.
                                                    review and editing, L.L. and A.D.; supervision, L.L.; project administration, L.L.; funding
                                  Funding: This research   wasAll
                                                    tion, L.L.  funded  by Natural
                                                                   authors have readSciences and Engineering
                                                                                       and agreed              Research
                                                                                                    to the published     Council
                                                                                                                     version      of Canada
                                                                                                                              of the manuscript.
                                  (NSERC RGPIN-2018-06902) and Fonds de recherche du Québec—Nature et Technologies (FRQNT
                                                    Funding: This research was funded by Natural Sciences and Engineering Research Council
                                  2017-MI-202860).
                                                    ada (NSERC RGPIN-2018-06902) and Fonds de recherche du Québec—Nature et Techn
                                  Data Availability(FRQNT
                                                      Statement:  Not applicable.
                                                               2017-MI-202860)
CivilEng 2022, 3                                                                                                                          47

                                   Acknowledgments: The authors acknowledge the financial support from the Natural Sciences
                                   and Engineering Research Council of Canada (NSERC RGPIN-2018-06902), Fonds de recherche du
                                   Québec—Nature et Technologies (FRQNT 2017-MI-202860), and industrial partners of the Research
                                   Institute on Mines and the Environment (RIME UQAT-Polytechnique; http://rime-irme.ca/ (ac-
                                   cessed on 7 December 2021)). Samuel Chenier, Eric Turgeon and Noura El-Harrak are gratefully
                                   acknowledged for their assistance in the laboratory work.
                                   Conflicts of Interest: The authors declare no conflict of interest.

References
1.    ASTM D3080/D3080M-11; Standard Test Method for Direct Shear Test of Soils under Consolidated Drained Conditions (Withdrawn
      2020). ASTM International: West Conshohocken, PA, USA, 2011.
2.    Rathee, R.K. Shear strength of granular soils and its prediction by modeling techniques. J. Inst. Eng. 1981, 62, 64–70.
3.    Palmeira, E.M.; Milligan, G.W.E. Scale effects in direct shear tests on sand. In Proceedings of the 12th International Conference on
      Soil Mechanics and Foundation Engineering, Rio De Janeiro, Brazil, 13–18 August 1989; Volume 1, pp. 739–742.
4.    Cerato, A.; Lutenegger, A. Specimen size and scale effects of direct shear box tests of sands. Geotech. Test. J. 2006, 29, 507–516.
5.    Wu, P.-K.; Matsushima, K.; Tatsuoka, F. Effects of specimen size and some other factors on the strength and deformation of
      granular soil in direct shear tests. Geotech. Test. J. 2008, 31, 45–64.
6.    Mirzaeifar, H.; Abouzar, A.; Abdi, M.R. Effects of direct shear box dimensions on shear strength parameters of geogrid-reinforced
      sand. In Proceedings of the GeoMontreal 2013, Montreal, QC, Canada, 29 September–3 October 2013.
7.    Omar, T.; Sadrekarimi, A. Effect of triaxial specimen size on engineering design and analysis. Int. J. Geo-Eng. 2015, 6, 1–17.
      [CrossRef]
8.    Moayed, R.Z.; Alibolandi, M.; Alizadeh, A. Specimen size effects on direct shear test of silty sands. Int. J. Geotech. Eng. 2016, 11,
      198–205. [CrossRef]
9.    Zahran, K.; Naggar, H.E. Effect of sample size on TDA shear strength parameters in direct shear tests. Transp. Res. Rec. 2020, 2674,
      1110–1119. [CrossRef]
10.   Deiminiat, A.; Li, L.; Zeng, F.; Pabst, T.; Chiasson, P.; Chapuis, R. Determination of the shear strength of rockfill from small-scale
      laboratory shear tests: A critical review. Adv. Civ. Eng. 2020, 2020, 1–18. [CrossRef]
11.   Deiminiat, A.; Li, L.; Zeng, F. Experimental study on the minimum required specimen width to maximum particle size ratio in
      direct shear tests. CivilEng 2021, Submitted.
12.   Drugan, W.; Willis, J. A micromechanics-based nonlocal constitutive equation and estimates of representative volume element
      size for elastic composites. J. Mech. Phys. Solids 1996, 44, 497–524. [CrossRef]
13.   Kanit, T.; Forest, S.; Galliet, I.; Mounoury, V.; Jeulin, D. Determination of the size of the representative volume element for random
      composites: Statistical and numerical approach. Int. J. Solids Struct. 2003, 40, 3647–3679. [CrossRef]
14.   Wen, R.; Tan, C.; Wu, Y.; Wang, C. Grain size effect on the mechanical behavior of cohesionless coarse-grained soils with the
      discrete element method. Adv. Civ. Eng. 2018, 2018, 4608930. [CrossRef]
15.   Gupta, A.K. Triaxial behavior of rockfill materials. Electron. J. Geotech. Eng. 2009, 14, 1–18.
16.   Pankaj, S.; Mahure, N.; Gupta, S.; Sandeep, D.; Devender, S. Estimation of shear strength of prototype rockfill materials. Int. J.
      Eng. Sci. 2013, 2, 421–426.
17.   Honkanadavar, N.P.; Kumar, N.; Ratnam, M. Modeling the behavior of alluvial and blasted quarried rockfill materials. Geotech.
      Geol. Eng. 2014, 32, 1001–1015. [CrossRef]
18.   Amirpour Harehdasht, S.; Hussien, M.N.; Karray, M.; Roubtsova, V.; Chekired, M. Influence of particle size and gradation on
      shear strength–dilation relation of granular materials. Can. Geotech. J. 2019, 56, 208–227. [CrossRef]
19.   Zhang, Z.; Sheng, Q.; Fu, X.; Zhou, Y.; Huang, J.; Du, Y. An approach to predicting the shear strength of soil-rock mixture based
      on rock block proportion. Bull. Int. Assoc. Eng. Geol. 2019, 79, 2423–2437. [CrossRef]
20.   Cai, H.; Wei, R.; Xiao, J.Z.; Wang, Z.W.; Yan, J.; Wu, S.F.; Sun, L.M. Direct shear test on coarse gap-graded fill: Plate opening size
      and its effect on measured shear strength. Adv. Civ. Eng. 2020, 2020, 1–13. [CrossRef]
21.   Nicks, J.E.; Gebrenegus, T.; Adams, M.T. Interlaboratory large-scale direct shear testing of open-graded aggregates: Round one.
      In Proceedings of the IFCEE 2021, Dallas, TX, USA, 10–14 May 2021; pp. 361–370. [CrossRef]
22.   Rasti, A.; Adarmanabadi, H.R.; Pineda, M.; Reinikainen, J. Evaluating the effect of soil particle characterization on internal friction
      angle. Am. J. Eng. Appl. Sci. 2021, 14, 129–138. [CrossRef]
23.   Saberian, M.; Li, J.; Perera, S.T.A.M.; Zhou, A.; Roychand, R.; Ren, G. Large-scale direct shear testing of waste crushed rock
      reinforced with waste rubber as pavement base/subbase materials. Transp. Geotech. 2021, 28, 100546. [CrossRef]
24.   AS 1289.6.2.2; Soil Strength and Consolidation Tests-Determination of the Shear Strength of a Soil-Direct Shear Test Using a Shear
      Box. Standards Australia: Sydney, Australia, 1998.
CivilEng 2022, 3                                                                                                                                48

25.   Eurocode 7; Geotechnical Design-Part 1: General Rules. EN 1997–1. British Standards: London, UK, 2004.
26.   BS 1377. Methods of Test for Soils for Civil Engineering Purposes; Shear Strength Tests (Total Stress); British Standard Institution:
      London, UK, 1990.
27.   Hall, E.B. A triaxial apparatus for testing large soil specimens. In Triaxial Testing of Soils and Bitminous Mixtures; ASTM: West
      Conshohocken, PA, USA, 1951; Volume 106, p. 152. [CrossRef]
28.   Holtz, W.; Gibbs, H.J. Triaxial shear tests on pervious gravelly soils. J. Soil Mech. Found. Div. 1956, 82, 1–22. [CrossRef]
29.   Leslie, D. Large scale triaxial tests on gravelly soils. In Proceedings of the Second Panamerican Conference on Soil Mechanics and
      Foundation Engineering, Sao Paulo, Brazil, 1 July 1963; Volume 1, pp. 181–202.
30.   Marachi, N.; Seed, H.; Chan, C. Strength characteristics of rockfill materials. In Proceedings of the 7th International Conference
      on Soil Mechanics and Foundation Engineering, Mexico City, Mexico, 25–29 August 1969; pp. 217–224.
31.   Marachi, N.D.; Chan, C.K.; Seed, H.B. Evaluation of properties of rockfill materials. J. Soil Mech. Found. Div. 1972, 98, 95–114.
      [CrossRef]
32.   Varadarajan, A.; Sharma, K.G.; Venkatachalam, K.; Gupta, A.K. Testing and modeling two rockfill materials. J. Geotech. Geoenviron.
      Eng. 2003, 129, 206–218. [CrossRef]
33.   Hamidi, A.; Azini, E.; Masoudi, B. Impact of gradation on the shear strength-dilation behavior of well graded sand-gravel
      mixtures. Sci. Iran. 2012, 19, 393–402. [CrossRef]
34.   Ovalle, C.; Frossard, E.; Dano, C.; Hu, W.; Maiolino, S.; Hicher, P.-Y. The effect of size on the strength of coarse rock aggregates
      and large rockfill samples through experimental data. Acta Mech. 2014, 225, 2199–2216. [CrossRef]
35.   Chang, W.-J.; Phantachang, T. Effects of gravel content on shear resistance of gravelly soils. Eng. Geol. 2016, 207, 78–90. [CrossRef]
36.   Yang, G.; Jiang, Y.; Nimbalkar, S.; Sun, Y.; Li, N. Influence of particle size distribution on the critical state of rockfill. Adv. Civ. Eng.
      2019, 2019, 1–7. [CrossRef]
37.   Dorador, L.; Villalobos, F.A. Scalping techniques in geomechanical characterization of coarse granular materials. Obras Proy. 2020,
      28, 24–34. [CrossRef]
38.   Ovalle, C.; Linero, S.; Dano, C.; Bard, E.; Hicher, P.-Y.; Osses, R. Data compilation from large drained compression triaxial tests on
      coarse crushable rockfill materials. J. Geotech. Geoenviron. Eng. 2020, 146, 06020013. [CrossRef]
39.   Kouakou, N.; Cuisinier, O.; Masrouri, F. Estimation of the shear strength of coarse-grained soils with fine particles. Transp. Geotech.
      2020, 25, 100407. [CrossRef]
40.   MotahariTabari, S.; Shooshpasha, I. Evaluation of coarse-grained mechanical properties using small direct shear test. Int. J.
      Geotech. Eng. 2018, 15, 667–679. [CrossRef]
41.   Hennes, R.G. The strength of gravel in direct shear. In International Symposium on Direct Shear Testing of Soils; ASTM: West
      Conshohocken, PA, USA, 1953; Volume 131, pp. 51–62.
42.   Zeller, J.; Wullimann, R. The shear strength of the shell materials for the Go-Schenenalp Dam, Switzerland. In Proceedings of
      the 4th International Conference on Soil Mechanics and Foundation Engineering, London, UK, 12–24 August 1957; Volume 2,
      pp. 399–415.
43.   Morgan, C.C.; Harris, M.C. Portage mountain dam—II materials. Can. Geotech. J. 1967, 4, 142–166. [CrossRef]
44.   Hall, E.B.; Smith, T. Special tests for design of high earth embankments on US-101. In Highway Research Record; University of
      Michigan: Ann Arbor, MI, USA, 1971.
45.   Williams, D.J.; Walker, L.K. Laboratory and Field Strength of Mine Waste Rock; Research Report No. CE 48; University of Queensland:
      Brisbane, Australia, 1983.
46.   Donaghe, R.T.; Torrey, V.H. Strength and Deformation Properties of Earth-Rock Mixtures; No. WES/TR/GL-85-9; Army Engineer
      Waterways Experiment Station Vicksburg, Geotechnical Lab, USACE: Vicksburg, MI, USA, 1985.
47.   Seif El Dine, B.S.; Dupla, J.C.; Frank, R.; Canou, J.; Kazan, Y. Mechanical characterization of matrix coarse-grained soils with a
      large-sized triaxial device. Can. Geotech. J. 2010, 47, 425–438. [CrossRef]
48.   Fragaszy, R.J.; Su, J.; Siddiqi, F.H.; Ho, C.L. Modeling strength of sandy gravel. J. Geotech. Eng. 1992, 118, 920–935. [CrossRef]
49.   Bareither, C.A.; Benson, C.H.; Edil, T.B. Comparison of shear strength of sand backfills measured in small-scale and large-scale
      direct shear tests. Can. Geotech. J. 2008, 45, 1224–1236. [CrossRef]
50.   Lowe, J. Shear strength of coarse embankment dam materials. In Proceedings of the 8th International Congress on Large Dams,
      Edinburgh, UK, 4–8 May 1964; Volume 3, pp. 745–761.
51.   Tombs, S.G. Strength and Deformation Characteristics of Rockfill. Ph.D. Thesis, Imperial College, London, UK, 1969.
52.   Charles, J.A. Correlation between Laboratory Behaviour of Rockfill and Field Performance with Particular Preference to Scam-
      monden Dam. Ph.D. Thesis, Imperial College, London, UK, 1973.
53.   Frost, R.J. Some testing experiences and characteristics of boulder-gravel fills in earth dams. In Evaluation of Relative Density and
      its Role in Geotechnical Projects Involving Cohesion-Less Soils; ASTM International: West Conshohocken, PA, USA, 1973; pp. 207–233.
54.   Donaghe, R.T.; Townsend, F.C. Compaction Characteristics of Earth-Rock Mixtures; Report 1, No. WES-MP-S-73-25-1; Army Engineer
      Waterways Experiment Station Vicksburg: Vicksburg, MS, USA, 1973.
CivilEng 2022, 3                                                                                                                             49

55.   Houston, W.; Houston, S.L.; Walsh, K.D. Compacted high gravel content subgrade materials. J. Transp. Eng. 1994, 120, 193–205.
      [CrossRef]
56.   Donaghe, R.T.; Townsend, F.C. Scalping and replacement effects on the compaction characteristics of earth-rock mixtures. In Soil
      Specimen Preparation for Laboratory Testing; ASTM: West Conshohocken, PA, USA, 1976; pp. 248–277.
57.   Feng, G.; Vitton, S.J. Laboratory determination of compaction criteria for rockfill material embankments. In Proceedings of the
      International Conference on Soil Mechanics and Foundation Engineering, Hamburg, Germany, 6–12 September 1997; Volume 1,
      pp. 485–488.
58.   Varadarajan, A.; Sharma, K.G.; Abbas, S.M.; Dhawan, A.K. The role of nature of particles on the behavior of rockfill material. Soils
      Found. 2006, 46, 569–584. [CrossRef]
59.   Abbas, S.M. Behavior of Rockfill Materials (Based on Nature of Particles); Lambert Academic Publishing: Saarbrücken, Germany, 2011.
60.   Rao, S.V.; Bajaj, S.; Dhanote, S. Evaluations of strength parameters of rockfill material for Pakaldul hydroelectric project,
      Jammu and Kashmir—A case study. In Proceedings of the Indian Geotechnical Conference, Kochi, India, 15–17 December 2011;
      pp. 991–994.
61.   Stober, J.N. Effects of Maximum Particle Size and Sample Scaling on the mechanical Behavior of Mine Waste Rock; A Critical
      State Approach. Master’s Thesis, Colorado State University, Fort Collins, CO, USA, 2012.
62.   Vasistha, Y.; Gupta, A.K.; Kanwar, V. Medium triaxial testing of some rockfill materials. Electron. J. Geotech. Eng. 2013, 18, 923–964.
63.   Honkanadavar, N.P.; Dhanote, S.; Bajaj, S. Prediction of shear strength parameter for prototype alluvial rockfill material. In
      Proceedings of the Indian Geotechnical Conference, Chennai, India, 15–17 December 2016.
64.   Sukkarak, R.; Pramthawee, P.; Jongpradist, P.; Kongkitkul, W.; Jamsawang, P. Deformation analysis of high CFRD considering the
      scaling effects. Geomech. Eng. 2018, 14, 211–224.
65.   Ovalle, C.; Dano, C. Effects of particle size–strength and size–shape correlations on parallel grading scaling. Geotech. Lett. 2020,
      10, 191–197. [CrossRef]
66.   Dorador, L.; Villalobos, F.A. Analysis of the geomechanical characterization of coarse granular materials using the parallel
      gradation method. Obras y Proy. 2020, 27, 50–63. [CrossRef]
67.   Lee, K.L.; Seed, H.B. Drained strength characteristics of sands. J. Soil Mech. Found. Div. 1967, 93, 117–141. [CrossRef]
68.   Charles, J.A.; Watts, K.S. The influence of confining pressure on the shear strength of compacted rockfill. Geotechnique 1980, 30,
      353–367. [CrossRef]
69.   Ramamurthy, T. A geo-engineering classification for rocks and rock masses. Int. J. Rock Mech. Min. Sci. 2004, 41, 89–101.
      [CrossRef]
70.   Wang, Y.; Shao, S.; Wang, Z. Effect of particle breakage and shape on the mechanical behaviors of granular materials. Adv. Civ.
      Eng. 2019, 2019, 1–15. [CrossRef]
71.   Wei, H.; Frossard, E.; Hicher, P.Y.; Dano, C. Method to evaluate the shear strength of granular material with large particles.
      In Proceedings of the Soil Behavior and Geo-Micromechanics, GeoShanghai 2010 International Conference, Shanghai, China,
      3–5 June 2010; pp. 247–254.
72.   Frossard, É.; Hu, W.; Dano, C.; Hicher, P.Y. Rockfill shear strength evaluation: A rational method based on size effects. Géotechnique
      2012, 62, 415–427. [CrossRef]
73.   Xu, Y. Shear strength of granular materials based on fractal fragmentation of particles. Powder Technol. 2018, 333, 1–8. [CrossRef]
74.   Bagherzadeh, A.; Mirghasemi, A.A. Numerical and experimental direct shear tests for coarse grained soils. Particuology 2009, 7,
      83–91. [CrossRef]
75.   Xu, Y.; Williams, D.J.; Serati, M.; Vangsness, T. Effects of scalping on direct shear strength of crusher run and crusher run/geogrid
      interface. J. Mater. Civ. Eng. 2018, 30, 04018206. [CrossRef]
76.   Yaghoubi, E.; Arulrajah, A.; Yaghoubi, M.; Horpibulsuk, S. Shear strength properties and stress–strain behavior of waste foundry
      sand. Constr. Build. Mater. 2020, 249, 118761. [CrossRef]
77.   Lambe, T.; Whitman, R. Soil Mechanics; John Wiley & Sons: New York, NY, USA, 1969.
78.   ASTM C128-15; Standard Test Method for Relative Density (Specific Gravity) and Absorption of Fine Aggregate. ASTM
      International: West Conshohocken, PA, USA, 2015.
79.   ASTM C29/C29M-07; Standard Test Method for Bulk Density (Unit Weight) and Voids in Aggregate. ASTM International: West
      Conshohocken, PA, USA, 2007.
80.   Dorador, L.; Anstey, D.; Urrutia, J. Estimation of geotechnical properties on leached coarse material. In Proceedings of the 70th
      Canadian Geotechnical Conference, Ottawa, ON, Canada, 1–4 October 2017.
81.   Matsuoka, H.; Liu, S. Simplified direct box shear test on granular materials and its application to rockfill materials. Soils Found.
      1998, 38, 275–284. [CrossRef]
82.   Boakye, K. Large In Situ Direct Shear Tests on Rock Piles at the Questa Min, Taos County, New Mexico. Ph.D. Thesis, Institute of
      Mining and Technology, Socorro, NM, USA, 2008.
83.   Li, L.; Aubertin, M.; Simon, R. A multiaxial failure criterion with time and size effects for intact rock. In Rock Mechanics for Industry,
      Proceedings of the 37th US Rock Mechanics Symposium, Vail, CO, USA, 6–9 June 1999; Amadei, B., Kranz, R.L., Scott, G.A., Smeallie,
      P.H., Eds.; A.A. Balkema: Rotterdam, The Netherlands, 1999; Volume 2, pp. 653–659.
You can also read