Evaluating Surface Cleaning Techniques of Stone Tools Using Laser Scanning Confocal Microscopy
←
→
Page content transcription
If your browser does not render page correctly, please read the page content below

Downloaded from https://www.cambridge.org/core. IP address: 46.4.80.155, on 05 Dec 2021 at 02:10:20, subject to the Cambridge Core terms of use, available at https://www.cambridge.org/core/terms. https://doi.org/10.1017/S1551929514000364
Evaluating Surface Cleaning Techniques of Stone Tools
Using Laser Scanning Confocal Microscopy
Danielle A. Macdonald1* and Adrian A. Evans2
1Cultureset Environnements, Préhistoire, Antiquité, Moyen Âge (CEPAM), Centre National de la Recherche Scientifique
(CNRS), Université Nice Sophia Antipolis, Pôle Universitaire, Saint Jean d'Angély, 24, avenue des Diables Bleus,
Nice 06357, France
2Archaeological & Environmental Sciences, School of Life Sciences, University of Bradford, Bradford, BD7 1DP, UK

*danielle.macdonald@cepam.cnrs.fr

Introduction                                                             characterize surface texture by constructing 3D models of surface
     Stone tool use-wear analysis reconstructs how tools were used       features (Figure 1). Quantitative measurements of surface texture,
in the distant past. This is accomplished through the identification     including surface roughness, may be extracted for distinguishing
of microscopic traces of polish, striations, and fractures left on the   polishes from different contact materials. The measurements
tool’s surface. Use-wear analysis is based on the hypothesis that        taken with the LEXT OLS4000 LSCM adhere to ISO25178-2
different contact materials (for example, wood, wheat, or meat)          for the measurement of areal surface features. Objectives lenses
and different motions (for example, cutting, scraping, or drilling)      may include 5×, 10×, 20×, 50×, and 100×. In LSCM, images are
produce distinct microscopic traces on the used tool, including          formed by collecting reflected light from discrete focal planes
microfractures, polish, and striations. Understanding the function       using a pinhole system. In-focus slices from different z-heights
of tools gives archaeologists insight into the behaviors of past         are processed together to create a 3D model of the object’s surface.
peoples, allowing for the reconstruction of ancient ways of life.             Wheat harvesting. In August 2011, harvesting experiments
     Traditional use-wear analysis uses light microscopy to              were conducted in Southern France (organized and directed
visually identify wear traces [1, 2, 3]. However, this qualitative       by Dr. Patricia Anderson, Centre National de la Recherche
analysis can lead to interpretive conflicts between researchers.         Scientifique). The experiments took place over five days, with
In recent years, new methods for measuring use-wear have been            three days dedicated to cutting the field, one day to threshing the
developed that quantify functional traces on stone tools [4–12].         wheat, and one day to winnowing the grain. The harvested field,
Many of these methods quantify the surface roughness of the              located outside the town of St. Vallier de Thiey, was planted with
polished areas, measuring topographic features at small scales           einkorn wheat (Figure 2). This wheat is an early domesticated
to understand variation in surface texture created by contact            species, making it a good analog for ancient harvesting activities.
materials such as antler, meat, and wood.                                     The experimental sickle used for harvesting was modeled
     One method that shows particular promise uses a laser               after an archaeological piece from the Natufian occupation at
scanning confocal microscope (LSCM) (in this case, the OLYMPUS           Kebara Cave (Israel) (Figure 3). The sickle was armed with six
LEXT OLS4000) to characterize surface texture. Outlined here are         chert geometric microlith stone tools (Negev chert) and was
the results of measurements taken with the above instrument to
understand the effects of various cleaning methods on the surface
roughness of experimental stone tools used to cut wheat. Currently,
there is little consensus among use-wear analysts on how to
adequately clean stone tools prior to analysis. Standardization is
integral to the development of use-wear analysis and for continued
research into the quantification of wear traces because it allows for
comparability of the results from different researchers.
     In the research presented here, experimental stone tools were
subjected to three levels of cleaning: (1) with alcohol, (2) alcohol
followed by soap and water, and finally (3) chemical cleaning
with potassium hydroxide (10%) followed by hydrochloric acid
(10%). These three stages of cleaning represent commonly used
techniques of sample preparation and are increasingly invasive.
The results of this study contribute to the standardization of
sample preparation and illustrate the application of LSCM for
archaeological use-wear studies. This article describes measure-
ments that indicate how different commonly used cleaning
protocols affect surface roughness measurements.
Methods                                                                  Figure 1: Three-dimensional image taken with a LSCM of a stone tool used for
     Instrumentation. The use of LSCM is becoming increas-               harvesting wheat. The tool’s edge is oriented toward the bottom of the screen.
                                                                         Polish from wheat contact is represented by the white areas on the tool. Courtesy
ingly popular in archaeological studies of stone tool use-wear
                                                                         of J. Marreiros, J. Gibaja, and N. Bicho, Cambridge Scholars Publishing.
quantification [4, 5, 10]. This method has the ability to

22                                     doi:10.1017/S1551929514000364                           www.microscopy-today.com                   • 2014 May
Downloaded from https://www.cambridge.org/core. IP address: 46.4.80.155, on 05 Dec 2021 at 02:10:20, subject to the Cambridge Core terms of use, available at https://www.cambridge.org/core/terms. https://doi.org/10.1017/S1551929514000364
                   The SPI Supplies Family
                       of Instruments
                                                                                                               1

         2                                3

                                                                                                                         4

     5                                                   6                                             7

 8                                                                                                                                   9

                             Excellence in sample preparation
                                       just a click away... 2spi.com
                 Your results will never be better than       1. Osmium Plasma Coaters                     5. Plasma Prep™ X
                                                                 for FESEM Applications                       Parallel Plate Plasma Etcher
                    your sample preparation. See how          2. SPI-MODULE™                               6. Plasma Prep™ III Plasma Etcher
                                                                 Sputter/Carbon Coater Module                 with PPIII Process Controller
         SPI Supplies can help you deliver the highest        3. Gentle Mill™                              7. Vacu Prep™ II
                                                                 Ion Milling System                           Turbo Pump Evaporation System
            quality results for all your SEM/EDS, TEM         4. Plasma Prep™ III Solid State              8. SPI-DRY™
                              and FESEM applications.            Plasma Cleaner for cleaning TEM holders      Critical Point Dryer
                                                                                                           9. Precision Spin Coater
                                                                                                              Spin coater

                                    SPI Supplies Division of STRUCTURE PROBE, Inc.
                                                     P.O. Box 656 • West Chester, PA 19381-0656 USA

                                         doi:10.1017/
23                  Phone: 1-610-436-5400 • 1-800-2424-SPI (USA and Canada) • Fax: 1-610-436-5755www.microscopy-today.com
                                                                                                  • 2spi.com • E-mail: sales@2spi.com • 2014 January

                                                                                                       S1551929514000364
Downloaded from https://www.cambridge.org/core. IP address: 46.4.80.155, on 05 Dec 2021 at 02:10:20, subject to the Cambridge Core terms of use, available at https://www.cambridge.org/core/terms. https://doi.org/10.1017/S1551929514000364
                                               Surface Cleaning Techniques of Stone Tools

used for approximately 12,000 strokes (approx. 400 minutes).                  wipes, minimizing the transfer of residue from the cloth to
Two microlith inserts from the sickle were chosen to test differ-             the artifact. Once the pieces were cleaned they were scanned
ences in cleaning protocols.                                                  with the confocal microscope using the 20× objective and 50×
     Measurement procedure. Two stone tool inserts from the                   objectives, respectively (Figures 4a and 5a).
sickle were chosen for analysis. In the first stage of analysis,                   For the second stage, the stone tools were cleaned with
the stone tools were cleaned with methyl alcohol and technical                warm water and a mild detergent (nutratek) while being
                                                                              lightly brushed with a soft-bristled toothbrush. After cleaning,
                                                                              they were again scanned in the same location and at the same
                                                                              magnification (Figures 4b and 5b).
                                                                                   During the final stage of the analysis, the stone tools were
                                                                              subjected to chemical cleaning (as outlined by [1]). First they
                                                                              were soaked in a bath of 10% potassium hydroxide (KOH) for
                                                                              10 minutes to remove organic deposits. Following this cleaning,
                                                                              the lithics were soaked in 10% hydrochloric acid (HCL) for
                                                                              10 minutes to remove any mineral deposits. Finally, they were
                                                                              bathed in clean water to remove any remaining chemical traces.
                                                                              Scans were taken of the microliths after the final cleaning stage
                                                                              (Figures 4c and 5c). Thus, the lithics were subjected to increas-
                                                                              ingly invasive cleaning techniques during each stage of analysis.
                                                                                   For each tool, five sampling areas of 30 µm × 30 µm were
                                                                              selected for measurement from the polished surface of the
                                                                              lithic. The same five areas were scanned at each cleaning stage to
                                                                              ensure that the measurements reflected changes in the cleaning
                                                                              technique and not differences in surface topography. An average
                                                                              roughness measurement (Sa) was recorded for each of the five
                                                                              areas using MountainsMap® software produced by Digital Surf.
                                                                              The results of the five scans per tool at each cleaning stage were
                                                                              averaged to generate a mean surface roughness for each tool at
                                                                              each stage of cleaning.
                                                                              Results
                                                                                         After alcohol cleaning. The overall results of the study
                                                                                    indicate that alcohol cleaning is not sufficient for either visual
                                                                                    interpretation of use-wear or for the quantification of polish
                                                                                    surface texture (Figures 4a and 5a). Figure 6 shows that measure-
Figure 2: The author harvesting wheat in a field located outside the town of St.    ments of surface roughness for tool #1 cleaned with alcohol have a
Vallier de Thiey, France.                                                           high variance. For tool #2, the piece had both a high variance and a
                                                                                    high average roughness value (Figure 7). This is likely attributable
                                                                                    to the presence of greases (which have a smooth texture) and
                                                                                    particulate matter (which is rough) along with the texture found on
                                                                                    the worn surface creating a highly variable surface roughness. This
                                                                                    interpretation is further corroborated with the visual assessment
Figure 3: Experimental sickle used for the harvesting experiment. Roughness         of the images, where grease and other particles can be seen on the
measurements were made on two of the chert inserts. Total length = 30.5 cm.         surface. These spots are visible on the highly polished areas of the
Courtesy of J. Marreiros, J. Gibaja, and N. Bicho, Cambridge Scholars Publishing.
                                                                                    tool and appear as gray spots on the surface (Figures 4a and 5a).
                                                                                                                       After soap and water. Cleaning
                                                                                                                  the tool with a detergent removed the
                                                                                                                  grease and much of the particulate
                                                                                                                  residue, resulting in measurements
                                                                                                                  with lower variance for both tools.
                                                                                                                  Small striations resulting from the
                                                                                                                  cutting motion are now visible on the
                                                                                                                  surface, which were not visible when
                                                                                                                  the tool was cleaned with only alcohol
                                                                                                                  (Figure 4b). For tool #2, the mean
                                                                                                                  roughness of the polished area for the
Figure 4: LSCM images of stone tool #1. (a) cleaned with alcohol, (b) cleaned with soap and water, (c) cleaned tool cleaned with detergent was signif-
with KOH (10%) and HCL (10%). In image (a), a grease spot is indicated by a red arrow. The red arrow in image (b) icantly lower than the mean roughness
highlights a fine striation produced by cutting motions. Scale = 40 µm.
                                                                                                                  for alcohol cleaning, suggesting that

24                                                                                                 www.microscopy-today.com               • 2014 May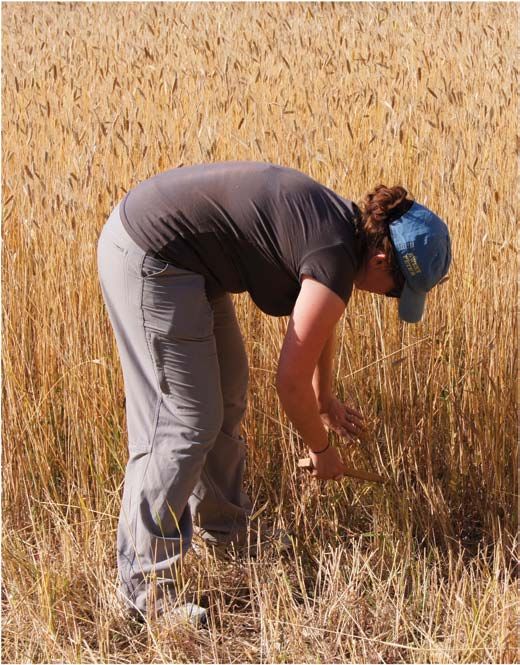
Downloaded from https://www.cambridge.org/core. IP address: 46.4.80.155, on 05 Dec 2021 at 02:10:20, subject to the Cambridge Core terms of use, available at https://www.cambridge.org/core/terms. https://doi.org/10.1017/S1551929514000364
Surface Cleaning Techniques of Stone Tools
variation is reduced considerably in
the surface roughness measurement
of the chemically cleaned pieces. This
is particularly evident in tool #1, where
there is a clear reduction in the variance
of the surface roughness between the
surface cleaned with nutratek and the
surface cleaned with chemicals. It is
interesting to note that there is little
difference in mean surface roughness
between the cleaning with detergent
Figure 5: LSCM images of stone tool #2. (a) cleaned with alcohol, (b) cleaned with soap and water, (c) cleaned with and cleaning with chemicals for tool
KOH (10%) and HCL (10%). Scale = 100 µm.
#2, suggesting that the soap cleaning
was sufficient for this particular tool.
Discussion
It is important to develop standards for analysis as
new methods for the quantification of stone tool use-wear
analysis are developed. Currently, there is no consensus among
researchers on how to adequately prepare and clean stone tool
samples prior to analysis. The results presented here show that
differences in cleaning practices do have an effect on measured
surface texture. In addition, visual differences can be seen
between the different cleaning stages, particularly for visible
grease and particles on the tools cleaned with alcohol. This
highlights sample preparation as an important area of method-
ological research for use-wear analysis.
The measurements for both tools cleaned with alcohol show
the highest average roughness measurements and the most
variance. This suggests that there is still a large amount of partic-
ulate matter adhering to the surface of the tools. The average
roughness (Sa) measurements for tool #2 show that there is little
Figure 6: Average roughness (Sa) values for stone tool #1 after alcohol, nutratek,
and chemical cleaning.
difference between the average roughness of the tool cleaned with
nutratek and the tool cleaned with chemicals. This indicates that
the surface probably was not chemically altered by the acid/alkali
cleaning procedure because the roughness values did not change
between the two measurements. However, the measurements
from tool #1 indicate that average roughness was lowered when
the tool was chemically cleaned. Because the results from tool
#2 indicate that the chemical cleaning did not alter the surface
roughness, the authors suggest that the changes in measurements
of tool #1 are from the removal of particulate matter adhering to
the surface that was not removed with other cleaning methods.
Therefore, to ensure that surface texture is properly
measured when doing quantitative use-wear analysis, we
would recommend acid/alkali cleaning prior to imaging for
metrological purposes. Clear differences in the measurements
between detergent cleaning and chemical cleaning in tool #1
suggest that chemicals are needed to remove all adhering
materials from the lithic surface. However, for visual assessment
the tools cleaned with soap and water provided adequate
cleaning if chemical facilities are not available.
Figure 7: Average roughness (Sa) values for stone tool #2 after alcohol, nutratek,
and chemical cleaning. Conclusion
This case study presents a new application of laser scanning
foreign material was removed from the surface, resulting in a confocal microscopy for the measurement of stone tool surfaces,
less variable texture (Figure 7). contributing to the standardization of use-wear analysis. The
After chemical treatment. Finally, the surfaces cleaned cleaning techniques presented here can now be applied to
with the acid and alkali method appear free from small archaeological assemblages to gain a better understanding of
particulate matter (Figures 4c and 5c). Thus, the texture past behaviors through stone tool use.
2014 May • www.microscopy-today.com 25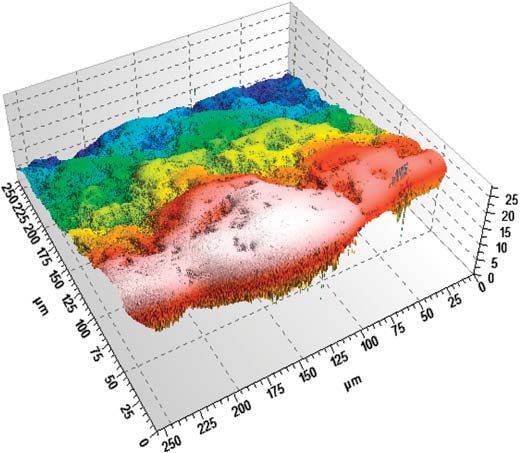
Downloaded from https://www.cambridge.org/core. IP address: 46.4.80.155, on 05 Dec 2021 at 02:10:20, subject to the Cambridge Core terms of use, available at https://www.cambridge.org/core/terms. https://doi.org/10.1017/S1551929514000364
                                         Surface Cleaning Techniques of Stone Tools

Acknowledgements
     The authors thank Richard Leach (National Physical
Laboratory, UK) for use of the OLYMPUS LEXT OLS4000 and
his ongoing collaboration. Danielle Macdonald thanks Patricia
Anderson for inviting her to be part of the experimental
harvesting work during the summer of 2011. Macdonald’s
work on this project was supported by a University of Toronto
School of Graduate Studies Travel Grant.
References
 [1] L Keeley, Experimental Determination of Stone Tool Uses:
     A Microwear Analysis, The University of Chicago Press,
     Chicago, 1980.
 [2] SA Semenov, Prehistoric Technology: An Experimental Study
     of the Oldest Tools and Artifacts from Traces of Manufacture
     and Wear. Barnes & Noble, New Jersey, 1964.
 [3] R Tringham et al., J Field Archaeol 1(1/2) (1974) 171–96.
 [4] AA Evans and DA Macdonald, Scanning 33(5) (2011)
     294–303.
 [5] AA Evans and RE Donahue, Journal Of Archaeological
     Science 35(8) (2008) 2223–30.
 [6] N Faulks et al., Scanning 33(5) (2011) 304–15.
 [7] WJ Stemp et al., Lithic Technology 33 (2008) 173–89.
                                                                       SPECTROSCOPY OF MICROSCOPIC SAMPLES
                                                                        CRAIC Technologies UV-visible-NIR microscopes and microspectrophotometers are
 [8] WJ Stemp et al., Archaeometry 3(366-382) (2009).                   used for imaging and spectral analysis of sub-micron sized features with absorbance,
 [9] WJ Stemp and S Chung, Scanning 33(5) (2011) 279–93.                reflectance, fluorescence, emission and polarized illumination. Capabilities include
[10] WJ Stemp, HJ Lerner, and EH Kristant, Scanning 35(1)               film thickness measurements, colorimetry and high resolution imaging in the UV,
     (2013) 28–39.                                                      visible and NIR regions. Rapid & accurate spectra & images of microscopic
[11] WJ Stemp and M Stemp, Journal Of Archaeological                    samples: The Perfect Vision for Science™.
     Science 30(3) (2003) 287–96.
[12] WJ Stemp and M Stemp, Journal Of Archaeological                    For more information, call 877.UV.CRAIC or
                                                                        visit our website at www.microspectra.com
     Science 28(1) (2001) 81–88.
                                                                        ©2011 CRAIC Technologies, Inc. San Dimas, California (USA).

                                                                Craic_QtrPg_McrscpyAnaly.indd 1                                                3/22/11 9:49:40 AM

26                                                                                                 www.microscopy-today.com                  • 2014 May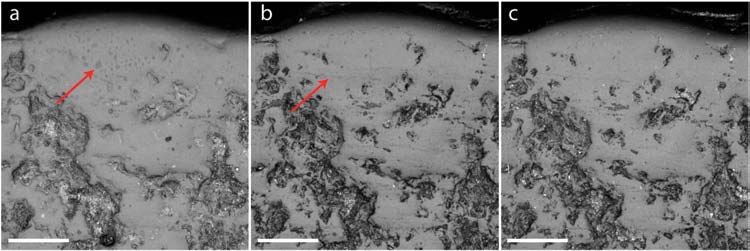
Downloaded from https://www.cambridge.org/core. IP address: 46.4.80.155, on 05 Dec 2021 at 02:10:20, subject to the Cambridge Core terms of use, available at https://www.cambridge.org/core/terms. https://doi.org/10.1017/S1551929514000364
                 The 120kV TEM of choice.

              JEOL has sold more than 2400 120kV TEMs world-
              wide. Our latest generation features high resolution/
              high contrast imaging, outstanding S/TEM analytical
              capabilities, elemental mapping with the latest large
              area SDD detectors, cryomicroscopy, 3D tomography,
              and montaging. Everything you’ve come to like about
              JEOL, and then some.

              Contact us for more information on this research
              grade, flexible TEM. Need more? We offer a full line of
              TEMs from 120kV – 300kV. You’ll like our applications
              and service support, too.

*   **   **

                         Solutions for Innovation

                                      * Courtesy of Appalachian State University
                                  ** Courtesy of the Marc Lab, University of Utah

                                   Learn more at jeolusa.com/plus
You can also read


