Edge Robotics: Edge-Computing-Accelerated Multi-Robot Simultaneous Localization and Mapping - arXiv
←
→
Page content transcription
If your browser does not render page correctly, please read the page content below
1
Edge Robotics: Edge-Computing-Accelerated
Multi-Robot Simultaneous Localization and Mapping
Peng Huang† , Liekang Zeng† , Xu Chen, Ke Luo, Zhi Zhou, Shuai Yu
Abstract—With the wide penetration of smart robots in multi-
farious fields, Simultaneous Localization and Mapping (SLAM)
technique in robotics has attracted growing attention in the
community. Yet collaborating SLAM over multiple robots still
remains challenging due to performance contradiction between
arXiv:2112.13222v2 [cs.RO] 24 Jan 2022
the intensive graphics computation of SLAM and the limited
computing capability of robots. While traditional solutions resort
to the powerful cloud servers acting as an external computation
provider, we show by real-world measurements that the signif-
icant communication overhead in data offloading prevents its
practicability to real deployment. To tackle these challenges,
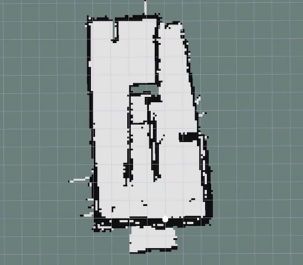
this paper promotes the emerging edge computing paradigm (a) Example apartment scene (b) The corresponding map gen-
into multi-robot SLAM and proposes RecSLAM, a multi-robot with ten robots. erated by RecSLAM.
laser SLAM system that focuses on accelerating map construction
process under the robot-edge-cloud architecture. In contrast to Fig. 1: An example multi-robot SLAM application at the edge,
conventional multi-robot SLAM that generates graphic maps on where the robots are navigated to walk in the apartment (a)
robots and completely merges them on the cloud, RecSLAM and perform SLAM to construct the corresponding geometric
develops a hierarchical map fusion technique that directs robots’ indoor map (b).
raw data to edge servers for real-time fusion and then sends to
the cloud for global merging. To optimize the overall pipeline, an
efficient multi-robot SLAM collaborative processing framework
is introduced to adaptively optimize robot-to-edge offloading by cameras to reckon geometric graphics. It strives to exploit
tailored to heterogeneous edge resource conditions, meanwhile
ensuring the workload balancing among the edge servers. Ex- the 2D visual input to construct 3D semantic models. Laser
tensive evaluations show RecSLAM can achieve up to 39.31% SLAM forks another technical path that extracts data from
processing latency reduction over the state-of-the-art. Besides, laser scans to shape a grid occupancy map. Particularly, laser
a proof-of-concept prototype is developed and deployed in real data differs from visual images by containing depth-wise
scenes to demonstrate its effectiveness. information and high-precision positions of objects. Benefited
Index Terms—Edge intelligence, multi-robot laser SLAM, edge by such advantage in sources, laser SLAM is preferred and
offloading, distributed and parallel processing. employed for a much wider spectrum of robotic applications
for achieving much higher physical accuracy [13].
I. I NTRODUCTION The widespread use of smart robots catalyzes SLAM to
S a key enabling technology in robotics, Simultaneous extend its deployment over multiple robots [14]–[16]. Specif-
A Localization and Mapping (SLAM) is a computationally-
intensive approach that targets at simultaneously constructing
ically, a group of robots is deployed in a swarm manner,
and they are committed to cooperating with each other in
a graphic map and tracking the agent’s location in an unknown an unknown environment in order to construct the geometric
environment [1]–[3]. It has been broadly used across a number mapping and determine their own locations through SLAM.
of applications, opening a wide door to smart robots for An example scenario is to build the graphic maps of an
understanding and interacting with environments wherever apartment as shown in Fig. 1, where multiple robots are
indoor, aerial, or underground. For example, in autonomous employed to perform SLAM simultaneously for global map
robotics, SLAM has been employed to process the surround- construction. Another example is in mission-critical Search
ing information from laser scans to guide the self-contained and Rescue (SAR) tasks [14], [15], where multiple robots are
navigation [4]–[7]. In disaster relief, snakelike robots apply driven collaboratively to share map data with each other for
SLAM to explore fragile buildings and carry out a rescue in rapid exploration in broken buildings. In these circumstances,
human-unreachable places [8]–[10]. traditional wisdom [17]–[19] to reconcile the distributed data
Generally, SLAM can be categorized into two classes ac- sources calls for robot-cloud synergy, where robots run SLAM
cording to the used sensors, namely visual SLAM [11] and individually and upload their local map mutually to a central-
laser SLAM [12]. Visual SLAM utilizes the images captured ized cloud server for global merging. Yet the two-tier architec-
ture suffers from dual drawbacks. On the one hand, processing
† The two authors contributed equally to this work. SLAM workloads locally on commodity robots typically de-
The authors are with the School of Computer Science and Engineer- mand plenty of latency and can even fail to complete under
ing, Sun Yat-sen University, Guangzhou, Guangdong, 510006 China, e-
mail: {huangp57, zenglk3, luok7}@mail2.sysu.edu.cn, {chenxu35, zhouzhi9, resource constraints, e.g. limited memory capacity. In our
yushuai}@mail.sysu.edu.cn. The corresponding author is Xu Chen. measurements on an ordinary robot (as will be shown in Sec.
2

II-B), running SLAM can force CPU workload at a high level simulation platforms and real robots. Simulation results show
consistently (always >83.60%), leading to excessive latency that our system can outperform the state-of-the-art solutions
in on-device execution. Such significant and excessive latency by up to 39.31% latency reduction. The proof-of-concept
impedes many multi-robot applications (e.g., disaster relief and prototype in an indoor scene corroborates its feasibility and
high-resolution autonomous navigation) that generally demand efficiency, demonstrating the promising advantage of edge-
real-time information fusion. On the other hand, transferring accelerated SLAM. In summary, we make the following key
robots’ local maps of a large volume to the remote cloud contributions:
through the unreliable and delay-significant wide-area Internet • We conduct a fine-grained investigation on the process-
connection not only incurs the communication bottleneck but ing costs of existing SLAM processing solutions. The
raises users’ concerns on security and privacy. Quantitatively, robotics-based measurements reveal that the cloud of-
as we will show later, the data uploading time overhead can floading mechanism suffers from the considerable trans-
dominate the whole processing in common 4G, 5G and WiFi mission latency in sensory data uploading, while the
networks, exhibiting vulnerable performance. local execution falls short at efficiency due to the limited
 To remedy these limitations, this paper intends to leverage onboard computing resource.
the emerging edge computing [20]–[22] paradigm to perform • We propose RecSLAM, a collaborative SLAM system
multi-robot laser SLAM in low latency. Instead of relying on based on hierarchical robot-edge-cloud architecture to
geographically distant data centers, edge computing concen- enable real-time SLAM serving. RecSLAM decouples the
trates on utilizing vicinal computing resources (e.g., 5G/WiFi conventional SLAM pipeline to distribute them to multi-
edge severs) in physical proximity to end devices, and there- ple edge servers, where each robot can selectively offload
fore remarkably shortens data communication distance, lowers their raw frames to one of the edge servers and the edge
offloading transmission delay, and allows the advanced qual- server can fuse multiple frames ahead of global merging.
ity of services [23], [24]. Nevertheless, enabling multi-robot By extending the centralized computation to distributed
SLAM with edge computing architecture is non-trivial with and parallel processing, RecSLAM significantly improves
three-fold challenges. First, the spatially distributed nature of the utilization of edge resources.
multi-robot deployment requires a unified flow for data collec- • We develop a novel graph based framework to optimize
tion, organization, and computation due to the versatile sources the collaborative SLAM processing between robots and
as input. For instance, to collect data from two physically edge servers. Specifically, we separate the workflow into
isolated robots, the edge server needs to identify their source two stages, namely robot data grouping and edge offload-
location, timestamp, and sensory format (e.g., raw data from ing. For robot data grouping, we abstract an undirected
whether laser scan or IMU sensors). Second, distributing the graph to describe the distributed robot data processing is-
map fusion, which is traditionally centralized processed, to sue with workload-balancing among the edge servers, and
multiple edge servers desires a retrofit on handling SLAM apply an efficient balanced graph partitioning algorithm
maps, which is intractable under resource dynamics. Third, to make a balanced robot data grouping for offloaded
simultaneously orchestrating the computation and communica- processing at the edge. For edge offloading, we devise an
tion among multiple robots and multiple edge servers presents efficient resource-aware collaborative processing strategy
inherent complexity in formulation and optimization on SLAM to adaptively offload the grouping data from the robots
execution and data transmission. Furthermore, the network to the proper edge servers, in order to minimize the total
dynamics among robots and edge servers further complicate processing latency.
the problem. • We implement and evaluate RecSLAM in both simu-
 To tackle these challenges, this paper proposes RecSLAM, a lation and realistic deployment. The simulation on the
system built upon the Robot-edge-cloud architecture to enable Gazebo [25] platform demonstrates the effectiveness of
multi-robot laser SLAM in low-latency services. RecSLAM’s RecSLAM and its collaborative processing algorithms,
design is motivated by the observations on real-world mea- showing up to 39.31% latency speedup upon cloud of-
surements that 1) migrating SLAM workloads from robots to floading approach. The realistic prototype on three robots
edge servers can effectively augment the robots’ processing in an indoor experimental scene verifies its feasibility and
capability, and 2) preparative merging a subset of local maps validity in rendering efficient SLAM services for edge
at the edge can shrink the sizes of data to be uploaded to applications.
the cloud and therefore further reduces communication costs. The rest of this paper is organized as follows. Section II
By exploiting them, RecSLAM considers a hierarchical robot- characterizes the existing multi-robot SLAM solution. Section
edge-cloud pipeline, where each robot individually collects III, IV and V present the design, optimization and implemen-
data and selectively transfers them to one of the edge servers. tation of the proposed system. Section VI evaluates in terms
The edge servers commit to performing SLAM on their of both simulation and prototype. Section VII reviews related
received robot data, merging the corresponding local maps, works and Section VIII concludes.
and uploading the preparative fusion results to a dedicated
cloud server for global map fusion. An adaptive coordinator
(i.e., task scheduler) is further developed to optimize the data II. BACKGROUND AND M OTIVATION
flow between robots and edge servers, aiming at minimizing This section dives into multi-robot SLAM processing by
the end-to-end latency. We implement RecSLAM on both characterizing the state-of-the-art cloud-based solution. We
3

 Robot 2
 1.029,
 3.212,
 Robot 1 Cloud
 2.233,
 4.123, Map Global
 Laser Data SLAM Internet
 0.392, SLAM Collection Fusion
 Scan field 5.231, Laser scan
 9.982,
 Robot ... IMU Data Robot Global Map
 Map

 ...
 Laser scan
 raw data SLAM result map
 Apartment sence

Fig. 2: The illustration of a typical SLAM computation. The Fig. 3: The pipeline of the traditional cloud-based multi-
example scenario covers several robots that run simultaneously robot SLAM solution, where the robots performs SLAM
to sketch an indoor map for the apartment, where each robot is individually and upload their data via Internet to a centralized
represented by a dot and its scan field is abstracted as a sector. cloud server for global map fusion.
A robot walks intentionally to acquire the environment’s laser
scan data, in the form of a floating-point vector, and passes it to
the local SLAM computation module to generate a geometric 4G
grid map.
 5G
 Cloud execution
first briefly introduce its workflow, and next break down the WiFi Communication
 Robot execution
component-wise performance, which reveals the opportunities 0 1 2 3 4 5 6 7
and challenges of edge computing. Latency (s)

 Fig. 4: The latency breakdown of a cloud-based multi-robot
 SLAM solution. The communication latency contributes a
A. Multi-Robot SLAM major portion out of the total and is sensitive the networking
 Simultaneous Localization And Mapping (SLAM) is typi- condition.
cally run at a robot with various sensors equipped, aiming at
simultaneously localizing the robot itself and maintaining a
graphic map of the environment [26]. Fig. 2 shows a typical B. Performance Implications of State-of-The-Art
scenarios of SLAM computation. The input to SLAM is the State-of-the-art cloud-based solutions highly rely on the
sensory data from robots in a form of floating-point vectors, Internet to gather local frames from distributed robots, which
which describe the scanning angle, laser distance, etc. The makes it sensitive to the vulnerable network. To make a clearer
output is an occupancy grid map, where the black grids are understanding of how the network conditions impact, we
obstacles, the whites represent available safe space and the explicitly examine the costs of a typical cloud serving process.
grays mean the places that have not been detected or uncertain. Specifically, we deploy a multi-robot SLAM prototype using
 Multi-robot SLAM is an extended use case of single- three Turtlebot3 and a cloud server, aiming at measuring
robot SLAM, which manages a cluster of robots to perform the duration from laser scan input at robots to a global
SLAM for constructing a virtual graphic sense corresponding map obtained on the cloud. The Turtlebot is equipped with
to reality [27]. Its core procedure beyond single-robot SLAM Raspberry Pi as the processing core, which has 1.4GHz ARM
is the map fusion procedure that merges multiple grid maps to Cortex-A53 CPUs, 1GB LPDDR2 without GPU. The cloud
yield a global map of the targeted scene. Given that grid maps server is with Intel Xeon CPU E5-2678, deployed at the
are collected from multiple distributed robots, state-of-the- available region that robots locate. The robots contact the cloud
art solutions [17]–[19] resort to the centralized cloud server via three channels: 3G, 4G, and WiFi, all are under commercial
to fulfill map fusion, as illustrated in Fig. 3. Particularly, it operation networks.
works in two stages. First, each robot collects sensory data and Fig. 4 visualizes the measurements, where the latency
individually performs SLAM locally. Next, they upload their breaks down in robot computing, frames uploading, and cloud
local SLAM result, i.e., grid maps, to the cloud, where all these merging. We can witness that the total latency is highly
maps are merged to acquire a global map. Specifically, two sensitive to the channel switching with an increase from
local maps that share an overlapping area will be fused, while about 3.83s (WiFi) to 5.36s (5G). Looking closer, we observe
those independent ones will be simply appended to constitute that such cost fluctuation comes from the communication
the global map. This global map can be used for downstream side, which dramatically varies under different network condi-
tasks such as navigation and furniture design. tions. Concretely, the uploading latency takes 3.13ms, 2.35ms,
 Multi-robot SLAM has been widely adopted in a broad 1.88ms for 4G, 5G, and WiFi, respectively.
range of scenarios. For example, some indoor mapping ser- Another expensive workload revealed is the local computing
vices employ multiple robots to scan the house and perform cost. To compute SLAM at the robot consumes around 1.51s,
multi-robot SLAM to construct a 3D graphic model that shapes occupying a percentage of 49.74% in total latency under
the indoor environment [15]. In some geographical mapping WiFi channel. To inspect the cause behind that, we log the
applications, many robots are run to scan landforms and build background load level on robots and plot the trace as in Fig.
topographic maps [17]. 5. As shown in the figure, the trajectory of the load always
4

 100 hierarchical robot-edge-cloud architecture to accelerate multi-

 Robot load level (%)
 90 robot map construction. We present the design of RecSLAM
 80
 by explaining its modular details following the data flow.
 70

 mean: 93.82%
 A. Overview
 60
 min: 83.60%
 50
 The environment we envisaged to deploy RecSLAM spans
 0 20 40 60 80 100 multiple robots with laser scans and multiple edge servers
 Timestamp (s)
 in proximity. The robots can walk randomly or along with a
Fig. 5: The monitored background load level during SLAM preset route, and therefore their sensory data are time-varying
runtime on the robot. The load curve consistently lies at a high and may be overlapped in some moments. The edge servers
level with a minimum of 83.60% and an average of 93.82%, can accept data from robots simultaneously and promise to be
indicating the robot is overloaded. available during an epoch of execution.
 RecSLAM works upon robot-edge-cloud architecture and
 designs specific modules in each tier. Fig. 6 shows a high-level
goes on top of 80%. It records an average of 93.82% and
 view of RecSLAM. In the beginning, each robot captures en-
a minimum of 83.60%, sometimes even reaching 100.00%,
 vironmental perceptions via its installed sensors and acquires
indicating that the robot is overloaded and can not sufficiently
 the raw sensory data. In RecSLAM, we mainly consider two
support the local SLAM computation.
 kinds of typical data: laser data from the laser scans and
 In summary, the existing cloud-based solution suffers from
 acceleration data from the Inertial Measurement Unit (IMU).
dual bottlenecks. One is the inherent communication bottle-
 Instead of running SLAM locally in a traditional mechanism,
neck from the remote Internet transmission that stresses the
 we immediately pack the sensory data and offload it to a
local frame uploading process between robots and the cloud.
 certain edge server. When it accepts a data package, the
The other is the resource-hungry SLAM computation tasks,
 edge server launches the SLAM execution and obtains a map
conflicting with the limited computing capability of the robots.
 corresponding to it. For clarity, we identify this map as local
The integration of these two knobs makes the cloud serving
 map or robot map, indicating a direct mapping to a robot’s
fall short in rendering low latency multi-robot SLAM, desiring
 raw data. For an edge server that serves multiple robots, a
a holistic retrofit on the execution pipeline.
 sequence of the local maps are generated and will be merged
C. Opportunities and Challenges with Edge Computing in situ to an edge map. This merging process is referred to as
 preparative fusion, as it is a preparatory action towards global
 To tackle the knobs of cloud-based approaches in both data fusion in the cloud. All the edge maps from distributed edge
offloading and robot computing, we promote edge computing servers are finally merged in a centralized cloud to calculate
to enable multi-robot SLAM processing. Edge computing the global map.
sinks computing power to the physical proximity to the robots
and thereby provides a potential assist to greatly reduce the
computation stress for robots while significantly lowering the B. Robots: Data Collection and Packing
transmission latency compared to cloud offloading paradigms As discussed in Section II-B, one of the performance
[21]. bottlenecks is the excessive computing latency on robots,
 With edge computing, there are opportunities to redesign the which comes from the contradiction between resource-hungry
multi-robot map fusion pipeline to accomplish both efficient SLAM computation and resource-constrained on board pro-
SLAM computation and low latency transmission. Specifically, cessors. To alleviate this, we propose to reserve only the
we can utilize the distributed edge servers to take over the lightweight data collection procedure on robots. Specifically,
workload from both robots and the cloud, acting as agents to in our implementation, the sensory data to be collected are
resolve the processing bottlenecks smoothly. laser data and IMU data. The former is a structure named
 Nevertheless, different from the cloud data center that sensor_msgs::LaserScan, including timestamp, range data,
provides unified, powerful, and closed resource access, edge angular distance and so on, while the latter contains infor-
servers exhibit a loosely coupled and uneven nature: they are mation for coordinates’ transformation. Though our current
usually distributed, heterogeneous, and dynamic. To orches- deployment only takes these two types of sensory data into
trate the serving between robots, edge servers, and cloud, account, it is convenient to accommodate additional formats
the communication protocol should be carefully designed in RecSLAM.
considering data transmissions in robot-to-edge, edge-to-edge, To offload the SLAM computation, we pack these raw
and edge-to-cloud. Besides, the workload balance among the data and transfer them to edge servers through Robot Op-
multiple edge servers, as another impacted aspect related to the erating System (ROS). Particularly, each robot establishes a
overall performance, should also be taken into account given connection and offloads its data to exactly one edge server,
the network dynamics. while each edge server can serve multiple robots at the same
 time. Here we assume that these connections are relatively
 III. R EC SLAM S YSTEM D ESIGN well and stable, which can be relevant [28], [29] provided
 In this section, we introduce the design details of Rec- that they are within the same LAN. Therefore, the mobility
SLAM, a multi-robot laser SLAM system that leverages of robots will not influence the data transmission and the
5

 Robot 2 Edge Server 2
 Robot 1 Edge Server 1 Cloud
 Preparative Map Global
 Laser Data Packing SLAM Internet
 Fusion Collection Fusion
 Laser scan
 IMU Data Robot Edge Map EdgeMap
 Edge Map Global Map
 Map Edge Map

 ... ...
Fig. 6: RecSLAM architecture overview. Each robot individually collects its sensory data and directly packs and transfers to
a dedicated edge server. Each edge server runs SLAM using the received data and performs a preparative fusion to aggregate
an edge map with its owned robot maps. All the edge maps will be sent to a centralized cloud for global map fusion.

consequent procedures. We note that in realistic deployment D. Cloud: Aggregated Fusion for Global Map
the robot-edge communication may be fluctuated and even fail, The cloud is responsible to collect all edge maps from edge
which raises robustness issues in multi-robot SLAM system. servers. We designate the cloud as the destination of final
To address that, we can leverage multi-access mobile edge merging because a large number of downstream applications
computing [30]–[32] to enable partial offloading, where a of SLAM are deployed on the cloud. However, if some service
robot can transfer its data to multiple edge servers to ensure needs to deploy a SLAM-based task on end devices, we can
service availability and improve system performance. expediently assign an edge server to finish global fusion and
 push the result to the specific device.
C. Edge Servers: Preparative Fusion for Edge Maps In the robot-edge-cloud architecture of RecSLAM, each
 edge server runs its SLAM and preparative fusion individually
 The robots can access a set of edge servers in proximity via as long as it receives the robot data, which implies a parallel
5G/WiFi connections, and the edge servers, take charge of the and distributed processing paradigm among the edge servers.
SLAM computation and assisting the map fusion. Each edge To optimize the performance in such workflow, we need to
server accepts raw data from multiple robots nearby and sends carefully decide on a robot data processing assignment strategy
its result to a cloud. with a target of balanced workload distribution among the edge
 The SLAM computation is inherently tightly coupled. If servers to avoid the straggler effect. Nevertheless, this problem
it is forced to split, the explosive complexity would lead is non-trivial in its two-fold challenges. First, the overlapping
to additional overhead in handling the graphic algorithms. degrees (i.e., information redundancy) across the robot maps
Therefore, we treat the SLAM computation as a whole by (wrt. the robot’s sensory data) vary greatly among the robots
encapsulating it as a function module for processing the given the mobility and randomness of the robots’ walk, while
raw data from a robot. In this case, the input to SLAM is they can largely impact the computing latency of SLAM on
collected from robots, and the output will be passed to map edge servers and the data size of the fused edge maps. Both
fusion. In our prototype, we develop the SLAM module with these two metrics are key performance contributors towards
GMapping [33], a popular lightweight open-source SLAM total execution time. Second, the network conditions between
implementation. For further acceleration, we manage a pool the robots and cloud can be heterogeneous. This requires the
of execution instances to enable parallel and asynchronous robot data processing offloaded from the robots to the edge
serving, i.e., launch a separated process to compute SLAM servers to be aware of the diverse network connections. To
whenever a robot’s raw data arrive. overcome these challenges, we design an efficient optimization
 The results of these processing threads are called robot framework for robot-edge collaborative processing in the next
maps, which will be merged via a fusion module. We refer section.
to this module as preparative fusion, in contrast to the global
fusion on the cloud. Particularly, the preparative fusion targets IV. ROBOT-E DGE C OLLABORATION O PTIMIZATION
at the robot maps on the edge server and perform fusion by A LGORITHMS
first checking the overlapping degree of robot maps and next This section concentrates on scheduling the data flow be-
merging those overlapping ones. We design to separate such tween robots and edge servers in order to minimize end-to-
a preparatory process from the global fusion for two reasons. end multi-robot SLAM latency. We first formulate the cost
On the one hand, by sinking the fusion workload to the edge optimization problem in terms of the latency expired by robots,
servers, we can shrink the computing latency by avoiding edge servers and cloud server. Next, we address it via a two-
excessive delay-significant transmissions to the remote cloud. step workflow, i.e., balanced robot data grouping and network-
On the other hand, fusing the robot maps on an edge server aware edge offloading.
can effectively deduplicate the redundancy across overlapping
robot maps and thus reduce the data size of edge maps, for A. Problem Formulation
which the communication overhead between edge servers and We consider a cluster of robots, where each robot can
cloud is saved. walk freely or with the user-defined routes, and pushes its
6

 16 2.0 Indoor space Obstacle
 Feature extraction Input map 1 Overlapping area
 14 Pairwise matching Input map 2
 Computing latency (s)

 12 Component connection 1.5 Merged map

 Relative data size
 Transform optimization
 10 Gird compose

 8 1.0 Robot map 1
 6

 4 0.5

 2

 0 0.0 Map fusion Merged map
 2 4 6 8 10 10% 20% 30% 40% 50%
 Number of frames Overlapping degree Robot map 2

 (c) Illustration of the map fusion procedure with two example
(a) The computing time of the map fu- (b) The data size of two input maps and input maps. The blue area indicates the overlapping part of the
sion procedure in multi-robot SLAM with the corresponding merged map with vary- inputs.
varying number of input maps. ing overlapping degrees.

Fig. 7: Analysis of the map fusion procedure. The subfigure (a) shows the computing time of map fusion procedure with respect
to the five functions that it applies: feature extraction, pairwise matching, component connection, transform optimization, and
grid composing. The subfigure (b) observes that as the overlapping degree increases, the data size of the merged map decreases.
Note that the two inputs are of equal data size, and the overlapping degree is defined by the percentage of the overlapping
area out of the total areas. The subfigure (c) illustrates a map fusion procedure with two robot maps, where it first checks the
overlapping area of the inputs via their feature information, and next connects these overlapping parts and constructs a merged
map. The larger the overlapping area, the smaller the data size the merged map has.

sensory data to a specific edge server among the edge quadratically as the number of frames linearly increases. In
servers. To obtain a robot ’s robot map processed with the Fig. 7(a), we further break down map fusion procedure into
assist of an edge server , it counts the time for data packing, five successive functions: feature extraction extracts a frame’
transferring and frame transformation on : edge features, and next pairwise matching performs feature
 pack points matching between different data frames; component
 = + trans frame
 → + . (1)
 connection and transformation optimization functions intend
 Moving forward the data flow, calculating the edge map on to solve the pose, and finally grid compose is performed to fuse
an edge server needs to wait until all its owned robot maps the frames. We observe from function-wise latency that this
ready and fuse them in situ, which takes the time: trend primarily comes from the pairwise matching function,
 which performs ( −1)/2 times of pair-wise checking given
 = max + fuse , (2) frames. Therefore, if excessive robot data is assigned to a few
 ∈
where ∈ means the robots whose data are assigned to the edge servers, the imbalance workload distribution will lead to
edge server , fuse represents the fusion latency in edge server a much higher completion time of the total process. Reflecting
 trans ).
 on Equation (3), it is for minimizing max ( + →
 . From a cloud view, it strives to aggregate all the edge maps
from edge servers to reckon the global map, which takes the The other factor is the communication side that focuses on
time of receiving all edge maps and performing global fusion: the data size of edge maps. This metric, as we observe in
 measurements, is highly sensitive to the overlapping degree,
 trans
 = max ( + → ) + fuse . (3) i.e., the ratio of the overlapping area to the total area of

 input maps. To illustrate that, Fig. 7(b) plots the data size of
 Essentially, is the total execution time that characterizes the corresponding edge map with varying overlapping degree
the duration from raw data collection to global map comple- and Fig. 7(c) depicts how map fusion works. In Fig. 7(b),
tion, which is exactly the optimizing objectives of RecSLAM. we take two robot maps of equal data size as input, and
 fuse represents the fusion latency in cloud. Therefore, we can control the content of them to adjust the overlapping area.
derive the execution latency optimization problem as: The result reports that as the overlapping degree increases, the
 min , (4) edge map’s data size shrinks. Particularly, a 50% overlapping
 degree of two inputs indicates they are fully overlapped, and
 s.t. (2), (3).
 thus the obtained edge map is exactly one of the inputs
 Discussion. The formulation provides an abstracted form and has the same data size of a single robot map. Fig. 7(c)
of the problem with various details hidden. Among them, we explains this impact visually, where the blue area indicates the
mainly consider two factors. One is the computation side, overlapping part. The larger the overlapping area, the higher
where we expect the assignment from robots to edge servers the overlapping degree, and thus the smaller data size the edge
is relatively even such that the effect of parallel processing map has. This observation drives us to assign robot maps with
is maximized. The rationale behind can be seen in Fig. as higher overlapping degree as possible together, so as to yield
7(a), where the total computing time of map fusion grows smaller edge maps and save the transmission cost between
7
Algorithm 1 Balanced robot data grouping algorithm
Input: The overlapping graph G (with vertices),
The number of edge servers ,
The neighboring function N ( ) that returns the neighbor
vertices of in a set
Output: Grouping result h 1 , 2 , · · · , i
1: Initialize an empty buffer set and an candidate set
2: Assign all vertices in G to , set exit = 0
3: Initialize empty grouping result h 1 , 2 , · · · , i
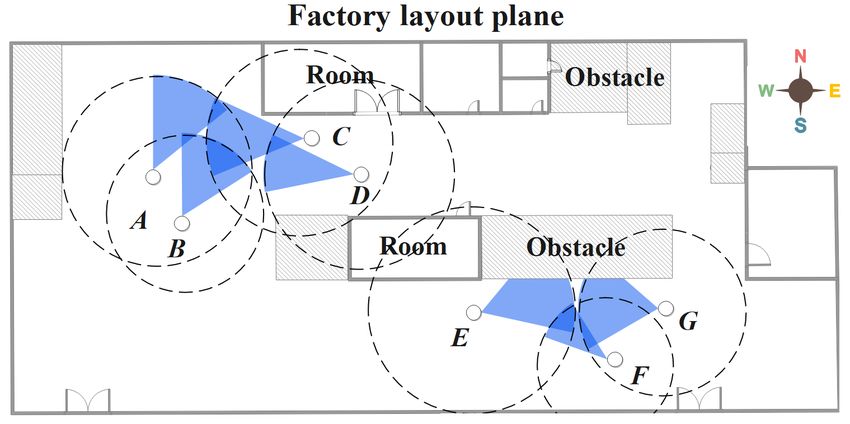
(a) An example smart factory scene with multiple robots, where some robots,
4: repeat
e.g., robot A and B, have overlapping scan fields.
5: if is empty then
6: for = 1, 2, · · · , − 1 do
neigh neigh
7: Select vertex min from such that min has the
least number of neighbors
neigh
8: ← + { min }
neigh
9: ← − { min }
neigh neigh
10: ← + ∩ N ( min ) − { min }
11: if | | ≤ then
(b) The abstracted robot maps based on the robots’ scan fields in (a). Each 12: set = 1 and break
circle represents a robot map and the overlapping area means the two robots’ 13: end if
scan fields have intersection (i.e., data redundancy between the robot maps).
14: end for
15: else
C
16: for = 1, 2, · · · , − 1 do
A D G gain gain
17: Select vertex max from such that max has the
E maximum gain using Equation (5)
B
F 18:
gain
← + { max }
gain
(c) The corresponding graph of the maps in (b). A vertex is a robot map and a 19: ← − { max }
gain gain
link is the overlapping relation between robot maps, with the overlapping degree 20: ← + ∩ N ( max ) − { max }
as its weight. 21: if | | ≤ then
22: set = 1 and break
Fig. 8: An example abstraction flow of the overlapping graph.
23: end if
For the robots in the factory scene (a), we first abstract robot
24: end for
maps in (b) and then derive the overlapping graph in (c).
25: end if
26: until = 1
edge servers and the cloud. 27: ←
Overall, accommodating both computation and commu- 28: Apply Algorithm 2 to optimize the grouping result
nication aspects to optimize the problem (4) is inherently 29: return h 1 , 2 , · · · , i
complicated. Essentially, it is hard to solve the optimal solution
fast due to its combinatorial nature. To achieve efficient
solving, we intend to decouple it into two sub-problems by robots across groups should be approximately equal, in order
separately accounting for robot data grouping and robot data to achieve balanced processing workloads among the edge
offloading. On the one hand, considering the characteristics servers later on. Besides, for minimizing the size of edge maps
of map fusion performed by SLAM, robot data grouping after fusion, the robot data within the same group is desired to
for workload-balancing needs to ensure that the number of yield robot maps with a higher overlapping degree as much as
nodes in each group tends to be uniform, while the in-group possible. We accomplish these goals by firstly abstracting an
overlapping degree is as large as possible, so as to avoid overlapping graph to shape the relations between robot maps.
the straggler effect due to imbalanced processing workload Graph abstraction. Fig. 8 illustrates how we abstract an
assignment and reduce the total size of fused edge maps. overlapping graph. Given the robots in Fig. 8(a)’s factory
On the other hand, bandwidth conditions of the edge servers layout plane, we can collect their position and localization
may be different, so network-aware offloading optimization information in a bottom-up manner: the robots report their
for efficient robot-to-edge data transmission and computation meta sensory data to the nearby edge servers and the edges
is also desired. push these data to the cloud to infer the global overlapping
information. In many well-planned deployments, this proce-
B. Balanced Robot Data Grouping dure can be even accomplished offline as long as we know the
The robot data grouping targets at dividing the robots’ robots’ scanning routes prior to runtime. With the information,
SLAM sensory data into groups (i.e., edge servers) with we can therefore represent the robots’ corresponding maps
the objective of evenness. Here evenness means the number of in Fig. 8(b), where each one reflects the area that a robot’s8
scanning field covers. It is represented by circle, because Algorithm 2 Tabu-searching-based optimization
the robot can scan the surrounding 360-degree during the Input: The overlapping graph G,
movement. Let a pair of maps with an overlapping area share a Initial grouping h 1 , 2 , · · · , i,
link, we abstract a graph in Fig. 8(c), named as the overlapping The maximum iterations times ,
graph. A vertex in such a graph is a robot map, whereas The maximum tabu list length
a link quantifies the overlapping degree between two robot Output: Optimized grouping result h 1∗ , 2∗ , · · · , ∗ i
maps. Particularly, two vertices are not connected if there 1: Initialize an empty tabu list of vertex pairs, an empty
is no overlap between the two robot maps. We denote the list of obtained grouping results, and an empty list
overlapping degree as ( , ), which represents the weight of of vertex pairs to be swapped
the link between vertex and . 2: h 1∗ , 2∗ , · · · , ∗ i ← h 1 , 2 , · · · , i
Balanced grouping algorithm. Using the overlapping 3: repeat
graph model, we observe that the robot map grouping problem 4: for vertices , ∈ G do
can be approximated to a graph clustering variant. Concretely, 5: if and are not in the same group then
we can operate on the overlapping graph to decide a balanced 6: Add ( , ) to
grouping with maximal in-group overlapping degree1 . To 7: Swap the locations of and to obtain a new
accomplish this, we develop a balanced grouping solution grouping h 10 , 20 , · · · , 0 i
in Algorithm 1 on the basis of the balanced graph parti- 8: Add h 10 , 20 , · · · , 0 i to
tioning method [34], [35]. The key idea is first to generate 9: end if
a feasible grouping plan and next use Tabu searching for 10: end for
further optimization. Particularly, the way that Algorithm 1 11: ← arg min { ( )} using Equation (6)
, ∈
finds an initial grouping is to iteratively put the vertex with 12: if ( ) < (h 1∗ , 2∗ , · · · , ∗ i) then
maximum performance gain to a group such that for each 13: if ∈ then
group the in-group overlapping degree is maximized, and the 14: Remove from T
Tabu searching optimization is to avoid a local optimum result 15: end if
and will be described in Algorithm 2 detailedly. 16: h 1∗ , 2∗ , · · · , ∗ i ←
The input of Algorithm 1 are an undirected graph G (with 17: end if
vertices), the number of groups (i.e., the number of edge 18: if ∉ then
servers) , and a neighboring function N ( ) that returns 19: Add to
the neighbor vertices of . The output is the grouping result 20: end if
h 1 , 2 , · · · , i, where is a set that includes the vertices 21: if | | > then
assigned to -th partition. 22: Remove the first element of
At the beginning of Algorithm 1, we initialize an empty 23: end if
buffer set and an empty candidate set , and immediately 24: h 1 , 2 , · · · , i ←
add all vertices in the overlapping graph G to . We also 25: until Iterating for times
initialize empty grouping result h 1 , 2 , · · · , i, and then 26: return h 1∗ , 2∗ , · · · , ∗ i
goes into an iterating process. For each iteration, we first check
whether the buffer is empty: if empty, it means there is
no suitable candidate related to vertices in the current group
neigh vertex migration. The greater the difference, the greater the
, thus we add the vertex min with the least number of
possibility of the point being selected.
neighbors from the candidate set , and put it to (Line 7-
neigh ∑︁ ∑︁
9). The vertices associating with min , obtained by N ( ), will gain( ) = ( , ) − ( , ). (5)
be added to for the coming assignment (Line 10). Whenever ∈ ∈ \{ }
a node is deleted from , we check whether | | ≤ . If the
condition is satisfied, which means the difference of nodes’ The principle behind exploiting the gain formula is to make
number in any two groups is less than 2, it will set the exit each in-group overlapping degree as large as possible, while
gain
as true and jump out of the loop (Line 11-13). It should the out-group is as small as possible. Again, we assign max
be noted that these neighboring vertices N ( ) have never been to the current group and remove it from , and the
gain
visited, i.e., they have not been assigned to a specific group. If neighboring vertices N ( max ) will be added to the buffer
is not empty, there remains vertices in the buffer, and we will (Line 17-20). In this step, we still need to check whether
gain
select the vertex max with the maximum gain from candidates | | ≤ is met (Line 21-23). The above iterating processing
and move it to . The gain is estimated using Equation (5): continues until exit is true, which indicates that all
given a vertex in , we reckon the sum of ( , ) in and the vertices have been allocated in a balanced manner. The
, respectively, and calculate their difference. Such difference remaining vertices in will be directly assigned to -th group
values actually measures the weight change brought by the , and therefore we obtain a feasible initial grouping result
(Line 26).
1 Particularly, in-group overlapping degree means the geometrical sum of At the same time, N ( ) will be added to . Finally, when
( , ) within the same group, while out-group degree is the sum of ( , ) all the vertices are visited, we can get an appropriate grouping
between two specific groups. result (Line 27). However, this result is based on heuristic9 assignment and may terminate at a local optimum. To avoid Algorithm 3 Resource-aware edge offloading algorithm such circumstances, we further apply a Tabu searching to seek Input: The grouping result h 1 , 2 , · · · , i, a better grouping result (Line 28), as described in Algorithm The edge servers list E = h1, 2, · · · , i, 2. Bandwidth between edge server and the cloud, Tabu-searching-based optimization. The key idea of Al- Latency prediction model ( ) that returns the comput- gorithm 2 is to use a tabu list to save the local optimal ing latency of on edge server , solution, to avoid falling into the same result. The input of The function D ( ) that returns the output data size of the algorithm is the overlapping graph G, the initial grouping partition result h 1 , 2 , · · · , i, the maximum iterations times and Output: Offloading plan h 1 , 2 , · · · , i the maximum tabu list length . The output is an optimized 1: for = 1, 2, · · · , do grouping result h 1∗ , 2∗ , · · · , ∗ i. 2: ← arg min ( ( ) + D ( ) ) ∈E Algorithm 2 begins with initializing an empty tabu list 3: ← with length , an empty list of obtained grouping results, 4: Remove edge server from E and an empty list of vertex pairs to be swapped. We 5: end for instantiate the expected grouping h 1∗ , 2∗ , · · · , ∗ i with the 6: return h 1 , 2 , · · · , i initial grouping h 1 , 2 , · · · , i, and goes into an iterating process. For each iteration, we first construct all possible swapping pairs (Line 4-10): find vertices and that are C. Resource-Aware Edge Offloading not in the same group, add them to , apply a swapping to obtain an updated grouping h 10 , 20 , · · · , 0 i, and put the After robot data grouping, we have several groups of robot updated grouping to . With these swapped candidates, we data and need to decide their placement to the proper edge then expect to filter those that improve the quality of grouping. servers for edge map fusions to minimize the total collab- Specifically, we define a fitness function (·) in Equation (6): orative processing time. Since the data transmission from ∑︁ the robots and edge servers can be a bottleneck and the (h 1 , 2 , · · · , i) = ( , ). (6) network conditions of the edge servers can be different, the ∈ , ∈ , ≠ decision needs to tailor for the available bandwidth. Moreover, the computing capacity of the edge servers can also be The fitness defines the suitability of the grouping by cal- heterogeneous. Therefore, we propose a resource-aware edge culating the sum of weighted edges between different groups offloading strategy in Algorithm 3. in Equation (6). It is designed for weighing the sum of edges Algorithm 3 works in a greedy fashion and the input is the in an overlapping graph, and we can therefore use it in our robot data grouping result h 1 , 2 , · · · , i from Algorithm 1, optimization on workload grouping. The smaller the fitness the edge servers list E = h1, 2, · · · , i, and that records the value, the better the grouping result. In Algorithm 2, we find bandwidths between edge server and the cloud. Besides, two the swapping vertex pair, noted with index , such that it functions are also employed: the latency prediction function has the smallest fitness within all candidates in (Line 11). ( ) that returns the computing latency of on edge server If this vertex pair has smaller fitness than the current , the function D ( ) that returns the data size of partition . optimized counterpart’s (h 1∗ , 2∗ , · · · , ∗ i), we will update The output is the offloading strategy h 1 , 2 , · · · , i, where this optimized result (if it is exactly in the tabu list , just logs the edge server that grouping will be placed. In remove it from ). Otherwise, is accepted and will be added Algorithm 3, we iteratively select a group and pick an to the tabu list (Line 18-20), which means we will accept edge server such that the robot-to-edge offloading (including the local optimal solution and prevent it from being visited transmission and computation) latency is minimized (Line 2). again, unless the amnesty rules are met. If the tabu list is Particularly, we use ( ) to estimate the computing latency overlength than the preset maximum length , we will remove on the edge server and D ( ) to calculate the transmission the first element, the one that is the most out-of-date, from , time. Since this latency simultaneously tackles computing based on the first-in-first-out principle. The current grouping aspect, i.e., ( ), and the bandwidth , it is aware of the will also be updated will -th grouping. The above iterations available resource in both computation and communication, continue until reaching the maximum times, and the final and can support heterogeneous cases. The selected edge server optimized grouping h 1∗ , 2∗ , · · · , ∗ i will be returned. that minimizes the latency will be assigned to and be Complexity analysis. Assuming an overlapping graph has removed from the available edge server list E. We carry out vertices and links and we need to divide groups, this process until all edge servers are assigned with a group, the time complexity of the balanced grouping algorithm is and return the final offloading plan h 1 , 2 , · · · , i. ( + ). In the worst case, each partition has to traverse Complexity analysis. In our implementation, we use an / vertices. The operation of selecting vertices is regarded offline profiling method to obtain the estimation of computing as (1), because this part can be optimized by maintaining the time and output data size, which will be detailed in Section tree on the data structure. Moreover, the optimization requires V. Using the profiling result, the overhead of calculating traversing the edges, so the total complexity is ( / + ) = the computing/transmission time of each server is (1), the ( + ). complexity of Algorithm 3 is ( ), which is linear and fast.
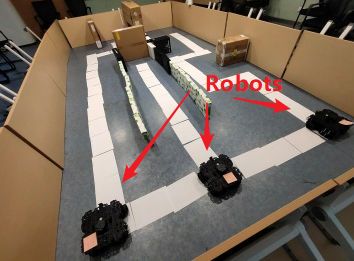
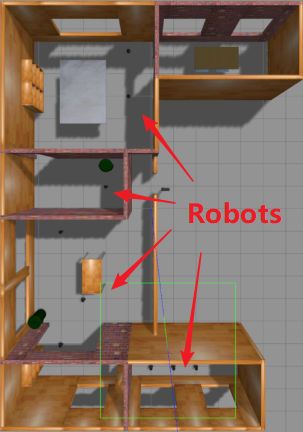
10

Fig. 9: Our prototype employs Turtlebot 3 as the robot and Fig. 10: The simulated scene of Fig. 1(a) in the Gazebo [25]
Jetson TX2 as the edge server. The Turtlebot is equipped with simulator, where robots and edge servers are placed inside
a RPLIDAR A1 as the laser scan and a Raspberry Pi as the to emulate multi-robot SLAM applications in physical edge
processing module. scenarios.

 V. I MPLEMENTATION publisher, and finally the publisher and the subscriber will
 establish a communication channel.
 We have implemented RecSLAM in both realistic prototype The communications involve multiple subscribing topics. In
and simulation platform. The proof-of-concept prototype is RecSLAM, the data format released by the robot cluster is
built with Jetson TX2 and Turtlebot 3 as shown in Fig. 9, while tbn_x, where x is the specific robot number. The data format
the simulations are carried on Gazebo [25], a high-precision of the GMapping instance subscripter in edge is tbn_x, and the
simulator of robotics emulations. Fig. 10 shows the graphical data with topic tbn_x/map will be published after processing.
interface of the scene in Fig. 1(a). The Map Fusion module receives coon_x/map and publishes
 SLAM integration. We adopt GMapping as the SLAM the data with edgem_x/map at the same time.
kernel on edge servers. However, our system can support For coordinator, it will receive tbn_x/map’s data. The
different SLAM toolkits as long as the robot can provide the workload grouping algorithm in the coordinator will split the
necessary data. Each time a robot offloads data to the edge, robots into groups, and then the offloading algorithm will
the edge server will create a dedicated GMapping instance generate allocation decisions and publish the data with the
for the robot to calculate the local map with a specific topic coon_x/map. The communication mechanism based on
topic. For example, when two robots offload data to an edge ROS ensures the reliability of communication between robot
server at the same time, the topics of them are tb4_0 and and edge.
tb4_2 respectively. At this time, there will be two GMapping Parameter profiling. The coordinator derives the over-
instances on the edge that subscribe the data with tb4_0/ and lapping degree matrix using a modified package called
tb4_2/ namespace, and then publish the occupancy grid map weight_cal. It is based on multirobot_map_merge, a generic
with tb4_0/map and tb4_2/map topic respectively. package in ROS. It can read multiple maps in a batch, extract
 To leverage the proposed scheduling algorithms over GMap- their features, perform matching checking, and outputs a rough
ping, we implement them in a centralized manner. Specifically, overlapping degree matrix. To run it in a lightweight style, we
we select one of the available edge servers as the coordinator invoke this package periodically, i.e., calculates and saves the
to be responsible for collecting robots’ maps information, overlapping degree matrix of the robot maps in a preset regular
estimating the overlapping degrees, and running scheduling frequency.
algorithms. According to the scheduling result, the coordinator To estimate the time of preparative fusion fuse at the
will route the robot data to corresponding edge servers, and edge server, we employ an offline profiling mechanism that
orchestrate them to collaboratively run map fusion tasks. The trains regression models for performance prediction. In our
algorithms can also be implemented distributionally, where a deployment, we carry out profiling on Turtlebot 3 and record
tailored mechanism is desired for global information sharing the computing latency of map fusion with respect to the
and consensus management, and we leave it as a future work. number of data frames. Fig. 11 illustrates the regression result.
 Robot-edge communication. The communications among An interesting observation of the figure is that the computation
robots, edge servers, and the coordinator are conducted via latency rises in a quadratic trend as the frame number increases
ROS2 . They all communicate using the publisher-subscriber from 2 to 12, This is because the computation of merging
model. In such a mechanism, the subscriber node will first requires pairwise matching of data frames, and the number of
register on the node master, and then the node master will matches has an exponential relationship with the number of
search among the registered publishers, find the matching frames.
 For the transmission latency between robots, edge servers
 2 ROS is an operating system specifically designed for manipulating
 and the cloud, there exists many network bandwidth measure
robotics. It provides a loosely coupled distributed communication framework
and rich libraries of various functional packages, making it convenient to carry tools available, which enables the real-time transmission time
out robotic system development. estimation based on the data size of the input frames. In
11

 17.5 we can see that the robots pave three different routes on the
 15.0 Measurements
 Computing latency (s)
 left, center and right of the scene, respectively. Overlapping
 Regression
 12.5 areas can be observed from these robot maps, e.g., robot map
 10.0 1 in (b) and robot map 2 in (c) share the same area at their
 7.5 bottom. Fig. 12(e) shows the obtained edge map that is fused
 5.0 from the robot maps, where the complete scene is sketched
 2.5 and the obstacles’ details are reserved.
 0.0 To further demonstrate RecSLAM’s effectiveness, we make
 2 4 6 8 10 12
 Number of input frames additional simulation experiments and build several virtual
 scenes in Gazebo [25], a popular platform3 that provides
Fig. 11: The regression result of SLAM computing latency on high-precision and near-physical experimental environments.
the Jetson TX2. The dots are the measurements and the curve Specifically, we design typical apartment indoor scenes in
is the regression. Gazebo’s virtual environments and place robots and edge
 servers to emulate multi-robot scenarios at the network edge.
 In all scenes, we distribute and preset routes for robots in
RecSLAM, we utilize the principle of tolerance and exclusion advance, and drive them to walk around the apartment. During
formula to estimate the output size of preparative fusion. Since the runtime of multi-robot SLAM, we record the robots’
the number of robot maps is relatively small, the estimation sensory data and calculate the maps by continuously replaying
error of the overlapping area is within a tolerable range. the collected data. To fully reflect the specifications in our
 prototype, we configure the same motion parameters, such as
 VI. E VALUATION velocity and scanning field, and replay the robots’ movement
 This section evaluates RecSLAM in both a simulator plat- for all simulations.
form and a prototype deployment. Particularly, we focus on The first scene, as shown in Fig. 1(a), is the main scene for
the feasibility of global map construction and the end-to-end our simulation experiments, which is a 13 × 18 2 apartment
execution time of running a multi-robot SLAM process. scene with three edge servers (and a varying number of robots
 on demand). Fig. 1(b) is exactly the global map generated by
 RecSLAM. We also built another two scenes in Fig. 13 and
A. Functional Verification Fig. 14 to examine the effectiveness in constructing the whole
 We first conduct functional verification of RecSLAM based map. The scene in Fig. 13(a) is in a 4 × 4 2 square and is
on a small-scale realistic prototype. Specifically, we mainly designed to emulate a symmetrical layout. The subfigures Fig.
focus on collecting realistic robotics measurements and exam- 13(b)-(e) depicts the robot maps constructed using the laser
ining the effectiveness of the hierarchical map fusion proce- scan data from the four robots, while the subfigures (f) and (g)
dure, and thus providing necessary data to facilitate subsequent are the corresponding edge maps and (h) is the global map in
larger-scale simulation experiments. We use the TurtleBot3 the cloud. Specifically, (f) is obtained by fusing (b) and (c), and
Waffle Pi mobile robot for laser data collection and the Jetson (g) is from (d) and (e). The last scene is in a 5 × 5 2 room as
TX2 as the edge server. The TurtleBots are all installed with shown in Fig. 14(a), which exhibits an asymmetrical layout. In
Raspberry Pi 3b+ as their processing module, which has contrast to the neat robot maps in Fig. 13, the maps in Fig. 14
1.4GHz ARM Cortex-A53 CPUs and 1GB LPDDR2 memory. shows relatively irregular styles due to the scene’s asymmetry.
The Jetson TX2 is equipped with NVIDIA Denver and ARM Nevertheless, it can be seen from both scenes that the global
Cortex-A57 CPUs, an NVIDIA Pascal GPU with 256 CUDA- map after map fusion matches the corresponding scenes with
cores, and 8 GB LPDDR4 memory. All the robots and the respect to the whole layout and the obstacle positions.
edge server are connected via the 802.11ac wireless signal Remark that the global mapping results from RecSLAM and
and in the same LAN. The cloud server employs an instance the cloud approach are the same since both of them reserve
(8vCPU, 16GB memory, Ubuntu 16.04) that locates at the complete raw scan data from robots and run the same SLAM
same available zone with the robots and their physical distance module. Particularly, RecSLAM improves multi-robot SLAM
is about 200km. The testbed scene is built in a 6 × 5.5 2 con- beyond traditional cloud approach by mitigating the workload
ference room, where we manually add walls and obstacles, as of SLAM and fusion to edge servers and achieves much lower
shown in Fig. 12. The linear velocity of the robots is 0.20 / , execution latency without sacrificing map accuracy.
and the angular velocity is set to 0.20 − 0.80 / 2 during the
runtime. Although RecSLAM’s design allows robots to walk
 B. Performance Evaluation and Comparison
freely, we have set determined routes for robots in advance
for the sake of simplicity and experimental repeatability. As Due to the limitations of the robotics hardware and physical
the robots move around, the equipped laser sensors perceive space in our laboratory, we focus on verifying the functional
the surrounding environment at a fixed frequency and continue feasibility of RecSLAM’s multi-robot map fusion. To fully
collecting sensory data. evaluate multi-robot SLAM performance with more robots and
 Fig. 12 presents the mapping results of our prototype. 3 Gazebo [25] is a robotics simulator that offers the ability to accurately
Particularly, Fig. 12(b), (c) and (d) visualize the robot maps and efficiently simulate populations of robots in complex indoor and outdoor
that are computed based on the robots’ sensory data, where environments, and has been widely used in the community.
You can also read