Earth & Environmental Science Research & Reviews
←
→
Page content transcription
If your browser does not render page correctly, please read the page content below
ISSN: 2639-7455
Research article Earth & Environmental Science Research & Reviews
Is Diminishing Solar Activity Detrimental to Canadian Prairie Agriculture?
Ray Garnett¹*, Madhav Khandekar² and Rupinder Kaur³
¹Agro-Climatic Consulting, Winnipeg, Manitoba, Canada
*Correspondence
Expert Reviewer IPCC 2007 Cycle AR4 Climate Change
2
Ray Garnett, Agro-Climatic Consulting, Winnipeg, Manitoba, Canada.
Documents Markham, Ontario, Canada E-mail: ergarnett@shaw.ca; Tel: 204-783-3363.
³Plant Scientist and research assistant to Agro Climatic Submitted:07 Aug 2020; Accepted: 15 Aug 2020; Published: 31 Aug 2020
Consulting (ACC) Winnipeg, Manitoba, Canada
Abstract
During the grain growing months of May-July, the mean temperature on the Canadian prairies has cooled down by 2ºC in
the last 30 years. The cooling appears to be most certainly linked to diminishing solar activity as the Sun approaches a Grand
Solar Minimum in the next decade or so. This cooling has led to a reduction in Growing Degree Days (GDDs) and has also
impacted the precipitation pattern. The GDDs in conjunction with mean temperature and precipitation are important
parameters for the growth of various grains (wheat, barley, canola etc.) on the prairies.
In this study, we investigate the impact of declining GDDs and associated temperature and precipitation patterns on Prairie
grain yields and quality. Our analysis shows that there has been a loss of about 100 GDDs over the time frame of 1985-2019.
The loss in GDDs is also linked to some of the large-scale Atmosphere-Ocean parameters like the Pacific Decadal Oscillation
(PDO), North Pacific Index (NPI) and Arctic Oscillation (AO). Our analysis suggests grain yield and quality could be sig-
nificantly impacted in the coming years as solar activity continues to diminish.
Keywords: Canadian Prairies, Solar Activity, Cooling, Growing Degree Days, Yield, Quality
Introduction a record low prairie protein content of 12% and fusarium head blight
The Canadian prairies produce up to 75 million tonnes of grain in Manitoba in 1993. In those years 75% of the spring wheat crop
annually (primarily wheat, barley, oats) and oilseeds (primarily fell into the bottom two grades of #3 Canada Western Spring wheat
canola) during the summer months of June-August. Canada is a and Feed wheat (Garnett and Khandekar, 2015). Buyers of Canadian
major grain exporting country with the market value of the grains spring wheat pay a premium for high quality and protein wheat for
at about 30-40 billion US dollars. The Canadian Prairie agriculture making bread and other edible products (Garnett, 2002). The 1992-
provides livelihood for several thousand farming communities 1993 experience suggests that extremely low summer temperatures
and is a valuable year-round business activity for the prairies. A are more likely to affect quality than yield. In years in which record
good grain harvest in a given year depends critically on avoiding spring wheat yields were recorded, such as 2013, June-August
various summer weather & climate extremes which can adversely temperatures averaged very close to the 35 years mean of 16.90C.
or favorably impact grain yield and quality (Garnett and Khandekar
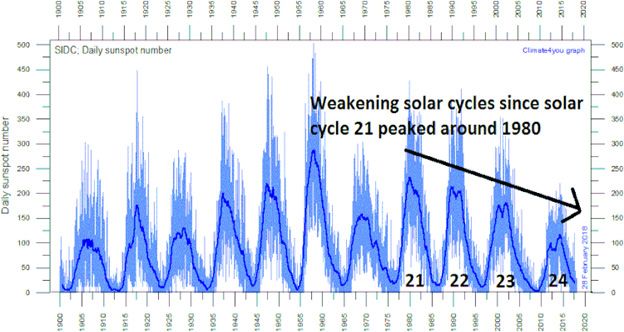
2015, 2017). Wheaton describes how the droughts of 2001 and 2002 Solar activity and variability are most commonly depicted using
affected Canada’s national GNP, which fell $5.8 billion during 2001 a solar cycle diagram as shown in Figure 1. The diagram shows
and 2002 with the biggest loss occurring in 2002 at $3.6 billion. variations in the 11-year sunspot cycles for the period 1900-2018.
The impact of solar variability on the earth’s climate has been
The most severe impact of extremely low temperatures affecting extensively studied by a large number of scientists over the last
spring wheat came in 1992 and 1993 after the 1991 Pinatubo volcanic 50 years. Among some of the important studies are those of Eddy
eruption. Summer temperatures were 2ºC below normal resulting in (1976), Reid (1997), Plimer (2009) and Archibald (2014). These and
Eart & Envi Scie Res & Rev, 2020 www.opastonline.com Volume 3 | Issue 3 | 170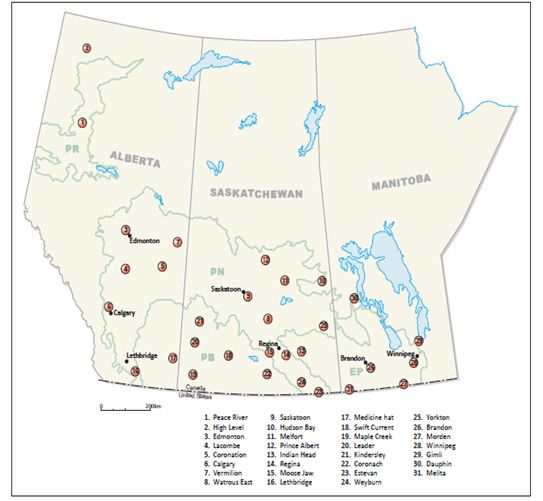
many other studies have now helped improve our understanding of        2002). Wheat is the largest crop grown on the Canadian prairies;
the sun/climate link. Many solar scientists are now of the opinion     however, canola has surpassed spring wheat in production.
that the Sun is the primary driver of the earth’s climate.
                                                                                   Table 1. Data sets used in this study.
                                                                        Monthly         Source               Number of      Record
                                                                        Data Type                            Stations       Length
                                                                        Temperature     Environment          More than      1984-2007
                                                                                        Canada               100
                                                                        Temperature     Agro-Climatic         31            2008-2019
                                                                                        Consulting
                                                                        Sunspots per    U.S. Geophysical                    1750-2019
                                                                        month           Center
                                                                        AP Index        Climate 4 You                       1984-2019
                                                                        Pacific         JIASO, University                   1984-2019
                                                                        Decadal Os-     of Washington
                                                                        cillation
                                                                        Pacific North   U.S. Climate Pre-                   1984-2019
Figure 1. The 11-year sunspot cycle 1900-2018                           American        diction Center
                                                                        Teleconnec-
Using a study from the 1970s Archibald (2014) warns that during         tion
2014-2024 a 20C cooling could keep the Canadian wheat crop
                                                                        North Pacific   U.S. Climate                        1984-2019
from ripening before the first frost. His prediction is supported by
                                                                        Index           Prediction Center
the research of Christensen and Lasson (1991) who demonstrate
that global temperature is better correlated with the length of the
previous cycle than with the amplitude of the coincident cycle.         Arctic Oscil-   U.S. Climate                        1984-2019
Butler and Johnson (1996) confirm the theory with a two-hundred-        lation Index    Prediction Center
year temperature record at the Armagh Observatory in Northern           Grade Pattern   Market Analysis                     1973-2019
Ireland.                                                                & Protein       Group (MAG)
                                                                        Content         Agriculture &
Garnett et al. (2006) show that wettest May-Julys on the Canadian                       Agri-Food Canada
prairies occur with less than 70 sunspots/month while driest May-                       (AAFC)
Julys are experienced with over 100 sunspots per month. This is in
line with the findings of Svensmark and Friis-Christensen (1997)
and Svensmark et al (2017) who describe a solar link to cosmic ray
flux and global cloud coverage. Garnett and Khandekar (2015) find
that wet (dry) summers are cool (hot) summers (r = -0.31 **).

Data, Study Area and Research Methods
The datasets used in this study are listed in Table 1. Agro-Climatic
Consulting (ACC) refers to the first authors home based business.
In this investigation, we treat the extremely cold June-August
temperatures of 1992 and 1993 as outliers. Ranking, correlation,
composite and trend analysis research methods were used.

Mean monthly solar activity during 1985-2019 was 54.2 sunspots.
One S.D. is 44. Maximum solar activity was in 1990 averaging 154
sunspots/month while the lowest was in 2009 averaging 2 sunspots/
month.
                                                                       Figure 2. Station locations and ago-eco regions of the Canadian
Figure 2 shows the location of 31 stations used to represent monthly   prairies from (Padbury et al., 2002).
temperatures for the period 2008-2019. Only stations that reported
80% of the time were used. Four Canadian prairie agricultural          Results and Discussion
ecological zones are also shown based on the work (Padbury et al.,     We first graphed the mean temperatures of April, May, June, July

Eart & Envi Scie Res & Rev, 2020                          www.opastonline.com                                    Volume 3 | Issue 3 |171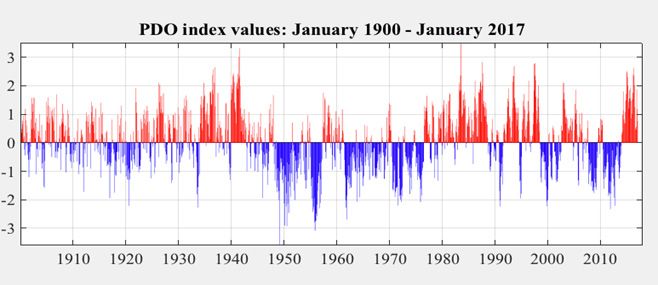
and August, the traditional growing season months. It revealed a           the first week in May through the first week in June and harvested
2°C cooling in April, a 10C cooling in May, a slight cooling in June       between mid-August to mid-October (Stefanski et al 1994).
and a nearly flat to slightly upward trend in July and August. These
graphs suggest that planting is now occurring later in the growing         The extremely low GGDs in 1985 could have been a factor in the
season.                                                                    mediocre yield of 1.73 t/ha. The amount of top-grade red spring
                                                                           wheat that year was half of the 10-year average. The market value
                                                                           loss in an extremely low GDD growing season such as 1985 is
                                                                           estimated at $250 mln Cdn for red spring wheat alone. In 2018
                                                                           spring wheat made up 22% of the field crop area, (Wild Oats News
                                                                           Letter, June 30, 2020). With spring wheat about a quarter of the crop
                                                                           area, the total market value loss, when canola and other crops are
                                                                           included, could conservatively be 1 $blnCdn.

                                                                           The market value loss assumes production of 20 mln tonnes, a price
                                                                           of $235/tonne for 13.5% protein #1 Canada Western Red Spring
                                                                           wheat (CWRS), with discounts of $5, $20 and $45 for #2 and #3
                                                                           and feed wheat respectively when, comparing the 1985 and 10-year
              April                                May                     average grade patterns.

                                                                           Garnett and Khandekar (2010) describe the prairie summer of 2010
                                                                           as the wettest in 60 years, averaging 152% of normal rainfall April-
                                                                           September. It has been called the year that $3bln washed away. In
                                                                           2010 there was only 11% in the top grade, a 30% drop from the 10-
                                                                           year average and protein content was below average.

                                                                           Table 2. The conversion of mean monthly temperatures to
                                                                           GDDs.
                                                                                              April May June July               August Period
                                                                            Mean Tem-         4.0   10.8 15.5 18.2                17.1 1985-
               June                                July                     perature °C                                                2019
                                                                            Growing                    180    315     409       372
                                                                            Degree Days
                                                                            (GDDs)
                                                                            Accumulated                180    495     904       1276
                                                                            GDDs
                                                                            1988                       267    711     1136      1508
                                                                            1985                       229    466     869       1183
                                                                            2004                       85     424     895       1188

                                                                           Note: The base mean temperature at which spring wheat will
                             August                                        germinate and grow is 5°C (41ºF)

Next, we converted mean temperatures for the above months into             3.1 The Solar influence on June-August Temperatures
GDDs as shown in Table 2. Schwanz (1997) describes how the                 Correlation analysis was done between June-August sunspot activity
GDD concept is used in scheduling planting and harvesting dates            versus June-August mean temperatures and is shown in Table 3.
and selecting different plant varieties for different soil types. Spring   The correlations are based on the agricultural year that begins in
wheat GDDs are calculated by subtracting a base temperature of             September of the previous calendar year and concludes the following
5°C from the mean monthly temperature and then multiplying by              August when crops ripen. It also captures the previous fall when soil
the number of days in the month. It requires 96 calendar days or           moisture recharge can be important to yield. Garnett et al., 2006 find
1080 GDDs to mature spring wheat and 112 days to mature canola.            similar and more frequent correlations between solar activity and
A base temperature of 0 is used with canola (Saiyid et al., 2009)          May-July precipitation. The weaker correlations in Table 3 suggest
(Harker et al., 2012). Spring wheat and canola are planted between         that precipitation is more sensitive to solar activity than temperature.

Eart & Envi Scie Res & Rev, 2020                             www.opastonline.com                                            Volume 3 | Issue 3 |172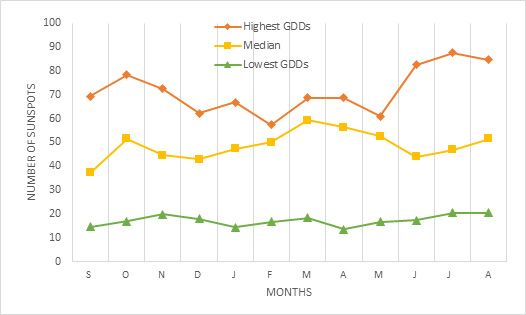
Table 3. Correlation coefficients summer sunspots vs summer temperatures
                Sep Oct Nov              Dec     Jan       Feb        Mar      Apr     May      Jun      Jul Aug          Period
 Sunspots       0.32* 0.23 0.16          0.26    0.27      0.17       0.23     0.30*   0.20     0.27     0.20 0.32*       1985-
                                                                                                                          2019

Figure 3 depicts what can be expected in summer GDDs with
different levels of solar activity. It was created by ranking GDDS
from highest to lowest and then grouping solar activity into three
groups of four years representing the highest, median and lowest
for the period. The correlations in Table 3 and this composite
support the hypothesis that high (low) solar activity is conducive
to a high (low) number of GDDs in June-August. The composite
enables operational research.

                                                                      Figure 4. Ranked average June-August sunspot activity

Figure 3. Number of sunspots prior to the highest (1988, 1991,
2003, 2012) median (1995, 2011, 2013, 2014) and lowest (1985,
2004, 2005, 2009) GDDS summers

In the very low GDD summers of 1985, 2004, 2005 and 2009 the
average top grade of #1Canada Western Red Spring (CWRS) was
33% versus 10-year average of 41%. Protein content was equal to
the 10-year average at 13.5%.

To further illustrate the solar effect on June-August GDDs, mean
June-August sunspot activity was ranked from highest to lowest
and is shown in Table 4. Figure 4 shows this ranking of June-
August average sunspot activity. Figure 5 reveals the cooling trend
after the ranking. The end points of the trend line (1150 and 1080)
in Figure 5. indicate a loss of 70 GDDs or 2 GDDs/year during
1985-2019.

                                                                      Figure 5. GDDS that correspond with ranked sunspot activity

Eart & Envi Scie Res & Rev, 2020                         www.opastonline.com                                   Volume 3 | Issue 3 |173
Table 4. Ranked average of June-August sunspot activity, year and GDDs.
Ranked Solar Activity June-August Associated Year Corresponding Number of Growing Degree Days
173.2 1991 1189.5
164.0 1989 1163.0
152.7 1990 1108.1
141.8 2000 1052.0
115.0 1999 1036.0
109.1 1988 1241.4
107.4 2001 1157.0
101.4 2002 1136.0
77.8 2003 1204.0
76.2 1998 1162.0
72.7 2014 1103.0
66.4 2015 1157.4
64.7 2012 1185.9
58.5 2013 1093.5
45.1 2004 933.3
43.8 2011 1128.0
38.6 2005 1032.6
35.0 2016 1144.6
29.7 1987 1063.3
28.5 1994 1110.0
23.3 2017 1182.6
22.0 1985 952.2
16.4 2010 1066.0
15.8 1997 1156.3
14.8 1995 1110.3
13.0 2006 1198.0
11.5 1996 1135.0
9.3 2007 1146.0
8.9 1986 1057.2
6.5 2018 1145.0
2.2 2009 997.0
1.4 2008 1087.0
0.9 2019 1051.0
Eart & Envi Scie Res & Rev, 2020 www.opastonline.com Volume 3 | Issue 3 |174In Figure 6 below sunspot cycle #24 is compared with 3.2 The Atmospheric-Oceanic influence on GDDs in May and
nine sunspot cycles during the 20th century and cycle 5 during June-July
the Dalton minimum of 1798-1809. The 11-year sunspot cycle The most dominant predictor of May and June-July GDDs was
has been numbered since the mid-18th century. In 2020 we are in the Pacific Decadal Oscillation (PDO). It is a long-lived El Niño-
year 11 of cycle 24 shown by the second line in Figure 6 (the 11th Southern Oscillation (ENSO)-like pattern of Pacific Ocean climate
interval and point 12 on the x axis). The agricultural year is from variability, whose climatic fingerprints are most visible in the
September of the previous calendar year until August when crops North Pacific-North American sector with secondary signatures
ripen. As of May 2020, in agricultural year 11 there has been an in the tropics. Its behaviour during the 20th Century is shown in
average of 1.9 sunspots per month. Based on 9 cycles during the Figure 7.
20th century sunspot activity can be expected to remain very low
for a few years. A recent study suggests that sunspot cycle 24 is Landsheidt (2001b) hypothesizes that the 22-year or Hale cycle
ending in 2020 (Whitehouse, 2020). of solar activity is associated with ENSO events over the decades
and that it is conceivable that the state of the inter-decadal PDO
constrains the envelope of interannual El Nino/Southern Oscillation
Index (ENSO) variability. The magnetic polarities reverse each 11-
year cycle returning to their original state in the Hale cycle. The
Hale cycle started in 1996 and has lasted until 2020, during which
Landsheidt anticipated La Nina conditions and a negative PDO.
Figure 7 shows that he correctly forecast a negative PDO through
2007 which has trended downward since 1985.
Figure 6. Top line is the average of nine sunspot cycles 1902-
2009. Second line is sunspot cycle # 24, 2009-2020. The third line
is cycle #5, 1798-1810 during the Dalton Minimum
The Dalton Minimum and Maunder Minimums were part of a cold
period between 1650-1850 which was stressful for most of Europe Figure 7. The Pacific Decadal Oscillation (PDO) January 1900-
with food wars and tens of millions of deaths as a result of extreme 2017
cold and a lack of heating in most homes. In 1816 the 11-year
sunspot cycle peaked at 35 sunspots per annum versus the normal Figure 8 shows a loss of 25 GDDs in May (end points of 195 to
of 100 Plimer (2009) Soon and Yaskell (2003). There has been an 170). Possible predictors were explored to explain this decline,
average of 37 sunspots in cycle 24. How many sunspots will there namely sunspots, PNA, PDO and AO indices in which the PDO
be in cycle 25? and PNA indices emerged as the most promising as shown in Table
5.
Table 5. Correlation coefficients of PDO and PNA versus May GDDs
Sep Oct Nov Dec Jan Feb Mar Apr May Jun Jul Aug
PDO 0.34** 0.37** 0.39*** 0.36** 0.31* 0.37** 0.34* 0.30* 0.16 0.12 0.19 0.12
PNA -0.49*** -0.03 -0.05 0.11 0.19 0.08 0.10 0.03 -0.10 0.24 0.05 -0.30*
Eart & Envi Scie Res & Rev, 2020 www.opastonline.com Volume 3 | Issue 3 |175Figure 9. Composite of accumulated PDO values leading up the
highest (1987,1988, 2016, 2018) median (1992, 2003, 2007, 2011)
and lowest (1996, 2004, 2009 2010) May GDDs for the period
1985-2019.
Figure 8. May GDDs 1985-2019
Next, we looked into possible drivers of June-July GDDs which
Correlation coefficients of the PNA and PDO indices versus May account for 700 of the 1080 or 65% of the GDDs required to
GDDs appear in Table 5. In Figure 9 the statistically significant mature spring wheat. Exploratory correlation analysis was done
months of December through April are accumulated to ‘depict with sunspot, AP, PNA, PDO, AO and NP indices versus June-July
the sustained forcing of the PDO on May GDDs’. May is a key temperatures. Table 6 shows the most promising predictors.
planting time when a certain amount of GDDs are needed to
promote germination and tillering. Figure 9 allows for operational
research on forecasting May GDDs.
Table 6. Correlation coefficients of PDO, NPI and AO indices vs June-July GDDs
Sep Oct Nov Dec Jan Feb Mar Apr May Jun Jul Aug
PDO 0.21 0.27 0.23 0.21 0.26 0.29* 0.26 0.39** 0.31* 0.40*** 0.39** 0.30*
NPI 0.24 -0.19 0.01 -0.19 0.06 0.01 0.03 -0.27 -0.07 -0.12 -0.02 0.17
AO 0.17 -0.06 0.18 0.04 0.36** 0.18 0.11 -0.11 -0.04 0.09 0.28* 0.20
For Table 3, 5 and 6. ***1% level of significance 0.41, ** 3 % level of significance 0.349* 5% level of significance 0.296,
Stem extension, heading and flowering typically occurs in June low temperatures than dryland spring wheat?
and July when important spring wheat yield determining processes
occur. Greatest water usage and vegetative growth occur during Table 6 shows the correlation coefficients between AO, PDO and NPI
these months with temperature and radiation speeding up or slowing indices and June-July GDDs. Figure 10 depicts the sustained forcing
down water usage (Garnett, 2002). Crops grown in different of AO, PDO and NPI drivers on June-July GDDs. When operational
climatic areas require different amounts of water that imparts an research is done with Figure 10 the NPI anomaly sign is reversed to
effect on the yield of the crop. For instance, the wheat crop requires capture its persisting effect. It has also been made proportionate to
450-650 and rice 450-700 mm during the total growing period in other indices by dividing the input by six. Operational research with
which temperature is important (Brouwer and Heibloem, 1986). this composite provides general guidance as to June-July GDDs
(Plimer, 2009) describes how very low temperatures in February as early as April. This forecasting approach has been compared to
of 2008 destroyed 40% of Vietnam’s rice crop and killed 33,000 canonical correlation analysis (CCA).
head of livestock. Could rice yields be more sensitive to extremely
Eart & Envi Scie Res & Rev, 2020 www.opastonline.com Volume 3 | Issue 3 |176Also revealed is the influence of Atmospheric-Oceanic drivers,
such as the PDO, on Canadian prairie GDDS in the months of May
and June-July. In essence, low solar activity, a negative PDO, the
El Nino phase of ENSO and a negative PNA in the months leading
up to and during the growing season may produce cooling and
excess rain that results in inferior quality and yields.
A 1975 Newsweek article entitled ‘The Cooling World’ is a
reminder of the 1970s when scientists were concerned about the
impact of a cooling climate on world grain production. As the sun
approaches a grand solar minimum there is a risk of the Canadian
prairies becoming colder and wetter which is detrimental to grain
growth and quality. This study also raises questions about GDD
losses in other high latitude agricultural areas of northern Europe,
Siberia and southern areas of Argentina and Chile.
Figure 10. Composite of statistically significant AO, PDO and Selected Glossary of Terms
NPI predictors leading up to the four hottest (1988, 2002, 2006, The El Nino/Southern Oscillation (ENSO) in combination with
2007) four median (1991, 1996, 2003, 2011) and four coldest the Indian monsoon system constitutes the largest single source
(1985, 1999, 2004, 2009) June-Julys for the period 1985-2019. of inter-annual climatic variability on a global scale, which has
wide-ranging effects that are often severe. The Southern Oscilla
Landscheidt (2003), Archibald (2014), Morner (2015) and tion is the difference in sea level pressure between Darwin and
Whitehouse (2020) warn that planet earth could be entering a Tahiti. A positive (negative) SOI is indicative of La Niña (El
grand solar minimum. During agricultural years 2019 and 2020 Niño) conditions and colder (warmer) than normal sea surface
(the past 21 months) there have less than 9 sunspots/month. temperatures in the eastern equatorial Pacific.
Since September 2019 (Agricultural year 2020) there has been an
average 1.9 sunspots/month, the lowest since 2009. In 2009, on North Pacific Index (NPI) is the area weighted sea level pressure
August 26th, 2009 only 10% of the prairies harvest was complete over the region 30ºN-65ºN, 160ºE-140ºW.
versus the average of 50% (Ray Garnett Climate and Crop Letter
August 26, 2009). Pacific North American Teleconnection Index (PNA) is a
derivative index of the El Niño/Southern Oscillation index and
In short, when GDDS in May fall below 150 and June-August is typically positive during El Nino and negative during La Nina
GDDs fall below 1000 GDDs it is expected that the top-grade red during the winter months. During the April to May period research
spring will fall 30-50% with an associated market value loss of has shown that zonal flow (negative PNA index) is associated with
$250 mln dollars for red spring wheat alone. The loss in growing wetter cooler weather while meridional flow (positive PNA Index)
degree days during May-August is linked to both low solar and is associated with drier hotter weather over the Canadian prairies.
atmospheric-ocean drivers with the solar influence most prominent
in June-August and atmospheric-ocean influence more prevalent Pacific Decadal Oscillation (PDO) is a long-term ocean
in May and June-July. Operational research with these composites temperature fluctuation in the Pacific Ocean, which waxes and
provides a means of anticipating Canadian prairie May-August wanes about every 20-30 years. When the index is positive the
GDDs. west Pacific becomes cool and a wedge in the east Pacific warms.
The pattern reverses with a negative PDO. A positive (negative)
Summary and Conclusions PDO in the months leading up to the growing season tends to have
This research demonstrates the solar influence on spring wheat warmer, drier (cooler, wetter) influence on the Canadian prairies
growing degree days (GDDS) from June through August. A loss growing season weather.
of close to 100 GDDs was evident for the period 1985-2019, with
a loss of 70 GDDs in June-August and a further loss of 25 GDDs Solar Hibernation is a historic reduction in the energy output
in May. During agricultural year 11 (2020) of cycle #24 there has of the Sun that occurs about every 200 years. Earth has been
been an average of 2 sunspots per month. Based on the average experiencing solar hibernation since 2010 as a consequence of the
of 9 cycles during the 20th century solar activity is expected to Eddy solar minimum. Historical solar minimums in the past have
remain very low in agricultural years 12 (2021) and 13 (2022). been as follows: Dalton of 1795-1825, Maunder of 1645-1715,
Svensmark et al., 2017 propose that increased ionization produced the Sporer of 1450-1540 and Wolf of 1280-1340. These were
by cosmic rays (during low solar activity) can lead to growth all periods of global cooling Casey (2014) Archibald (2009) and
aerosols into cloud condensation nuclei. This mechanism suggests Plimer (2009).
increased cloud cover as the sun enters a grand solar minimum.
Eart & Envi Scie Res & Rev, 2020 www.opastonline.com Volume 3 | Issue 3 |177Acknowledgment on no-till canola emergence, maturity, yield and seed quality. Can.
We wish to thank Paul Degrace for his cartographic assistance, J. Plant Sci 92: 795-802.
Fred Oleson and Stan Scyrpetz of the Market Analysis Group in
Winnipeg for promptly providing grade pattern and protein content Landsheidt, T (2001 b) Trends in the Pacific Decadal Oscillation
data, and Patterson Grain and Wild Oats publishing for providing subjected to solar forcing. http://www.john-daly/theodore/
spring wheat price data. pdotrend.htm
References Landsheidt T (2003) New Little Ice Age Instead of Global
Archibald D (2014) Twilight of Abundance: Why Life in the 21st Warming? Energy and Environment 14: 327-350.
century will be Nasty, Brutish and Short. Regency Publishing
Washington D.C. 208. Morner N A (2015) The Approaching New Grand Solar Minimum
and Little Ice Age Climate Conditions. Natural Science, 7: 510-
Brouwer C, Heibloem M (1986) Irrigation water management: 518.
irrigation water needs. Training manual 3.
Newsweek, Science (1975) The Cooling World. April 28.
Butler CJ, DJ Johnson A (1996) A Provisional Long Mean Air
Temperature Series for Armagh Observatory Journal of Atmo Padbury et al. (2002) Agroecosystems and land resources of the
spheric and Solar Terrestrial Physics 58: 1657-1672. northern Great Plains, Agronomy Journal 94: 251-261.
Casey J L (2014) Dark Winter: How the Sun is causing a 30-Year Plimer I (2009) Heaven and Earth: global warming the missing
Cold Spell Humane Books, Boca Raton, Fl. U.S.A. 164. science’ with ‘Heaven and Earth: global warming the missing
science. Connor Court Publishing Ltd., Ballan, Victoria, Australia
Eddy John A (1976) The Maunder Minimum-The reign of Louis 503.
XIV appears to have been a time of real anomaly in the behavior
of the sun. Science, June 18, 192: 1189-1202. Reid G C (1997) Climatic Change 37: 391-405, 1997.Kluwer.
Academic Publishers.
Friis-Christensen E, K Lassen (1991) Length of the Solar cycle:
An Indicator of Solar Activity Closely Associated with Climate, Saiyed I M, et al. (2009) Thermal time models for estimating
Science 254: 698-700. wheat phenological development and weather-based relationships
to wheat quality, Can. J. of Plant Sci 89: 429-439.
Garnett E R (2009) Climate and Crop Letter, Volume 5, Number
1, August 26, 2009. Schwanz H L (1997) The Farm Weather Handbook’ with ‘The
Farm Weather Handbook’. Lessiter Publications, Inc.
Garnett E R (2002) Long-lead forecasting of precipitation and
wheat yields in Saskatchewan using teleconnection Indices. Soon W, Yaskell H S (2003) The Maunder Minimum and the
Master’s Thesis, Geography Department, Univ. of Saskatchewan Variable Sun- Earth Connection. World Scientific Publishing Co.
Archives, Saskatoon. Pte Ltd. Singapore 278.
Garnett et al. (2006) Cor relates of Canadian Prairie summer Stefanshi R M, et al. (1994) Major world crop areas and climatic
rainfall: implications for crop yields, Climate Research 32: 25-33. profiles. World outlook board, U.S. Department of Agriculture.
Handbook no 664.
Garnett E R and Khandekar M L Summer (2010) Wettest on the
Canadian Prairies in 60 Years- a preliminary assessment of cause Svensmark et al., (2017) Increased ionization supports growth of
and consequence. 2010.CMOS Bulletin SCMO Vol.38, No 6. aerosols into cloud condensation nuclei. Nature Communication.
December 2010. DOI; 10.10.1038/S41467-017-02082-2 published online
December 19, 2017.
Garnett E R and Khandekar M L (2015) Determinants of Summer
Weather Extremes over the Canadian Prairies: Implications for Svensmark, H. and Friis-Christenson E, 1997 Variation of
Long Lead Grain Forecasting. Natural Hazards 76: 1183- 1204. Cosmic Ray Flux and Global Cloud Coverage – a Missing link in
Solar-Climate Relationships, Journal of Atmospheric and Solar-
Garnett E R and Khandekar M L (2017) Weather and Climate Ex Terrestrial Physics, Vol. 59, pp 1225-32.
tremes on the Canadian Prairies: An Assessment with a focus on
Grain Production. Environment and Ecological Research 5: 255- Wheaton E (2011) The 1999-2005 Canadian Prairies Drought:
268. Science, Impacts and Lessons, Drought Research Initiative, R.
Harker KN, et al. (2012) Seeding depth and seeding speed effects Stewart and R. Lawford (Eds.), Department of Environment and
Eart & Envi Scie Res & Rev, 2020 www.opastonline.com Volume 3 | Issue 3 |178Geography, Univ. of Manitoba, Winnipeg.
Wild Oats News Letter (2020) Vol. 30 Number 39, June 30, 905-
167 Lombard Ave., Winnipeg, Manitoba.
Whitehouse D (2020) The Next Solar Cycle and Why it Matters
for Climate, Note 22, The Global Warming Policy Foundation.
Copyright: ©2020 Ray Garnett., This is an open-access article distributed
under the terms of the Creative Commons Attribution License, which
permits unrestricted use, distribution, and reproduction in any medium,
provided the original author and source are credited.
Eart & Envi Scie Res & Rev, 2020 www.opastonline.com Volume 3 | Issue 3 |179You can also read