DRAFT District of Columbia 2022 Annual Ambient Air Monitoring Network Plan - May 2021
←
→
Page content transcription
If your browser does not render page correctly, please read the page content below
District of Columbia
2022 Annual Ambient Air Monitoring
          Network Plan

             DRAFT
             May 2021

                          Monitoring and Assessment Branch
                                         Air Quality Division
                        Department of Energy & Environment
                            1200 First Street, NE, Fifth Floor
                                      Washington, DC 20002
(Page intentionally left blank)

DRAFT District of Columbia’s 2022 Ambient Air Monitoring Network Plan   ii
May 2021

Table of Contents
Acronyms and Definitions .............................................................................................................. v
Executive Summary ........................................................................................................................ 1
1.0 Introduction ............................................................................................................................... 2
1.1 The District’s Ambient Air Monitoring Strategy .............................................................. 3
2.0 District’s Ambient Air Network ............................................................................................... 5
3.0 District of Columbia’s Air Monitoring Stations ..................................................................... 21
3.1 River Terrace Station (11-001-0041) .............................................................................. 21
3.2 McMillan Station (11-001-0043)..................................................................................... 22
3.3 Takoma Recreation Center Station (11-001-0050) ......................................................... 23
3.4 Anacostia Freeway Near-Road Station (11-001-0051) ................................................... 24
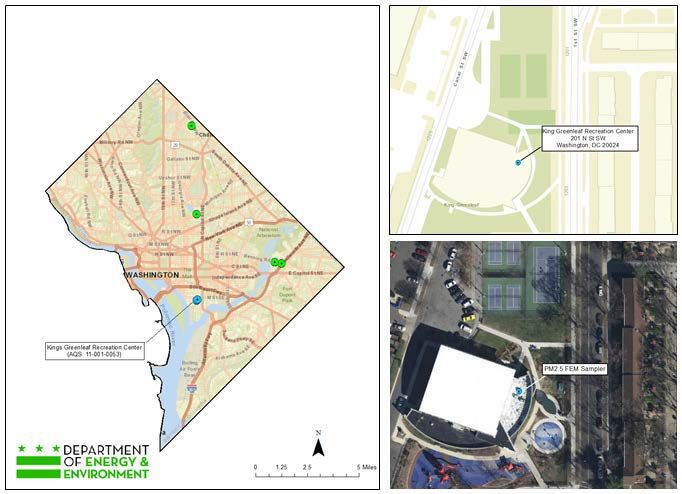
3.5 King Greenleaf Recreation Center Station (11-001-0053) .............................................. 25
4.0 Ozone and PM2.5 Air Quality .................................................................................................. 26
4.1 Annual PM2.5 Design Concentrations .............................................................................. 26
4.2 Daily PM2.5 Design Concentrations ................................................................................. 26
5.0 Network Changes and Upgrades............................................................................................. 30
5.1 River Terrace School (Site ID 11-001-0041) .................................................................. 30
5.2 McMillan (Site ID 11-001-0043) .................................................................................... 30
5.3 Takoma Recreation Center Site ID 11-001-0050)........................................................... 30
5.4 Anacostia Freeway Near-Road station (Site ID 11-001-0051) ....................................... 30
5.5 King Greenleaf Recreation Center (Site ID 11-001-0053) .............................................. 30
5.6 Hains Point (Site ID 11-001-0042).................................................................................. 30
5.7 Verizon (Site ID 11-001-0023)........................................................................................ 30
6.0 Air Monitoring Program and Data Contacts ........................................................................... 31
Appendix A ................................................................................................................................... 32
EPA Approval Letter for District’s Ambient Air Monitoring Network Plan for Calendar Year
2020 (dated October 28, 2019) ............................................................................................... 32
DRAFT District of Columbia’s 2022 Ambient Air Monitoring Network Plan iii
May 2021
Table of Tables
Table 2-1: Ambient Air Monitoring Network and Monitor Details ............................................... 7
Table 2-2: Monitoring Sites and Parameters of Each Monitor ....................................................... 7
Table 2-3: Monitor Count for the District’s Network ..................................................................... 9
Table 2-4: Monitoring Methods and AQS Codes ......................................................................... 10
Table 2-5: Constituent Compounds and Species Measured in the District .................................. 11
Table 2-6: Number of PM2.5 SLAMS Sites (based on Table D–5, Appendix D, 4.7.1(a) to 40
C.F.R. Part 58, PM2.5 Minimum Monitoring Requirements)........................................................ 16
Table 2-7: Number of Ozone SLAMS Sites (based on Table D–2, Appendix D,4.1(a) to 40
C.F.R. Part 58, Ozone Minimum Monitoring Requirements) ...................................................... 17
Table of Figures
Figure 2-1: The District’s Ambient Air Monitoring Network ........................................................ 6
Figure 3-1: River Terrace Site Locator Maps ............................................................................... 21
Figure 3-2: McMillan Reservoir Site Locator Maps..................................................................... 22
Figure 3-3: Takoma Recreation Center Site Locator Maps .......................................................... 23
Figure 3-4: Anacostia Freeway Near-Road Site Locator Maps .................................................... 24
Figure 3-5: King Greenleaf Recreation Center Site Locator Maps .............................................. 25
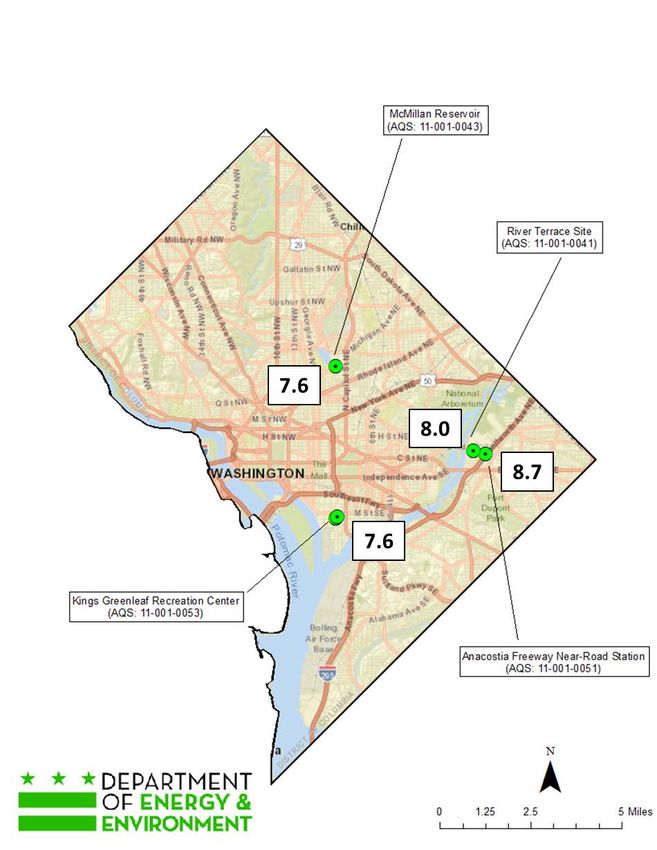
Figure 4-1: Annual PM2.5 Design Values ...................................................................................... 27
Figure 4-2: Daily PM2.5 Design Values......................................................................................... 28
Figure 4-3: Ozone Design Values ................................................................................................. 29
DRAFT District of Columbia’s 2022 Ambient Air Monitoring Network Plan iv
May 2021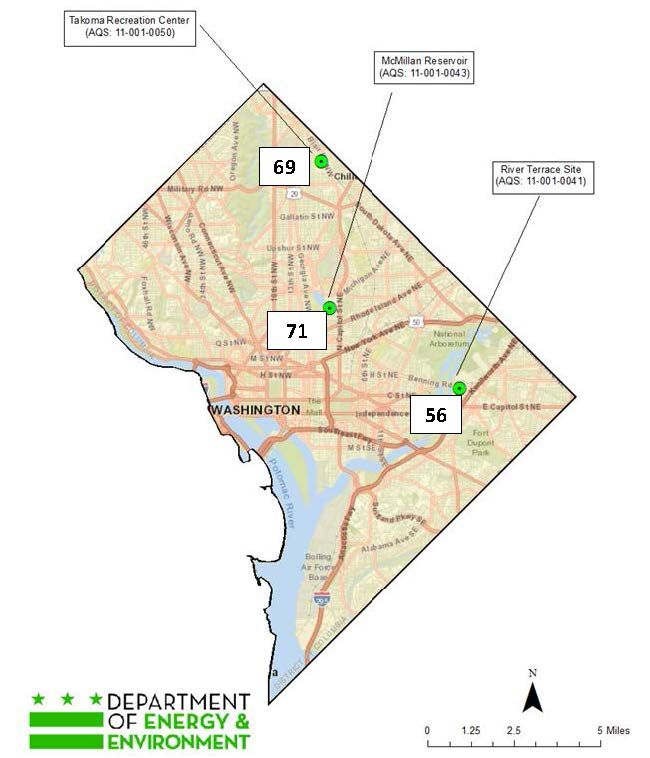
Acronyms and Definitions

AQI                 Air Quality Index
AQS                 Air Quality System
AQD                 Air Quality Division
BAM                 Beta Attenuation (Mass) Monitor – used for continuous measurements of particulate matter
CAA                 Clean Air Act
CAPS                Cavity Attenuated Phase Shift
C.F.R.              Code of Federal Regulations
CSN                 PM2.5 Chemical Speciation Network
CO                  Carbon Monoxide
DOEE                Department of Energy and Environment
EMP                 Enhanced Monitoring Plan
EPA                 U.S. Environmental Protection Agency
FEM                 Federal Equivalent Method
FID                 Flame Ionization Detector
FRM                 Federal Reference Method
GC                  Gas Chromatograph
HAPs                Hazardous Air Pollutants
IMPROVE             Interagency Monitoring of Protected Visual Environments
IR                  Infrared (radiation)
MAB                 Monitoring and Assessment Branch, Air Quality Division
MSA                 Metropolitan Statistical Area
NAA                 Non-Attainment Area
NAAQS               National Ambient Air Quality Standard
NATTS               National Air Toxic Trends Stations
NAMS                National Air Monitoring Station
NCore               National Core Monitoring Network
NO                  Nitrogen Oxide
NO2                 Nitrogen Dioxide
NOx                 Oxides of Nitrogen (ozone precursor)
NOy                 Total Reactive Nitrogen Species (ozone precursor)
O3                  Ozone
OC/EC               Organic Carbon/Elemental Carbon
PAHs                Polycyclic Aromatic Hydrocarbons
PAMS                Photochemical Assessment Monitoring network Stations
Pb                  Lead
PM2.5               Particulate matter with an equivalent diameter less than or equal to 2.5 µm
PM10                Particulate matter with an equivalent diameter less than or equal to 10 µm
QA                  Quality Assurance
SIP                 State Implementation Plan
SLAMS               State and Local Air Monitoring Stations
SO2                 Sulfur Dioxide
TSP                 Total Suspended Particles
TEOM                Tapered Element Oscillating Microbalance – used for continuous measurements of PM10 or PM2.5
UV                  Ultraviolet (radiation)
VOCs                Volatile Organic Compounds

DRAFT District of Columbia’s 2022 Ambient Air Monitoring Network Plan                                          v
May 2021

Executive Summary

The Clean Air Act mandates an ambient air quality surveillance system in state and local
jurisdictions including the District of Columbia (District). The U.S. Environmental Protection
Agency (EPA) codified the national ambient air monitoring regulations in Title 40 Code of
Federal Regulations (C.F.R.) Part 58. The regulations require state and local monitoring agencies
to conduct a periodic assessment of ambient air monitoring networks and propose any changes in
an annual ambient air monitoring network plan. Annual network plans need to be submitted to
EPA by July 1st of every year. This document is the District’s Annual Ambient Air Network Plan
(Network Plan) for calendar year 2022.

The District of Columbia Department of Energy and Environment (DOEE) is proposing no
changes to the District’s ambient air monitoring network in calendar year 2022. The District’s
existing ambient monitoring network will be maintained as described in the subsequent sections
of this Network Plan.

DRAFT District of Columbia’s 2022 Ambient Air Monitoring Network Plan                            1
May 2021

1.0 Introduction
In 1970, Congress passed the Clean Air Act (CAA) and authorized the U.S. Environmental
Protection Agency (EPA) to establish National Ambient Air Quality Standards (NAAQS) for
pollutants that threaten human health and welfare. Primary standards are set according to criteria
designed to protect public health, including sensitive populations such as children and the
elderly. Secondary standards are set to minimize harm to public welfare and the environment
(e.g., decreased visibility, damage to crops, vegetation, and buildings).

Six pollutants currently have NAAQS: ozone (O3), carbon monoxide (CO), sulfur dioxide (SO2),
nitrogen dioxide (NO2), particulate matter (less than 10 microns, PM10; and less than 2.5 microns
aerodynamic diameter, PM2.5), and lead (Pb). These are commonly known as “criteria” air
pollutants. When air quality does not meet the NAAQS for one of the criteria pollutants, the area
is said to be in “nonattainment” of the standard for that pollutant.

Air pollution comes from many sources including on-road vehicles (cars, trucks, buses, and
motorcycles), off-road equipment (locomotives, boats, construction equipment, lawn mowers),
area sources (small stationary sources that cumulatively impact air quality such as gas stations,
auto maintenance facilities, painting operations, consumer products usage), large stationary
sources (factories, power plants), and even fires. The CAA requires that state and local air
agencies operate and maintain ambient air surveillance networks to measure pollutant
concentrations. DOEE uses its ambient monitoring network to track changes in the District’s
ambient air and to evaluate the District’s compliance with the NAAQS.

Ambient air quality monitoring in the District began in the late 1950s, prior to the establishment
of EPA. The first monitors were simple mechanisms or passive collectors such as dust-fall
buckets and tape samplers. These were followed in the 1960s by wet-chemistry instruments,
which were soon replaced by more advanced electronic automated instruments. The addition of
computer technology in the late 1970s and early 1980s to operate monitoring systems and collect
air data was critical to the development of the core monitoring network that exists today.

Over the years, monitoring goals have shifted based on changes in the NAAQS. On October 1,
2015, EPA strengthened the NAAQS for ground-level ozone to 70 parts per billion (ppb), based
on extensive scientific evidence about ozone’s effects on public health and welfare. The updated
standards will improve public health protection, particularly for at-risk groups including
children, older adults, people of all ages who have lung diseases such as asthma, and people who
are active outdoors, especially outdoor workers. EPA designated the District as a marginal
nonattainment area for the 2015 ozone NAAQS, based on 2014-2016 air quality data. Formal
attainment plans for the 2015 standards are due beginning in August 2020. Note that the District
attained the old 2008 ozone NAAQS and submitted a redesignation request and maintenance
plan for the old NAAQS to EPA, which have both been approved as of July 16, 2019.

In 2014, EPA redesignated the District from nonattainment to attainment of the 1997 annual
NAAQS for PM2.5 (15 µg/m3), and also designated the District as an attainment area for the more
stringent 2012 annual NAAQS (12 µg/m3). 79 Fed. Reg. 60081 (October 6, 2014). The District is
in compliance with the 2012 PM2.5 NAAQS and continues to maintain the standards.
DRAFT District of Columbia’s 2022 Ambient Air Monitoring Network Plan                               2
May 2021
As required by federal air monitoring regulations, the District’s monitoring network is designed
to study expected high pollutant concentrations, high population density, significant sources,
general background concentrations, and regional transport.

In October 2006, EPA issued final regulations that require periodic assessment of monitoring
networks. As described in 40 C.F.R. § 58.10, the following information for existing and
proposed site(s) must be included in a Network Plan:

      1.  Air Quality System (AQS) site identification number;
      2.  Site location, including street address and geographical coordinates;
      3.  Sampling and analysis method(s) for each measured parameter;
      4.  Operating schedules for each monitor;
      5.  Any proposals to remove or move a monitoring station within a period of 18 months
          following plan submittal;
      6. Monitoring objective and spatial scale of representativeness for each monitor;
      7. The identification of any sites that are suitable and sites that are not suitable for
          comparison against the annual PM2.5 NAAQS or 24-hour PM10-2.5 NAAQS as described
          in § 58.30;
      8. Metropolitan Statistical Area (MSA), Core Based Statistical Area (CBSA), Combined
          Statistical Area (CSA), or other area represented by the monitor;
      9. The designation of any Pb monitors as either source-oriented or non-source-oriented
          according to Appendix D to 40 C.F.R. Part 58;
      10. Any source-oriented monitors for which a waiver has been requested or granted by the
          EPA Regional Administrator as allowed for under § 4.5(a)(ii) of Appendix D to 40
          C.F.R. Part 58;
      11. Any source-oriented or non-source-oriented site for which a waiver has been requested or
          granted by the EPA Regional Administrator for the use of Pb-PM10 monitoring in lieu of
          Pb-TSP monitoring as allowed in § 2.10 of Appendix C to 40 C.F.R. Part 58; and
      12. The identification of required NO2 monitors as either near-road or area-wide sites in
          accordance with Appendix D, Section 4.3 of 40 C.F.R. Part 58.

This Annual Ambient Air Monitoring Network Plan for the District for calendar year 2022
contains a description of the District’s monitoring program, various parameters within the
network, and additional monitoring station information. It also confirms that the District’s air
monitoring program continues to meet federally established monitoring and data assessment
criteria.

1.1        The District’s Ambient Air Monitoring Strategy

Ambient air monitoring systems are a critical part of the District’s air quality management
program. Air quality management involves a cycle of monitoring the quality of the ambient air,
setting air quality standards and objectives, identifying and implementing control strategies, and
measuring progress. Air monitoring data is used throughout this process to help:
        • Determine compliance with the NAAQS;
        • Characterize air quality and pollutant trends;

DRAFT District of Columbia’s 2022 Ambient Air Monitoring Network Plan                                3
May 2021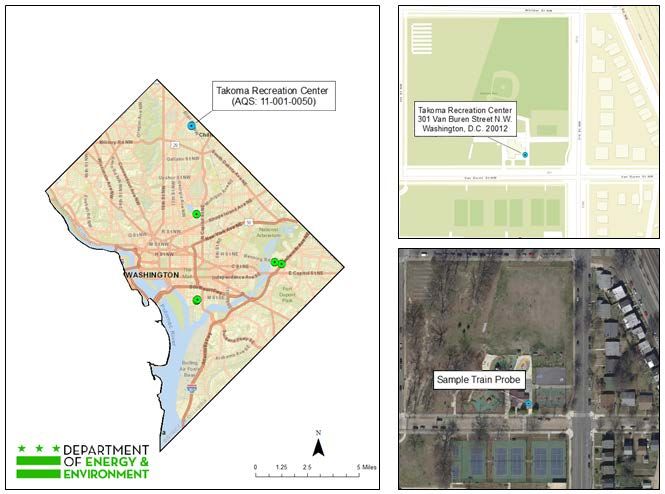
•    Estimate health risks and ecosystem impacts;
          •    Develop and evaluate emission control strategies;
          •    Evaluate source-receptor relationships;
          •    Provide input data for models and evaluating models;
          •    Measure overall progress of air pollution control programs; and
          •    Inform air quality forecasts and other public outreach air quality reports.

Over the last 25 years, ambient levels of criteria pollutants have decreased significantly in the
District due to the implementation of various control measures. In the 1980s, the introduction of
automobiles equipped with catalytic converters resulted in significant reductions in NO2, carbon
monoxide (CO), and volatile organic compounds (VOCs). The phasing out of leaded gasoline
led to a significant drop in ambient lead (Pb) levels. Since then, various control strategies for
stationary sources, on-road and off-road vehicles, and non-point area sources have reduced sulfur
dioxide (SO2), nitrogen oxide (NOx), PM2.5, and PM10 levels in the ambient air. There is also
less formation of problematic ozone, although the District still remains in nonattainment of 8-
hour ground-level ozone standards.

DRAFT District of Columbia’s 2022 Ambient Air Monitoring Network Plan                          4
May 2021
2.0 District’s Ambient Air Network
The Monitoring and Assessment Branch (MAB) in DOEE’s Air Quality Division operates,
maintains, and performs all functions of the ambient air monitoring program required by the
CAA. The District’s network currently consists of five (5) monitoring sites. Sampling covers
criteria air pollutants, PM2.5 mass and chemical speciation, and enhanced monitoring for ozone
and its precursor pollutants with a photochemical assessment monitoring station (PAMS) for
measuring speciated VOCs, NOx, carbonyls, air toxics, and surface and meteorological
parameters.
One of the significant elements of the October 2006 monitoring regulations was the
establishment of a multi-pollutant National Core (NCore) monitoring network to provide trace-
level air quality measurements. The District launched an NCore station at its McMillan site (11-
001-0043) in January 2011. Then, to fulfill the monitoring requirements of the 2008 Pb
NAAQS, DOEE established an ambient Pb monitor at the NCore site in January 2012, which
was later terminated at the end of 2016 after monitoring requirements were revised. In August
2017, a special purpose monitor was installed to determine PM2.5 pollution at the King Greenleaf
Recreation Center in the Buzzard Point community. The King Greenleaf Recreation Center site
(11-001-0053) officially became part of the SLAMS network as of January 2018. The Hains
Point monitor has been permanently shut down.
During the calendar year 2015, the District’s network expanded with the addition of a new
Anacostia Freeway Near-Road air monitoring station. Also, in early 2015, an experimental
Village Green park bench air monitoring station with low-cost emerging air sensor technology
was established in the District. The park bench air monitoring station is primarily for technology
demonstration and public education purposes and it is not part of the District’s regulatory
network of air monitoring stations.
The District’s 2020 Annual Network Plan was approved by EPA on October 28, 2019. There
were several changes proposed in that plan, which have all been approved by EPA. The changes
included the following:
i) Permanently decommission the SO2 monitor at the River Terrace ambient monitoring
station (11-001-0041)
ii) Establish the King Greenleaf Recreation Center (11-001-0053) station in the Buzzard
Point area as part of the District’s ambient network
iii) Decommission the Hains Point monitoring station (11-001-0042) permanently
Figure 2-1 and Tables 2-1 through Table 2-5 below include information about the District’s five
air monitoring sites (green points) used for regulatory purposes and the measured pollutant
parameters.
DRAFT District of Columbia’s 2022 Ambient Air Monitoring Network Plan 5
May 2021Figure 2-1: The District’s Ambient Air Monitoring Network DRAFT District of Columbia’s 2022 Ambient Air Monitoring Network Plan 6 May 2021
Table 2-1: Ambient Air Monitoring Network and Monitor Details
Distance
Latitude, Traffic
City, County, Location Nearest Traffic From Metro Statistical
Site Name, AQS ID Street Address Longitude Count
ZIP Setting Road Count nearest Area (MSA)
(UTM) Year
road (m)
Michiga
McMillan Washington +38.921847 DC-Arlington-
2500 1st St., N.W. Urban n Ave. 23,700 2015 100
11-001-0043 DC 20001 -77.013178 Alexandria
NW
River Terrace 420 34th Street Washington, +38.895572 Benning DC-Arlington-
Urban 35,200 2015 100
11-001-0041 N.E. DC 20019 -76.958072 Rd. Alexandria
Blair
Takoma Recreation Center 301 Van Buren St., Washington, +38.970092 DC-Arlington-
Urban Rd., 18,900 2015 200
11-001-0050 N.W. DC 20012 -77.016715 Alexandria
N.W.
Anacosti
Anacostia Freeway Near- 3600 Benning
Washington, +38.894770 a 127,30 DC-Arlington-
Road Station Road N.E. @ Urban 2015 10
DC 20019 -76.953426 Freeway 0 Alexandria
11-001-0051 Anacostia Freeway
I-295
King Greenleaf Recreation South
Washington, +38.875161 DC-Arlington-
Center 201 N St S.W. Urban Capitol 45,500 2015 320
DC 20019 -77.012816 Alexandria
11-001-0053 SW
Table 2-2: Monitoring Sites and Parameters of Each Monitor
Probe
Site Name, Start Method Measurement MonitorNetwork/
Parameter Heigh Monitoring Objective Sample Schedule
AQS ID Date Code Scale Type
t (m)
Nitrogen
Population
Dioxide, Nitric
6/1/1994 074 3 Exposure/Max SLAMS/PAMS Hourly
Oxide Urban
Precursor
NOy (Total
PopulationExposure
reactive nitrogen 1/1/2011 691 3 Urban SLAMS/NCore Hourly
General/Background
oxides)
True Nitrogen General/Background
1/1/2020 212 3 Urban PAMS Hourly
Dioxide Max Precursor
Population Exposure
SO2 (trace) 1/1/2011 592 3 Urban SLAMS/NCore Hourly
General/Background
Population Exposure
CO (trace) 1/1/2011 588 3 Urban SLAMS/NCore Hourly
General/Background
PM10-2.5 coarse 1/1/2011 185 3 Urban General/Background SLAMS/NCore Hourly
11-001-0043
McMillan
126/142/ Neighborhood/ General/Background, Hourly/ Every 6
Type 2 PAMS 6/1/1994 3 PAMS
102 Urban Max Precursor Days
Neighborhood/ Population
SLAMS/PAMS
Ozone 6/1/1994 047 3 Urban Exposure/Highest Hourly
NCore
Concentration
PM2.5 Continuous Urban
1/1/2003 209 4 Population Exposure SLAMS Hourly
PM10
Urban
Continuous 1/1/2003 170/240 4 Population Exposure SLAMS Hourly
PM10-2.5
Urban
Continuous 1/1/2003 170/240 4 Population Exposure SLAMS/Ncore Hourly
Urban
PM2.5 1/1/1999 145 4 Population Exposure SLAMS/NCore Every 6 Days
PM2.5 Chemical Population
1/1/2002 000 4 Urban CSN Every 3 days
Speciation Exposure/Trends
DRAFT District of Columbia’s 2022 Ambient Air Monitoring Network Plan 7
May 2021Probe
Site Name, Start Method Measurement MonitorNetwork/
Parameter Heigh Monitoring Objective Sample Schedule
AQS ID Date Code Scale Type
t (m)
Population
Air Toxics 1/1/2001 150 4 Urban NATTS Every 6 Days
Exposure/Trends
PM10 Population
1/1/2001 162 4 Urban NATTS Every 6 Days
High-Vol Exposure/Trends
Population
Black Carbon 1/1/2001 894 4 Urban NATTS Hourly
Exposure/Trends
Nitric Oxide
5/1/1993 074 4 Neighborhood Population Exposure SLAMS Hourly
Nitrogen Dioxide
5/1/1993 074 4 Neighborhood Population Exposure SLAMS Hourly
River Terrace
11-001-0041
Oxides of
5/1/1993 074 4 Neighborhood Population Exposure SLAMS Hourly
Nitrogen
Population
Ozone 5/1/1993 047 4 Neighborhood Exposure/Highest SLAMS Hourly
Concentration
PM2.5 1/1/1999 209 4 Neighborhood Population Exposure SLAMS Hourly
Nitric Oxide
1/1/2013 074 4 Neighborhood Population Exposure SLAMS Hourly
Takoma Recreation
Nitrogen Dioxide
11-001-0050
1/1/2013 074 4 Neighborhood Population Exposure SLAMS Hourly
Center
Oxides of
1/1/2013 074 4 Neighborhood Population Exposure SLAMS Hourly
Nitrogen
Population
Ozone 1/1/2013 047 4 Neighborhood Exposure/Max Ozone SLAMS Hourly
Concentration
Source
Anacostia Freeway Near-Road Station
Nitric Oxide 1/1/2015 599 4 Microscale Oriented/Highest Near-Road SLAMS Hourly
Concentration
Source
Nitrogen Dioxide 1/1/2015 599 4 Microscale Oriented/Highest Near-Road SLAMS Hourly
Concentration
11-001-0051
Source
Oxides of
1/1/2015 599 4 Microscale Oriented/Highest Near-Road SLAMS Hourly
Nitrogen
Concentration
Source
Carbon
1/1/2015 593 4 Middlescale Oriented/Highest Near-Road SLAMS Hourly
Monoxide
Concentration
Source
PM2.5 1/1/2015 209 4 Microscale Oriented/Highest Near-Road SLAMS Hourly
Concentration
11-001-0053
Recreation
Greenleaf
Center
King
PM2.5 1/1/2018 209 4 Urban Population Exposure SLAMS Hourly
DRAFT District of Columbia’s 2022 Ambient Air Monitoring Network Plan 8
May 2021Table 2-3: Monitor Count for the District’s Network
Site
King
Pollutant Parameter/ Pollutant Group River Takoma Anacostia Monitor
McMillan Greenleaf
Terrace Recreation Freeway Count
Reservoir Recreation
School Center Near-Road Totals
Center
CO 1 1
O3 1 1 1 3
PM2.5 (FRM) 1 1
NO 1 1 1 1 4
NO2 1 1 1 1 4
NOx 1 1 1 1 4
NOy 1 1
True NO2 1 1
Trace CO 1 1
Trace SO2 1 1
PM2.5 (Continuous) 1 1 1 1 4
PM10 (Continuous) 1 1
PM10-2.5 (Continuous) PMcoarse 1 1
Speciated PM2.5 1 1
PM2.5 Black Carbon (OC/EC)-URG 1 1
Air Toxics 1 1
PAH Compounds (Air Toxics) 1 1
Air Toxics Metals (PM10) 1 1
OC/EC - Aethalometer 1 1
PAMS VOCs /Carbonyls 1 1
PAMS VOCs Continuous (Auto-GC) 1 1
Surface Meteorology 1 1 2
Ceilometer 1 1
Total 22 5 4 1 6 38
DRAFT District of Columbia’s 2022 Ambient Air Monitoring Network Plan 9
May 2021Table 2-4: Monitoring Methods and AQS Codes
Parameter Method Code Sample Analysis Description
Cryogenic Pre-concentration: GC/MS Solid
Air Toxics 150
Phase Micro Extraction: GC/MS
Carbon Monoxide, Trace 588 Gas Filter correlation EcoTech EC9830T
Carbon Monoxide, Trace 593 Gas Filter correlation API T300U
Nitric Oxide and Nitrogen Dioxide 074 Chemiluminescence
Nitric Oxide and Nitrogen Dioxide 599 Chemiluminescence
Chemiluminescence EcoTech EC9843
Total Reactive Nitrogen Oxides 691/699
Chemiluminescene API T200U
API T500U - CAPS (Cavity Attenuated Phase
True-Nitrogen Dioxide 212
Shift)
PAH 118 Tisch PUF
PAMS VOCs 142 Gas Chromatograph with Flame; GC FID
PAMS Carbonyls 102 High Performance Liquid Chromatography
PAMS VOCs 126 Cryogenic Pre-concentration Trap GC/FID
Ozone 047 Ultra Violet Photometry
Beta Attenuation Mass Monitor – PM10 FEM with
PM10 Continuous 170
glass fiber filter tape
PM10 High-Vol 162 Gravimetric Hi Vol SSI EcoTech 3000
PM2.5 145 Gravimetric R&P Model 2025
PM2.5 Speciation: Trace Elements 811 Energy Dispersive XRF using Teflon Filter
PM2.5 Species Constituents: Ions 812 Ion Chromatography using Nylon Filter
PM2.5 Species Constituents: Organics 838 Thermo-Optical Transmittance using Quartz Filter
Paired Gravimetric difference, MET ONE BAM-
PM10-2.5 Coarse 185
1020 system
PM2.5 Continuous 209 Met One BAM-1022 Monitor – PM2.5 FEM
PM2.5 – Black Carbon 894 McGee Scientific Model AE33-7 Dual Spot
Sulfur Dioxide, Trace 592 Ultraviolet Pulsed Fluorescence EC9850T
Sulfur Dioxide, Trace 600 Ultraviolet Fluorescence API 100 EU
DRAFT District of Columbia’s 2022 Ambient Air Monitoring Network Plan 10
May 2021Table 2-5: Constituent Compounds and Species Measured in the District
Constituent
Compounds in the Constituent Group
Group
Dichlorodifluoromethane, Chloromethane, 1,2-Dichloro-1,1,2,2,tetrafluoroleth, Chloroethene,
1,3-Butadiene, Bromomethane, Chloroethane, Trichlorofluoromethane, Acrolein, Acetone,
1,1-Dichloroethene, Methylene Chloride, Carbon disulfide, Isopropyl Alcohol,
1,1,2-Trichloro-1,2,2-trifluoroethane, Trans-1,2-Dichloroethene, 1,1-Dichloroethane,
2-methoxy-2-methyl-Propane, Methyl ethyl Ketone (2-butanone), Cis-1,2-Dichloroethene, Hexane, Chloroform,
Ethyl Acetate, Tetrahydrofuran, 1,2-Dichloroethane,
Air Toxics 1,1,1-Trichloroethane, Benzene, Carbon tetrachloride, Cyclohexane, 1,2-Dichloropropane, Bromodichloromethane,
Trichloroethylene, Heptane, Cis-1,3-Dichloro-1-Propene,
Methyl Isobutyl Ketone , Trans-1,3-Dichloro-1-Propene, 1,1,2-Trichloroethane, Toluene, Dibrochloromethane,
Methyl butyl Ketone, (2-Hexanone), 1,2-Dibromoethane, Tetrachloroethylene, Chlorobenzene, Ethyl benzene, m &
p- Xylene, Bromoform (Tribromomethane), Styrene, 1,1,2,2-Tetrachloroethane, o-Xylene, 1-Ethyl-4-
Methylbenzene, 1,3,5-Trimethylbenzene, 1,2,4-Trimethylbenzene, Benzyl Chloride, 1,3-dichlorobenzene,1,4-
Dichlorobenzene, 1,2-Dichlorobenzene, 1,2,4-Trichlorobenzene, and Hexachloro-1,3-Butadiene
Acetone, Ethane, Ethylene, Acetylene, Propane, 2,2-dimethylbutane, Benzene, i-Butane, n-Butane,
i-Pentane, n-Pentane, 2,2,4-trimethylpentane, i-Propylbenzene, n-hexane,
2-methylpentane, 2,3-dimethylbutane, Cyclopentane, Ethylbenzene, n-Propylbenzene,
3-methylpentane, Toluene, Styrene, n-Heptane, 2-methylhexane, 2,4-dimethylpentane, 2,3,4-trimethylpentane, o-
Xylene, 3-methylhexane, 2,3-dimethylpentane, Formaldehyde,
PAMS
n-Octane, 2-methylheptane, Cyclohexane, 3-methylheptane, n-Nonane, m&p-Xylenes, Methylcyclohexane,
VOCs
Methylcyclopentane, n-Decane, n-Undecane, Acetaldehyde, P-Ethyltoluene, M-Ethyltoluene, O-Ethyltoluene,
1,2,3-Trimethylbenzene, 1,2,4-Trimethylbenzene, 3-methyl-1-butene, 1-Butene, Propene,
1-Pentene, 1,3,5-Trimethylbenzene, 2-methyl-1-pentene, 2-methyl-2-butene, c-2-hexene,
c-2-pentene, c-2-Butene, Cyclopentene, 4-methyl-1-pentene, t-2-hexene, t-2-Butene,
t-2-pentene, Isoprene, 1,3 Butadiene, Alpha Pinene, Beta Pinene
PAMS Acetaldehyde, Formaldehyde, Acetone,Acrolein,Methyl Isobutyl Ketone,Methyl Ethyl Ketone,Propionaldehyde,
Carbonyls Benzaldehyde
Aluminum, Ammonium, Antimony, Arsenic, Barium, Bromine, Cadmium, Calcium, Carbonate carbon, Cerium,
Cesium, Chlorine, Chromium, Cobalt, Copper, Elemental carbon, Europium, Gallium, Gold, Hafnium, Indium,
Speciated Iridium, Iron, Lanthanum, Lead, Magnesium, Manganese, Mercury, Molybdenum, Nickel, Niobium, Nitrate, OCX,
PM2.5 Mass OCX2, Organic carbon, Phosphorus, Pk1_OC, Pk2_OC, Pk3_OC, Pk4_OC, Potassium, PyrolC, Rubidium,
Samarium, Scandium, Selenium, Silicon, Silver, Sodium, Strontium, Sulfate, Sulfur, Tantalum, Terbium, Tin,
Titanium, Total carbon, Vanadium, Wolfram, Yttrium, Zinc, and Zirconium
DRAFT District of Columbia’s 2022 Ambient Air Monitoring Network Plan 11
May 20212.1 Ambient Air Monitoring Networks Each of the District’s monitoring stations is individually part of one or more of the national ambient air monitoring networks. The following sections describe each monitoring network type. State and Local Air Monitoring Station (SLAMS): SLAMS measure ambient levels of gaseous and particulate air pollutants. SLAMS represent the majority of all criteria pollutant (SO2, NO2, CO, O3, Pb, PM2.5, PM10) monitoring across the nation. These stations use federal reference or federal equivalent methods (FRM/FEM) for direct comparison to the NAAQS to determine whether areas are in attainment or nonattainment of the air quality standards. There are approximately 4,000 SLAMS monitoring stations nationwide. The distribution of stations in the SLAMS Network is determined in large part by the needs of state and local air pollution control agencies to meet State Implementation Plan (SIP) requirements. The District’s network consists of five (5) SLAMS. National Air Monitoring Station (NAMS) Network: The NAMS network, developed in the 1970s, is a subset of the SLAMS network. NAMS stations use FRM/FEM for direct comparison to the NAAQS. In the early 1980s, the networks began to add PM10 monitors, and then expanded to include PM2.5 monitors, beginning in 1999, to assess attainment with the 1997 PM2.5 NAAQS. The network consists of ambient monitoring sites that measure PM2.5 mass. The NAMS are designated as national trends sites and, in some cases, also serve as design value sites for Metropolitan Statistical Areas (MSAs). Near-Roadway Monitoring Network: The 2010 NO2 NAAQS required establishment of a network with at least two (2) near-roadway NO2 monitors in the Washington DC-MD-VA-WV MSA. Measurements for pollutants such as NO2, CO, PM2.5 and surface meteorological measurements for wind direction and wind speed are required at primary near-road sites. The District established a near-road station along the Anacostia Freeway in River Terrace community (site ID: 11-001-0051) in April 2015. The near-road station consists of NO2 and CO trace gas analyzers, BAM FEM continuous monitor to measure PM2.5, and surface meteorological measurements for wind speed, wind direction, relative humidity, barometric pressure and ambient temperature. NCore Monitoring Network: In October 2006, EPA revised the national air quality monitoring regulations (40 C.F.R. Part 58). The most significant element of the revised regulations was to establish an NCore multi-pollutant monitoring network by January 1, 2011. Measurements for pollutants such as ozone, trace SO2, DRAFT District of Columbia’s 2022 Ambient Air Monitoring Network Plan 12 May 2021
trace CO, total reactive nitrogen oxides (NOy) and PMcoarse (PM10-2.5; PM between 10 microns
and 2.5 microns in diameter), and surface meteorological measurements for wind speed, wind
direction, relative humidity, and ambient temperature are required at NCore sites. Ambient Pb
monitoring was also required at NCore sites beginning in January 2012. In April 2016, EPA
revised the national air quality monitoring regulations (40 C.F.R. Part 58 Appendix D) section
3(b) and section 4.5(b)(c) to remove the requirements for NCore sites to measure Lead (Pb) as
well as the speciated components of PMcoarse (PM10-2.5 ).

The District established an NCore station at the McMillan site (11-001-0043) in January 2011.
The NCore station consists of SO2 and CO trace gas analyzers, a NOy analyzer, and a BAM FEM
monitor to measure PM10-2.5. A TSP-Pb FRM monitor was added at the McMillan NCore station
in January 2012. DOEE shut down the Pb monitor under the provisions of the revised 40 C.F.R.
Part 58, at the end of 2016 monitoring period.

Photochemical Assessment Monitoring Stations Network:

The Photochemical Assessment Monitoring Stations (PAMS) network was developed in the
1990s to provide an air quality database that will assist in evaluating and modifying control
strategies for attaining the ozone NAAQS. The measured parameters include ozone, VOCs,
carbonyls and NOx. The national PAMS network consists of forty-three (43) sites in twenty-five
(25) metropolitan areas. PAMS was a major addition to state and local networks, with near-
research grade measurements for over 56 VOC compounds during the core part of the ozone
season (June to August).

The District operates one (1) PAMS Type 2 station at the McMillan site. In 2011, DOEE
deployed Vaisala WXT 520 meteorological monitoring sensors on a new 10-meter tower at the
McMillan PAMS/NCore site. The District has since updated its suite of meteorological
instruments to satisfy the 2015 PAMS monitoring requirements.

The 2015 amendments to the national ambient monitoring regulations (40 C.F.R. Part 58,
Appendix D, Section 5) revised the PAMS monitoring requirements in conjunction with the
promulgation of the 2015 8-hour ozone NAAQS of 70 ppb. These amendments require changes
to PAMS monitoring and implementation of an enhanced monitoring plan (EMP) by 2021 in
certain areas of the nation, including the District. The new requirements are as follows:
    • Hourly averaged speciated volatile organic compounds (VOCs);
    • Three 8-hour averaged carbonyl samples per day on a 1 in 3 schedule;
    • Hourly averaged Ozone (O3), nitrogen oxide (NO), true nitrogen dioxide (NO2), and total
        reactive nitrogen (NOy);
    • Hourly averaged of ambient temperature, vector-averaged wind direction and wind speed,
        atmospheric pressure, relative humidity, precipitation, solar radiation and ultraviolet
        radiation; and
    • Hourly averaged of mixing-height.

For the District, this requirement may be met by collecting PAMS measurements at the
McMillan NCore station. This site is already designated as a PAMS site under the existing
PAMS regulatory requirements. The District adopted the national PAMS QAPP and SOPs and
DRAFT District of Columbia’s 2022 Ambient Air Monitoring Network Plan                            13
May 2021
will follow the guidance presented in the PAMS TAD. These required DC-specific documents have been submitted to EPA and was approved on 7 July 2020. Based on 40 C.F.R. part 58, Appendix D, state air monitoring agencies were initially required to begin making PAMS measurements at their NCore location(s) by June 1, 2019. The equipment needed to measure PAMS parameters were to be purchased by USEPA using a nationally negotiated contract and delivered to the monitoring agencies. USEPA has announced that due to contract delays, the necessary equipment would not be delivered in time to begin making PAMS measurements by June 1, 2019. USEPA finalized a rule on January 8, 2020 to extend the start date of PAMS measurements to June 1, 2021. The District was able to deploy the entire suite and make all PAMS measurements at the McMillan NCore site by January 2020. As part of the new requirements, DOEE has updated its suite of meteorological instruments. DOEE has started measurements at the District’s PAMS site for the following PAMS compounds/parameters: Ozone Hourly averaged ozone is measured year round using a Thermo 49i. Nitrogen Oxides Hourly averaged NO, NOy and true NO2 will be measured at a minimum, from June through August. True NO2 will be measured using Teledyne API Model 500U CAPS NO2 analyzer. NO and NOy will be measured using a Teledyne API Model T200U. Hourly Speciated VOCs Hourly averaged speciated VOCs will be measured year-round with Markes-Agilent Auto GC system. Carbonyls Carbonyls will be sampled at a frequency of three 8-hour samples on a 1-in-3 day basis during the core ozone season (i.e., June through August) using an ATEC Model 8000-2 Eight Channel Automated Carbonyl sampler with co-located independent channel. Samples will be analyzed by EPA Method TO-11A. Meteorological Parameters Hourly averages of ambient temperature and relative humidity are measured using the Vaisala HMP155; vector-averaged wind direction and wind speed are measured by the Vaisala WMT702; atmospheric pressure is recorded using the Vaisala PTB110;precipitation is measured using the Met One 385; solar radiation is measured by the Kipp and Zonen CMP6; ultraviolet A & B radiation is measured by the Kipp and Zonen SUV5; and the hourly averaged mixing layer height is measured using the Vaisala Model CL51 ceilometer. As a jurisdiction in the Ozone Transport Region (OTR), the District is required to adopt an EMP no later than October 1, 2019. The District’s EMP was approved by EPA on October 28, 2019. DRAFT District of Columbia’s 2022 Ambient Air Monitoring Network Plan 14 May 2021
A Pandora spectrometer was installed in August of 2020 by EPA-ORD’s contractor at McMillan
site. The Pandora instruments study the atmosphere by using spectroscopy, delivering total
column profiles of the atmosphere, including ozone, nitrogen dioxide and formaldehyde. Pandora
spectrometer tracks either the sun or moon to collect light through the total atmospheric column
at wavelengths between 291 nm to 523 nm; collected data gives information on the trace gases,
specifically ozone, NO2 and formaldehyde.

Special Purpose Monitoring Networks:

Special Purpose Monitoring (SPM) networks include National Air Toxic Trends Stations
(NATTS), PM2.5 Chemical Speciation Network (CSN), and other special purpose monitors.

Currently, the District’s SPM network consists of: one (1) NATTS, and one (1) CSN station at
the McMillan site.

Through a partnership with DOEE, EPA installed a Village Green station at the Smithsonian
National Zoological Park (National Zoo) in the District in 2015. The Village Green park bench
stations are intended for research and education on air quality and they are not meant for use as
regulatory monitors.

Interagency Monitoring of Protected Visual Environments Network:

The Interagency Monitoring of Protected Visual Environments (IMPROVE) program was
established in 1985 to help implement plans to reduce visibility impairment in Class I areas
(large federally-protected national parks and wilderness areas) as stipulated in the CAA. There
are about 110 IMPROVE sites in Class I visibility protection areas. These sites collect aerosol
samples and analyze the filters for trace elements, major ions, and carbon fractions. Most of the
IMPROVE sites are operated by federal agencies within the U.S. Department of the Interior.

The U.S. National Park Service (NPS) operated one (1) IMPROVE site along with a
nephelometer at the Hains Point station in the District until June of 2015.

2.2       Pollutant Parameters

DOEE operates a comprehensive air monitoring network covering a range of pollutants. This
section presents descriptions segregated by pollutant parameter.

Fine Particulate Matter (PM2.5)

PM2.5 FEM Monitors: DOEE operates four (4) automated BAM 1022 PM2.5 monitors in its air
monitoring network – one (1) each at the Anacostia Freeway Near Road, River Terrace
McMillan stations and the King Greenleaf Recreation Center site. The McMillan, Anacostia
Freeway Near-Road, River Terrace and King Greenleaf Recreation Center primary monitors are
continuous hourly sampling schedule. The required collocated secondary PM2.5 FRM monitor at
McMillan is operated on a 1-in-6 day sampling schedule.

DRAFT District of Columbia’s 2022 Ambient Air Monitoring Network Plan                           15
May 2021
DOEE replaced the PM2.5 network FRM monitors with continuous FEM monitors beginning of
the calendar year 2017.

Table 2-6: Number of PM2.5 SLAMS Sites (based on Table D–5, Appendix D, 4.7.1(a) to 40
C.F.R. Part 58, PM2.5 Minimum Monitoring Requirements)
                                                          Annual        Daily

                                                                                                            Required

                                                                                                            NAAQS
                                                          Design        Design     Required    Monitors

                                                                                                             ≥ 85%
           MSA Name                     Population        Value         Value      SLAMS       Active in
                                                           2016-        2016-      Monitors   DC/TotalA,B
                                                           2018          2018

 Washington-Arlington-
 Alexandria, DC-VA-MD-WV                  6,251,240         9.0          20             2         4/9          3
A - Based on tables available at https://www.epa.gov/air-trends/air-quality-design-values.
B- Total number of monitors includes those located in other States.

PM2.5 Chemical Speciation Network (CSN): DOEE currently operates one PM2.5 CSN (MetOne
SASS) monitor at the McMillan site. The District implemented the carbon channel upgrade
(URG 3000N) for the CSN monitor in 2007. The CSN monitor at the McMillan site operates on
a 1-in-3 day sampling schedule to measure PM2.5 chemical species.

Particulate Matter (PM10)

DOEE operates one (1) continuous BAM PM10 FEM sampler at the McMillan site for reporting
PM10 mass measurements. In 2013, EPA approved co-designation of the McMillan NCore
station’s BAM PM10 FEM automated sampler for PM10 network to fulfill the PM10 NAAQS
monitoring requirements in the District. Subsequent to receiving EPA’s approval, DOEE
decommissioned the two (2) very old and aging filter-based manual PM10 FRM samplers
(primary and secondary monitors) in January 2014.

Additionally, DOEE operates a High-Vol PM10 sampler for NATTS toxic metals analysis.

Ozone (O3)

DOEE currently operates Thermo-49i series ozone analyzers at three (3) sites in the District:
River Terrace, McMillan Reservoir, and Takoma Recreation Center.

Ozone is measured by ultraviolet absorption photometry. Air is drawn continuously through a
sample cell where ultraviolet light passes through it. Ozone molecules in the air absorb part of
the ultraviolet light, reducing the intensity of the light reaching a light sensor. The light is
converted into an electric signal related to the concentration of ozone in the sample cell.

Ozone season begins on March 1 and continues through October 31. DOEE already conducts
year-round ozone measurements and collects ozone data on an hourly basis, so no additional
changes are necessary.

DRAFT District of Columbia’s 2022 Ambient Air Monitoring Network Plan                                                  16
May 2021
Ozone monitoring requirements are determined by the MSA population and design value, as
specified in Table D-2 of 40 C.F.R. Part 58 Appendix D. Table 2-1 shows that the DOEE
monitoring network meets or exceeds the minimum requirements.
Table 2-7: Number of Ozone SLAMS Sites (based on Table D–2, Appendix D,4.1(a) to 40
C.F.R. Part 58, Ozone Minimum Monitoring Requirements)
Monitors Deployed by StateA
≥ 85% NAAQS
Total Monitors
Population
Required
MSA Name
DC MD VA WV
Washington-Arlington-Alexandria,
DC-VA-MD-WV 6,251,240 3 7 7 0 17 3
Total 3 7 7 0 17 3
A - Based on tables available at https://www.epa.gov/air-trends/air-quality-design-values.
All areas had their maximum site >= 85% Ozone NAAQS.
Within an O3 network, at least one O3 site for each MSA must be designed to record the
maximum concentration for that particular metropolitan area. More than one maximum
concentration site may be necessary in some areas. Since O3 requires appreciable formation time,
the mixing of reactants and products occurs over large volumes of air, and this reduces the
importance of monitoring small-scale spatial variability. The appropriate spatial scales for O3
sites are neighborhood, urban, and regional.
The prospective maximum concentration monitor site should be selected in a direction from the
city that is most likely to observe the highest O3 concentrations, more specifically, downwind
during periods of photochemical activity. For the Washington-Arlington-Alexandria, DC-MD-
VA-WV MSA, the ozone monitor at the Takoma Recreation Center site is assigned this
designation for the District portion of the MSA.
Carbon Monoxide/Trace-CO
CO is measured by infrared absorption photometry. Air is drawn continuously through a sample
cell where infrared light passes through it. CO molecules in the air absorb part of the infrared
light, reducing the intensity of the light reaching a light sensor. The light is converted into an
electric signal related to the CO concentration in the sample cell. The CO trace analyzer is
designed to measure background concentrations of CO with a lower detection limit less than 4
ppb and uses a high performance modified vacuum pump. CO concentrations are highest along
heavily traveled roadways and decreases significantly with distance from traffic. Therefore, CO
monitors are usually located close to roadways or in urban areas.
One CO monitor is required to be collocated with a near-road NO2 monitor. EPA revised the
minimum monitoring requirements for CO on August 12, 2011. Since one (1) CO monitor is
collocated with a near-road NO2 monitor as required, DOEE proposed to discontinue two CO
monitors (one at the River Terrace station and one at the Verizon station) at the end of 2016 in
DRAFT District of Columbia’s 2022 Ambient Air Monitoring Network Plan 17
May 2021our 2017 network plan. DOEE’s 2017 Annual Network Plan was approved by EPA on November 10, 2016. In January 2011, DOEE deployed an Ecotech EC9830T trace-CO analyzer at the McMillan Reservoir NCore station and in April 2015 deployed an API T300U trace CO analyzer at the Anacostia Freeway Near-Road station. DOEE will continue maintaining two remaining CO monitors: one at the NCore station and one at the near-road station. Nitrogen Dioxide (NO2) NO2 is measured indirectly. First, nitrogen oxide (NO) is measured using the chemiluminescence reaction of NO with O3. Air is drawn into a reaction chamber where it is mixed with a high concentration of ozone from an internal ozone generator. Any NO in the air reacts with ozone to produce NO2. Light emitted from this reaction is detected with a photomultiplier tube and converted to an electrical signal proportional to the NO concentration. Next, NOx is measured by passing the air through a converter where any NO2 in the air is reduced to NO before the air is passed to the reaction chamber. By alternately passing the air directly to the reaction chamber and through the converter before the reaction chamber, the analyzer alternately measures NO and NOx. The NO2 concentration is equal to the difference between NOx and NO. True NO2 is a direct measurement of NO2, which uses cavity-attenuated phase shift (CAPS) NO2 monitors to provide a direct absorption measurement of nitrogen dioxide. Unlike standard chemiluminescence-based monitors, these instruments require no conversion of NO2 to another species and thus are not sensitive to other nitrogen-containing species. The CAPS NO2 monitor operates as an optical absorption spectrometer that yields both reliable and accurate measurements of ambient nitrogen dioxide down to sub ppb concentrations, with lower noise levels than chemiluminescence-based monitors. NOx emissions are produced during high-temperature burning of fuels. Sources of NOx include motor vehicles and stationary sources such as power plants and industrial boilers. DOEE currently operates NO2 monitors at four (4) sites collocated with ozone measurement sensors. The NO-NO2-NOx Thermo-42i analyzers are operated year-round and are located at the River Terrace, McMillan, Near-road, and Takoma Recreation Center sites. The true-NO2 API model T500U-CAPS sampler has been deployed since January 2020 at McMillan. RA-40: The monitoring regulations for the 2010 NO2 NAAQS say that the EPA Regional Administrator can require a minimum of forty (40) monitors to be sited inside or outside of CBSAs nationwide in locations with “susceptible and vulnerable” populations. The community- level NO2 network monitors are called “RA-40” designated monitors. DOEE and EPA assigned a RA-40 designation to the NO2 monitor at the River Terrace station. Total Reactive Nitrogen Oxides (NOy): In January 2011, DOEE installed an Ecotech EC9843 model NOy analyzer at the McMillan NCore station. DOEE replaced an EcoTech EC9843 analyzer with Teledyne API model T200U in July 2017. These samplers are a DRAFT District of Columbia’s 2022 Ambient Air Monitoring Network Plan 18 May 2021
chemiluminesence-based analyzers that uses a high-performance NOy converter to measure trace
levels of NOy and NO.

Near-Road NO2 Network: In January 2015, DOEE established one (1) NO2 near-road
monitoring station collocated with trace CO measurement along the Anacostia Freeway (Site:
11-001-0051). Valid data collection began in June 2015. Data is uploaded to EPA’s AQS.

Sulfur Dioxide/Trace-SO2

SO2 is measured with a fluorescence analyzer. Air is drawn through a sample cell, where it is
subjected to high intensity ultraviolet light. This causes the SO2 molecules in the air to fluoresce
and release light. The fluorescence is detected with a photo multiplier tube and converted to an
electrical signal proportional to the SO2 concentration. The SO2 trace analyzer is a high
performance UV fluorescence analyzer designed to measure background concentration of SO2
with a lower detection limit less than 200 parts per trillion.

DOEE operates one (1) EcoTech EC9850T trace-SO2 analyzer at the McMillan NCore station.

The District proposed to decommission the Thermo 43i continuous SO2 monitor at the River
Terrace station in the 2020 Network Plan. The monitor was redundant since the network already
had the required number of SO2 monitors. Once EPA approved the 2020 Network Plan on
October 28, 2019, DOEE decommissioned the SO2 monitor at River Terrace.

Air Toxics

DOEE operates one (1) NATTS station at the McMillan site. Air toxics samples are collected
for 24 hours with a model 910A Environmental Systems Inc. canister sampler on a 1-in-6 day
schedule.

NATTS monitors at the McMillan site capture PAH (Tisch PUF+ analyzer), toxic heavy metals
(EcoTech 3000 PM10 High-Vol), and VOCs and carbonyls (Model 2200-22 Atmospheric
Technology Inc. ATEC). The sampled canisters are returned to the laboratory for analysis on an
Entech/Agilent gas chromatograph (GC) mass spectrometer system. The District’s NATTS site
also includes an Aethalometer (Magee Scientific) for continuous sampling of black carbon
(OC/EC).

PAMS Ozone Precursors

DOEE operates one (1) PAMS Type 2 station at the McMillan site. The parameters measured
are O3, NO, NOx, NO2, speciated VOCs, carbonyls and surface meteorology.

During the peak ozone season (June to August), 24-hour canister air samples are collected on a
1-in-6 day sampling schedule with a ATEC Model 2200-22 sampler. The canisters are returned
to the laboratory for analysis on an EnTech/Agilent GC/FID system for speciated VOCs. During
core ozone season, hourly measurements for a set of 56 target hydrocarbons are made on-site
DRAFT District of Columbia’s 2022 Ambient Air Monitoring Network Plan                             19
May 2021
using a Markes/Agilent VOC Air Analyzer with dual flame ionization detector (Markes Unity-xr
with CIA Advantage ozone precursor sampler and Agilent 7890B PAMS Gas Chromatograph
sampling system). The measurement method for carbonyls is based on EPA’s Compendium
Method TO-11A, which incorporates the use of sorbent cartridges coated with 2,4-
dinitrophenylhydrazine and ATEC model 8000-3 for sample collection. The analyses are
performed with high performance liquid chromatography.

DOEE also operates continuous O3 and NOx analyzers complemented with surface
meteorological measurements at the McMillan PAMS site. In 2011, DOEE deployed Vaisala
WXT 520 meteorological monitoring sensors on a new 10-meter tower at the McMillan
PAMS/NCore site. DOEE has replaced the meteorological sensor with the Vaisala HMP155
temperature and humidity probe, the Vaisala WMT702 wind speed and direction sonic
anemometer, the Vaisala PTB110 pressure sensor, the Met One 385 tipping bucket rain gauge,
the Kipp and Zonen CMP6 solar radiation pyranometer, the Kipp and Zonen SUV5 ultraviolet
radiation radiometer, and the Vaisala CL51 mixing layer height ceilometer.

Lead (Pb)

DOEE discontinued Pb sampling at the end of 2016, under the provisions of 40 C.F.R.
In January 2012, DOEE began operating a TSP-Pb monitor at its McMillan NCore site on a 1-in-
6 day sampling schedule. Data collected for four years were measuring concentrations at about
4% of the NAAQS.

DRAFT District of Columbia’s 2022 Ambient Air Monitoring Network Plan                        20
May 2021
3.0 District of Columbia’s Air Monitoring Stations
DOEE currently maintains a network of five (5) ambient air monitoring stations: River Terrace,
McMillan, Takoma Recreation Center, Anacostia Freeway near-road and King Greenleaf
Recreation Center station. The following sections provide additional information. Maps for the
individual sites are shown in Figures 3-1 to 3-6.

3.1       River Terrace Station (11-001-0041)

The River Terrace monitoring station has been in operation since 1993. The site consists of
measurement analyzers for O3, NOx, and PM2.5.

Starting calendar year 2017, the PM2.5 FRM monitor was replaced with a FEM monitor and the
CO monitor was discontinued. DOEE discontinued the SO2 monitor in 2019 due to redundancy
with the trace SO2 monitor for NCore at the McMillan Reservoir monitoring site (11-001-0043).

Figure 3-1: River Terrace Site Locator Maps

DRAFT District of Columbia’s 2022 Ambient Air Monitoring Network Plan                         21
May 2021
3.2       McMillan Station (11-001-0043)

The McMillan monitoring station is the most comprehensive ambient air station in the District.
It was launched in 1994 as a PAMS Type 2 station. Measurements for 56 target hydrocarbons
are conducted with a PAMS automatic GC ambient air sampling system. The station was
expanded in 2000 and 2001 with the addition of PM2.5 FRM, PM2.5 CSN monitoring, PM2.5
continuous, NATTS and BC/EC sensors. Surface meteorological measurements are carried out
at the McMillan Reservoir site as part of PAMS monitoring.

Also, the McMillan site was the first NATTS site in EPA Region III. In January 2011, the
McMillan site has expanded into an NCore network monitoring station. A TSP-Pb monitor was
added in January 2012 and terminated at the end of 2016 after monitoring requirements were
revised. Additionally, as part of the EPA Office of Air Quality Planning and Standards (OAQPS)
national pilot study, a Sunset Model 4 Semi-Continuous OC/EC monitor was deployed at
McMillan station from January 2012 to August 2016. A Vaisala CL51 ceilometer was deployed
in January 2020 and a Pandora spectrometer was deployed in August 2020.

Starting calendar year 2017, the PM2.5 FRM monitor was replaced with a FEM monitor.

Figure 3-2: McMillan Reservoir Site Locator Maps

DRAFT District of Columbia’s 2022 Ambient Air Monitoring Network Plan                        22
May 2021
3.3       Takoma Recreation Center Station (11-001-0050)

The Takoma Recreation Center monitoring station has been in operation since January 2013.
The station consists of measurement analyzers for O3 and NOx. This station was established as a
replacement site for Takoma School station (11-001-0025), where operations ceased in 2011
because of a fire incident.

Figure 3-3: Takoma Recreation Center Site Locator Maps

DRAFT District of Columbia’s 2022 Ambient Air Monitoring Network Plan                        23
May 2021
You can also read