Digital Payments and Consumption: Evidence from the 2016 Demonetization in India - Sumit Agarwal*, Pulak Ghosh#, Jing Li , and Tianyue Ruan* - abfer
←
→
Page content transcription
If your browser does not render page correctly, please read the page content below
Digital Payments and Consumption:
Evidence from the 2016 Demonetization in India

 Sumit Agarwal*, Pulak Ghosh#, Jing Li§, and Tianyue Ruan*

 *NUS
 #IIM Bangalore
 §SMU

 Capital Market Development: China and Asia
 July 1st, 2021
Popularity of digital payments

 Digital payments can help improve
 financial inclusion (Demirguc-Kunt et
 al., 2015)
 • Improve efficiency of making
 payments
 • Enhance security
 • Increase transparency
 • Provide first entry point into formal
 financial system
 Cash puts a floor on nominal interest
 rate and facilitates illegal activity and
 tax evasion (Rogoff, 2017). Digital
 payments can overcome these
 costs.

 2
Governments around the world promote digital payments

Research question: Do digital payments affect consumption?

 • Why would digital payments affect consumption?
 • Transaction costs
 • Salience

 • Empirical challenges for studying this question in observational data
 • Consumers do not have equal access to digital payments (Borzekowski and
 Kiser, 2008).
 • Merchants are not uniformly willing to accept digital payments.
 • Even in a setting where merchants have equal acceptance of digital
 payments and consumers have equal access, consumers can often choose
 to pay a small receipt with cash and switch to digital payments for a larger
 receipt.

 4

Research question: Do digital payments affect consumption?

 • Experimental evidence of debit cards (Runnemark, Hedman, and Xiao, 2015) /
 credit cards (Feinberg, 1986; Prelec and Simester, 2001) increase willingness-
 to-pay: limited generalizability and quantitative relevance

 • How do we address these challenges?
 • Unique and unexpected Demonetization in India exogenously altered
 choice of payment mode
 • We use a large administrative data set to track consumption behaviors of
 individuals before and after the Demonetization to identify the consumption
 response

 5

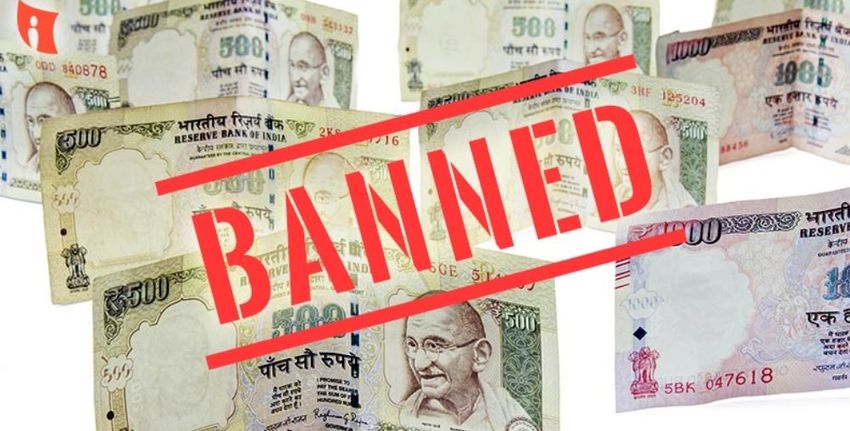
November 2016 Demonetization in India

 • On 8th November 2016, the Indian
 Prime Minister Narendra Modi
 announced a demonetization
 scheme in an unscheduled live
 television address: notes of INR
 500 and INR 1,000 would be
 invalid post midnight.
 • Stated purposes: to flush out black
 money and to combat tax evasion,
 counterfeiting, and terrorism.
 • New notes were available only
 months later.

 6
November 2016 Demonetization in India

 • About 87% of the value of all transactions in 2012 was in cash and it is
 estimated that the Reserve Bank and commercial banks in India spent
 equivalently about 3 billion USD in current operation costs annually (Mazzotta
 et al. 2014).
 • Currency in circulation accounts for almost 18% of its GDP (3.5% to 8% in
 USA, UK)
 • The INR 500 and INR 1,000 notes, at the time of scrapping, were the most
 circulated currency in India, accounting for as much as 86% of paper money.
Comparisons with historical demonetization episodes

 • Several other countries have embraced demonetization in the past, including
 United Kingdom in 1971, Ghana in 1982, Nigeria in 1984, Australia in 1996,
 Zimbabwe in 2015, and Pakistan in 2016.
 • Demonetization has been implemented in India twice in prior history.
 • In 1946, the currency notes of INR 1,000 and INR 10,000 were removed
 from circulation.
 • In 1978, the currency notes of INR 1,000, INR 5,000 and INR 10,000 were
 removed from circulation.
 • What is special about the Demonetization in November 2016?
 • Larger scope
 • Suddenness of the announcement
 • Prolonged unavailability of new notes

 8
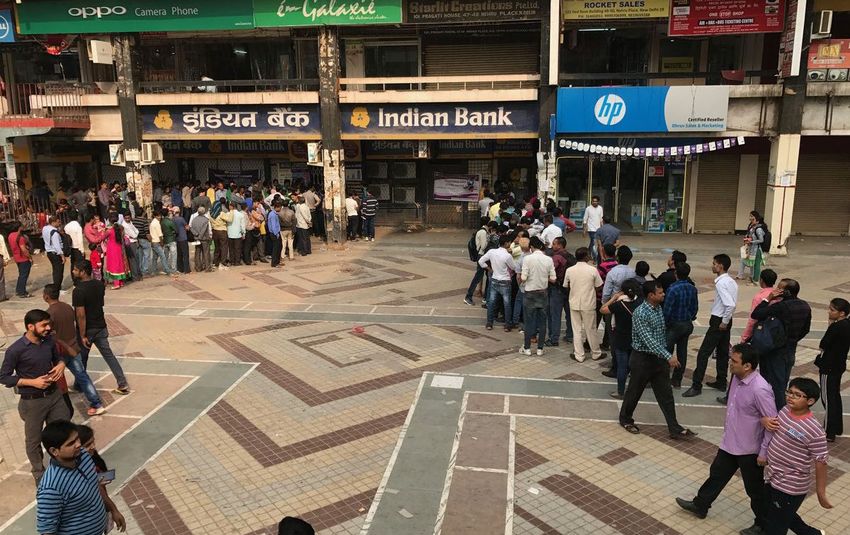
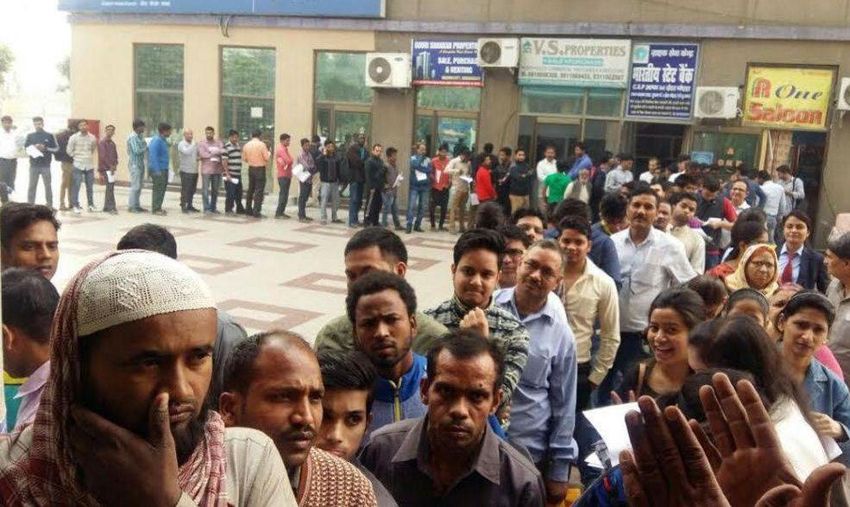
Sudden dry-up in cash due to Demonetization
 “The implementation process faced technical disruptions, leading to severe cash shortages,
 and the overall poor preparation of the policy led the country into chaos for more than three
 months.”
 -- The Conversation

 9
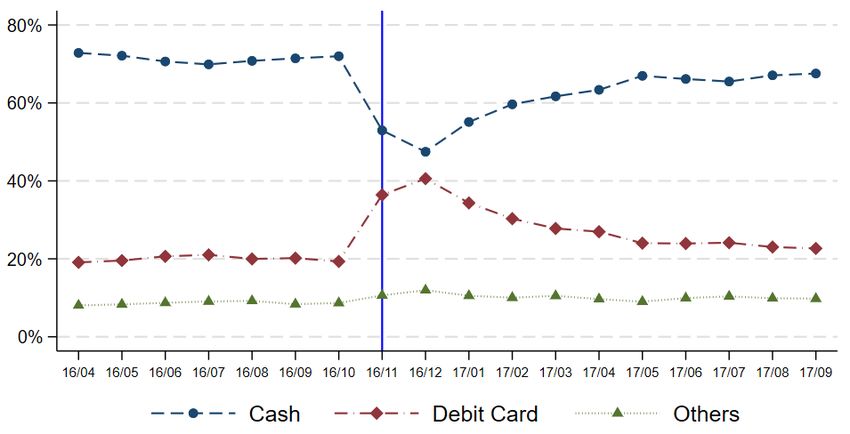
Demonetization and payment mode

 10
Data

 • Customer receipt-level administrative transaction data from a large
 supermarket chain store in India
 • Fourth largest supermarket chain
 • Third largest private sector business group
 • 530 stores across the country (171 in our data)
 • More than INR 35 billion (~USD 525 million) in revenue
 • Sample period: April 2016 to September 2017
 • Information available:
 • Receipt amount
 • Payment mode
 • Details of items purchased

 11
Summary statistics

 Mean Std. Dev. Median
 Cash payment fraction (2016:04--2016:10) 0.72 0.39 1
 Cash payment fraction (2016:11--2017:09) 0.60 0.40 0.71
 Debit cards fraction (2016:04--2016:10) 0.22 0.35 0
 Debit cards fraction (2016:11--2017:09) 0.32 0.37 0.12
 Mobile payment fraction (2016:04--2016:10) 0.0021 0.036 0
 Mobile payment fraction (2016:11--2017:09) 0.0045 0.048 0
 Credit cards fraction (2016:04--2016:10) 0.0069 0.061 0
 Credit cards fraction (2016:11--2017:09) 0.030 0.13 0
 Monthly supermarket spending (2016:04--2016:10) 830.7 12515.7 400
 Number of individuals 924,753

 12
Empirical challenges for digital payments consumption • Omitted variable from the consumer side: Socio-economic status affects consumers’ access to digital payments as well as spending (Borzekowski and Kiser, 2008). • Omitted variable from the merchant side: Some merchants may not accept digital payments. This supermarket chain accepts digital payments in all its stores. • Reverse causality: Even in a setting where merchants have equal acceptance of digital payments and consumers have equal access, consumers can often choose to pay a small receipt with cash and switch to digital payments for a larger receipt. 13
Identification strategy

 • The Demonetization drained the currency in circulation and affected individuals’
 ability to use cash in transactions, therefore forcing cash-dependent individuals
 to switch to digital payments

 • Identification relies on the variation in dependence on cash – the exposure
 to the sudden dry-up of cash due to the Demonetization

 • Difference-in-differences (DiD) framework: compare changes in spending
 patterns across individuals with varying degree of prior cash dependence.

 14
Difference-in-differences (DiD) specification

 , = + , + × + ,

 • yi,t: Consumption behavior (spending amount, payment pattern)
 • Prior Cash Dependence: fraction of cash usage from April to October 2016,
 continuous in [0,1]
 • Post = 1 for November 2016 to September 2017, 0 for April to October 2016
 • measures the impact of the forced switch to digital payments
 • Consumer fixed effects: remove unobserved time-invariant individual
 heterogeneity
 • District-specific time fixed effects: remove common trends and other unobserved
 time-varying heterogeneity, e.g., district-level differential availability of new bills
 (Chodorow-Reich et al., 2019)
 • Standard errors: robust, clustered at the consumer level
 15
DiD illustration: Cash % in monthly spending decreases

 16
DiD illustration: Previous cash users increase spending

 17
Forced switch to digital payments & effect on spending

 Cash usage Spending (level) Spending (log)
 PriorCashDependence × Post -0.338*** 239.322*** 0.307***
 [-39.20] [3.11] [12.61]
 Individual FEs Yes Yes Yes
 District × Time FEs Yes Yes Yes
 R-squared 0.622 0.436 0.586
 Observations 6,561,580 6,561,580 6,561,580

 Economic magnitude
 • 10 pp increase in prior cash dependence ~ 3.38 pp increase in digital payments
 adoption, 23.93 rupees increase in monthly spending, 3% increase in monthly
 spending
 • Inter-quartile range of prior cash dependence is 50% ~ 119.65 rupees increase or
 14% increase in monthly spending
 18
Heterogeneous forced switch to digital payments

 Mobile payment
 Cash usage Debit card usage Credit card usage
 usage
PriorCashDependence × Post -0.338*** 0.296*** 0.001** -0.019***
 [-39.20] [42.01] [2.27] [-3.30]
Individual FEs Yes Yes Yes Yes
District × Time FEs Yes Yes Yes Yes
R-squared 0.622 0.566 0.350 0.403
Observations 6,561,580 6,561,580 6,561,580 6,561,580

 19
Dynamic effects of digital payments on spending

 , = + , + � × + ,
 20
Results in the sample excluding Nov 2016 to Jan 2017

 Excluding full cash users Excluding Nov 2016 to Jan 2017
 Cash Spending Log Cash Spending Log
 usage (level) (spending) usage (level) (spending)
PriorCashDependence × Post -0.413*** 375.665 0.177*** -0.330*** 289.047*** 0.345***
 [-36.67] [1.38] [9.23] [-43.20] [3.11] [17.55]
Individual FEs Yes Yes Yes Yes Yes Yes
District × Time FEs Yes Yes Yes Yes Yes Yes
R-squared 0.518 0.436 0.539 0.636 0.447 0.596
Observations 3,720,539 3,720,539 3,720,539 5,427,290 5,427,290 5,427,290

 21
Treated individuals increase non-food & durable spending

 Differentiate food & non-food spending Differentiate durable & durable spending
 Non-food Durable
 Food Non-food Durable Non-durable
 spending spending
 spending > 0 spending > 0 spending > 0 spending > 0
 share share
PriorCashDependence × Post 0.006*** 0.063*** 0.018*** 0.013*** 0.000 0.001***
 [4.65] [16.85] [9.12] [8.59] [1.54] [5.76]
Individual FEs Yes Yes Yes Yes Yes Yes
District × Time FEs Yes Yes Yes Yes Yes Yes
R-squared 0.345 0.443 0.437 0.243 0.251 0.277
Observations 6,561,580 6,561,580 6,561,580 6,561,580 6,561,580 6,561,580

 22
Treated individuals increase shopping variety

 Broad
 Product Category
 category Shop variety No. of trips
 variety variety
 variety
PriorCashDependence × Post 2.002*** 0.212*** 0.975*** 0.002* 0.027
 [7.11] [14.39] [11.99] [2.07] [0.85]
Individual FEs Yes Yes Yes Yes Yes
District × Time FEs Yes Yes Yes Yes Yes
R-squared 0.650 0.531 0.634 0.523 0.594
Observations 6,561,580 6,561,580 6,561,580 6,561,580 6,561,580

 23
Spending by category analysis: Examples of categories
Item Category
more. Value/Daily Chana Dal 1 Kg Cereals - Pulses and Flours
more. Value/Daily Sugar 1 Kg Salt and Sugar
more. Veg Sandwich 150 Gm Starters
more. White Bread 400 Gm Bread
more. White Nappies Without Plastic PO12 White Infant Underwear & Night Wear
more. for you Mustard Big 100 Gm Spices and Dehydrated Foods
more. freshness Baby Corn Peeled Processed Products
more. freshness Basil Vegetables
more. freshness Rambutan Pkd Fruits
more. freshness Sprout Chana White Vegetables
parle hide & seek mint 93.75 Gm Biscuit
pro nature 100% organic urad white 500 gm Organics
sai shantD- Ring binder A4 Office Stationery and Corres
sh gold cloth clip Clothes Upkeep
usha Halogen Oven INFINITICOOK 3514i 1300W . nos
 Cooking Appliances
Box
 24
Treated consumers buy more expensive items within granular
product categories

 Amount Quantity Unit Price
PriorCashDependence × Post 20.372 0.367 0.829***
 [1.25] [1.16] [8.28]
Individual × Category FEs Yes Yes Yes
District × Category × Time FEs Yes Yes Yes
R-squared 0.399 0.385 0.771
Observations 54,603,502 54,603,502 54,603,502

 25
Heterogeneous spending response

 26
Alternative explanations

 1. Income shock
 2. Credit supply
 3. Supplier’s pricing response
 4. Moving purchases to the formal market

 27
Income shock (concern 1) goes against us finding result

 • First, overall income probably dropped in 2016Q4.
 • A more subtle argument: re-allocation of relative income
 • We proxy for black market income with the behavior of paying large receipts
 with cash prior to the Demonetization
 Did not use cash for large bills pre- Used cash for large bills pre-
 Demonetization Demonetization
 Cash Spending Spending Cash Spending Spending
 usage (level) (log) usage (level) (log)
PriorCashDependence × Post -0.356*** 240.412*** 0.537*** -0.240*** 243.569** 0.015
 [-46.44] [9.90] [18.57] [-21.54] [2.89] [0.55]
Individual FEs Yes Yes Yes Yes Yes Yes
District × Time FEs Yes Yes Yes Yes Yes Yes
R-squared 0.659 0.593 0.566 0.546 0.437 0.486
Observations 3,950,372 3,950,372 3,950,372 2,611,208 2,611,208 2,611,208
 28
Credit supply (concern 2) does not fully explain findings

 • Uptick of digital payments concentrated on debit card, credit card usage
 declined slightly
 • A credit supply shift, if exists, should affect existing credit card holders more
 • We analyze three sub-samples: existing users, new users, and non-users
 Outcome variable: Spending (log)
 Full Existing users New users Non-users
PriorCashDependence × Post 0.307*** 0.241*** 0.260*** 0.448*** 0.311***
 [12.61] [8.71] [8.75] [18.06] [12.44]
PriorCreditDependence × Post 0.074**
 [2.37]
Individual FEs Yes Yes Yes Yes Yes
District × Time FEs Yes Yes Yes Yes Yes
R-squared 0.586 0.520 0.520 0.505 0.587
Observations 6,561,580 240,191 240,191 551,031 5,770,358
 29
Supplier’s pricing response (concern 3) is modest
 Overall price level in this supermarket chain (controlling for items and stores)

 , , = + + � + , , 30
No differential pricing by exposure to prior-cash-dependent
consumers
 Price level of high exposure products relative to low exposure products

 , , = + + � + � × + , ,
 31
Moving purchases to the formal market (concern 4)

 • Newly arrived consumers do not contribute to our estimation.
 • Consumers who were likely to go to informal markets for grocery shopping
 experienced a lower spending response.
 Pre-Demonetization food spending Pre-Demonetization food spending
 share is below median (88%) share is above median (88%)
 Food Food
 Cash Spending Cash Spending
 spending spending
 usage (log) usage (log)
 share share
PriorCashDependence × Post -0.354*** 0.207*** 0.043*** -0.332*** 0.349*** -0.019***
 [-35.58] [10.08] [13.36] [-39.80] [13.46] [-19.43]
Individual FEs Yes Yes Yes Yes Yes Yes
District × Time FEs Yes Yes Yes Yes Yes Yes
R-squared 0.608 0.564 0.366 0.629 0.562 0.322
Observations 3,635,392 3,635,392 3,635,392 2,926,188 2,926,188 2,926,188
 32
Summary: How do we address these challenges

 1. Income shock: The difficulties imposed on black market activities implies that
 a re-allocation of relative income exists, if exists, goes against us finding
 result. We find potential black market earners experienced a lower spending
 response.
 2. Credit supply: Analysis on existing credit card users shows some evidence
 for credit supply shift but such channel does not explain our main results –
 uptick of digital payments concentrated on debit card and credit card usage
 experienced a small decline; most consumers still did not have a credit card
 post Demonetization.
 3. Supplier’s pricing response: The overall price level exhibits a smooth low
 inflation throughout the sample period. In the cross section, pricing of
 products highly exposed to prior-cash-dependent consumers was not
 elevated.
 4. Moving purchases to the formal market: Newly arrived consumers do not
 contribute to our estimation. Consumers who were likely to go to informal
 markets for grocery shopping experienced a lower spending response.
 33
Mechanisms

 • Physical transaction costs
 • Costs associated with storing, transporting, and counting paper bills and
 coins
 • Time costs of traveling to a bank branch or an ATM to withdraw cash
 (Bachas et al., 2018)
 • Risk of cash theft (Economides and Jeziorski, 2017; Rogoff, 2014).
 • Psychological transaction costs/salience
 • Decision point at purchase
 • Pain of paying or payment transparency (Prelec and Loewenstein, 1998;
 Zellermayer, 1996; Soman, 2003; Raghubir and Srivastava, 2008)

 34
Analyzing online grocery spending to tease out mechanism • Cash on delivery for online purchases involves no exchange of money between hands at the time of purchase decision lower psychological transaction costs/salience • Physical transaction costs apply equally to online and offline shopping. • Differences in estimates reflect the effect of the salience: Supermarket spending Online grocery spending Cash usage Spending (log) Cash usage Spending (log) PriorCashDependence × Post -0.338*** 0.307*** -0.522∗∗∗ 0.041∗∗∗ [-39.20] [12.61] [-33.97] [3.30] Individual FEs Yes Yes Yes Yes District × Time FEs Yes Yes Yes Yes R-squared 0.622 0.586 0.651 0.559 Observations 6,561,580 6,561,580 209,391 209,391 35
Conclusion

 • Focus: Do digital payments affect consumption?

 • Findings:
 • Consumers who are forced to switch to digital payments by the 2016 Indian
 Demonetization increase spending.
 • They buy higher unit price products and are less likely to use offers.
 • Alternative explanations such as income shock, credit supply, supplier’s
 pricing response, and moving to the formal market do not explain our
 results.
 • Psychological transaction costs/salience drive our resultss

 36
Additional slides
Slow comeback of cash

 Figure 1 of Chodorow-Reich et al. (2019)
Multi-group DiD heatmap: Cash usage decreases

 39
Multi-group DiD heatmap: Spending increases

 40
Economic Policy Uncertainty in India

 140

 120

 100

 80

 60

 40

 16/04 16/05 16/06 16/07 16/08 16/09 16/10 16/11 16/12 17/01 17/02 17/03 17/04 17/05 17/06 17/07 17/08 17/09

 41
You can also read


