Denver Gold Forum 2021 - Inspired people creating a premier global gold company - Evolution Mining
←
→
Page content transcription
If your browser does not render page correctly, please read the page content below
Denver Gold Forum 2021
Inspired people creating a premier global gold company
                                                         1
FORWARD LOOKING STATEMENT
These materials prepared by Evolution Mining Limited (or “the Company”) include forward looking statements. Often, but not always, forward looking statements
can generally be identified by the use of forward looking words such as “may”, “will”, “expect”, “intend”, “plan”, “estimate”, “anticipate”, “continue”, and “guidance”,
or other similar words and may include, without limitation, statements regarding plans, strategies and objectives of management, anticipated production or
construction commencement dates and expected costs or production outputs.

Forward looking statements inherently involve known and unknown risks, uncertainties and other factors that may cause the Company’s actual results,
performance and achievements to differ materially from any future results, performance or achievements. Relevant factors may include, but are not limited to,
changes in commodity prices, foreign exchange fluctuations and general economic conditions, increased costs and demand for production inputs, the speculative
nature of exploration and project development, including the risks of obtaining necessary licenses and permits and diminishing quantities or grades of reserves,
political and social risks, changes to the regulatory framework within which the Company operates or may in the future operate, environmental conditions including
extreme weather conditions, recruitment and retention of personnel, industrial relations issues and litigation.

Forward looking statements are based on the Company and its management’s good faith assumptions relating to the financial, market, regulatory and other
relevant environments that will exist and affect the Company’s business and operations in the future. The Company does not give any assurance that the
assumptions on which forward looking statements are based will prove to be correct, or that the Company’s business or operations will not be affected in any
material manner by these or other factors not foreseen or foreseeable by the Company or management or beyond the Company’s control.

Although the Company attempts and has attempted to identify factors that would cause actual actions, events or results to differ materially from those disclosed in
forward looking statements, there may be other factors that could cause actual results, performance, achievements or events not to be as anticipated, estimated or
intended, and many events are beyond the reasonable control of the Company. Accordingly, readers are cautioned not to place undue reliance on forward looking
statements. Forward looking statements in these materials speak only at the date of issue. Subject to any continuing obligations under applicable law or any
relevant stock exchange listing rules, in providing this information the Company does not undertake any obligation to publicly update or revise any of the forward
looking statements or to advise of any change in events, conditions or circumstances on which any such statement is based.

This presentation has been approved for release by Evolution’s Board of Directors.

AUD:USD exchange rate assumption of 0.75 used throughout this presentation unless stated otherwise.

                                                                                                                                                                           2
PRODUCTION TARGET &
             FORECAST FINANCIALS
                 Group Three-Year
                                                                     FY22                               FY23                      FY24
                     Outlook

              Production (oz)                                 700,000 – 760,000                 815,000 – 875,000           940,000 – 1,010,000

              AISC (A$/oz)1                                      1,220 – 1,280                     1,125 – 1,185               1,170 – 1,230

              Sustaining Capex (A$/M)                              125 – 155                          120 – 160                 125 – 165

              Major Capital (A$M)                                  440 – 510                          490 – 560                 290 – 360

            Cautionary statement concerning the proportion of Exploration Targets
            Of Evolution’s Group Production Outlook, 3% is comprised of Exploration Targets. The potential quantity and
            grade of this exploration target is conceptual in nature and there has been insufficient exploration to determine
            a Mineral Resource and there is no certainty that further exploration work will result in the determination of
            Mineral Resources or that production target itself will be realised.
            For information on Production Targets and Forecast Financials, refer to the ASX release entitled “Acquisition to
            elevate Mungari to a cornerstone asset and A$400 million equity raising” released to the ASX on 22 July 2021
            and available to view at www.evolutionmining.com.au. The Company confirms that all material assumptions
            underpinning the Production Target and Forecast Financial information derived from the Production Target in
            the 22 July 2021 release continue to apply and have not materially changed.
(1)   [x]

            (1) AISC is based on Gold price of A$2,200/oz (royalties) and Copper price of A$11,000/t (By-product credits)
                                                                                                                                               3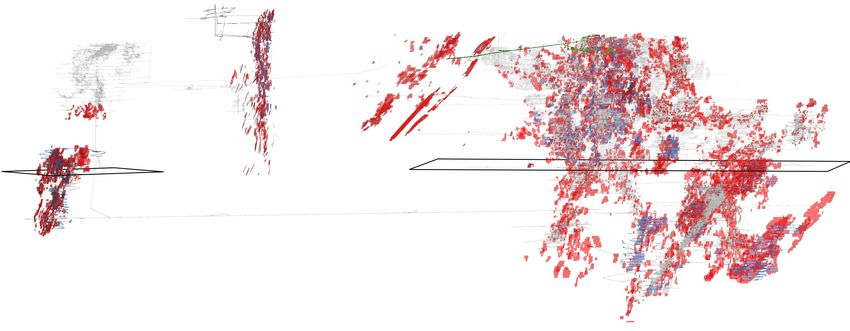
EVOLUTION SNAPSHOT                                                                                                                                        Production Outlook (koz)
                                                                                                                                                                                                  1,010
                                                                                                                                                                           875
MARKET CAPITALISATION                                 1                     US$5.3B
                                                                                                                                                   760
NET DEBT 2                                                                  US$345M                                                                                                                 940
                                                                                                                                                                            815
GOLD MINERAL RESOURCES 3                                                    26.4Moz                                                                700
GOLD ORE RESERVES 3                                                         9.9Moz
RESERVE PRICE ASSUMPTION                                                    US$1,090/oz                                                            FY22                    FY23                     FY24

FY22 PRODUCTION GUIDANCE                                                    700 – 760koz                                                                    AISC Outlook (US$/oz)
                                                                                                                                                  960
                                                                                                                                                                                                    925
FY22 AISC GUIDANCE                                                          US$915 – 960/oz                                    1000
                                                                                                                                                                           890
NUMBER OF OPERATING ASSETS                                                  6
                                                                                                                                 100              915
PORTFOLIO MINE LIFE 4                                                       13+ years                                                                                                               880
                                                                                                                                                                           845
                                                                            Van Eck                                                10
                                                                            Australian Super
MAJOR SHAREHOLDERS
                                                                            BlackRock
                                                                                                                                    1
                                                                            Fidelity                                                             FY22                      FY23                     FY24
     1.   Based on share price of A$3.85 per share on 8 September 2021                                                    Three-year forecast financials to be read in conjunction with information provided on slide 3
     2.   As at 30 June 2021                                                                                              of this presentation
     3.   Excludes Mineral Resources and Ore Reserves for Battle North (not estimated in accordance with JORC Code) and
          Kundana Assets. See the Appendix of this presentation for details on Mineral Resources and Ore Reserves.
     4.   Portfolio mine life refers to a production weighted average of asset mine lives excluding Kundana Assets
                                                                                                                          1. AISC is based on Gold price of A$2,200/oz (royalties) and Copper price of A$11,000/t
                                                                                                                          (By-product credits)                                                                      4
FOCUSED PORTFOLIO OF ASSETS IN TIER 1 JURISDICTIONS
Australia and Canada are
amongst the highest rated Red Lake
countries based on the Fraser
Institute and World Bank metrics
Ernest Henry Mt Carlton
Mt Rawdon
Mungari Cowal
Evolution vs. peers World Bank
investment attractiveness1
Legend
Operating assets
91 88 86 Low Jurisdictional Risk
77 73 71 67 65 60 59
40
29
Evolution offers a premium exposure to world-class assets
located solely in Tier 1 jurisdictions
1. Investment attractiveness based on The World Bank’s Ease of Doing Business Index of the asset location, weighted according to 22E production of each asset from Wood Mackenzie estimates.
Peers include Newcrest, Newmont, Barrick, Kinross, IAMGOLD, Agnico Eagle, Gold Fields, Eldorado, New Gold, Yamana and AngloGold 5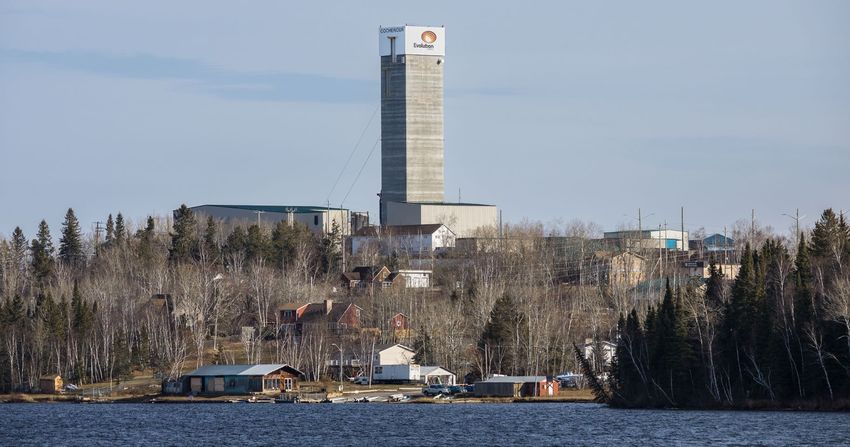
LEVERS TO NET ZERO
   FY21 Scope 1 & 2 emissions          POTENTIAL
                                       REDUCTION
                                     IMPACT SCALE
                                                                                                                                  Renewable energy2
                          32%                                                                                                     Fleet replacement (electrification/hydrogen)1
                                                                                                                                  Future fuels (eg low emissions diesel)1
                                                                                                                High

         68%

                                                                                                                                  Process improvement4
         Scope 1         Scope 2
                                                                                                                                  Energy efficiency1
                                                                                                                                  Alternate suppliers with a lower footprint3
FY21 Scope 1 & 2 emissions by site                                                                        Medium

                 Mt
               Carlton
                10%
          Mt
        Rawdon
         17%
                         Cowal
                                                                                                                                   Carbon offset / reforestation4
                          53%
         Mungari                                                                                                 Low
          15%
               Red
              Lake
                5%                   1.    Scope 1 emissions (direct GHG emissions from operations that are owned or controlled by the reporting company)
                                     2.    Scope 2 emissions (indirect emissions resulting from the generation of purchased energy consumed by a company)
                                     3.    Scope 3 emissions (all other indirect emissions (not included in Scope 2) that occur in the value chain of the reporting company)
                                     4.    Scope 1 & 2 emissions
                                     Disclaimer Statement
                                     The use by Evolution of any MSCI ESG Research LLC OR its affiliates (“MSCI”) data, and the use of MSCI logos, trademarks, service marks of index names herein do not constitute a sponsorship, endorsement,
                                     recommendation or promotion of Evolution by MSCI. MSCI services and data are the property of MSCI or its information providers and are provided ‘as-is’ and without warranty. MSCI names and logos are trademarks
                                     or service marks of MSCI.
                                                                                                                                                                                                                                                6
EXECUTING A VALUE ACCRETIVE GROWTH STRATEGY
                                           Accretive to shareholders
                Principles                 Improve portfolio quality
                                    Concentrated portfolio of 6 – 8 assets

            Cowal            Red Lake      Ernest Henry         Mungari

                                        Motivated seller

       Value                                Synergies
      Drivers                     Deep turnaround opportunity

                                        Geological upside
                                                                             7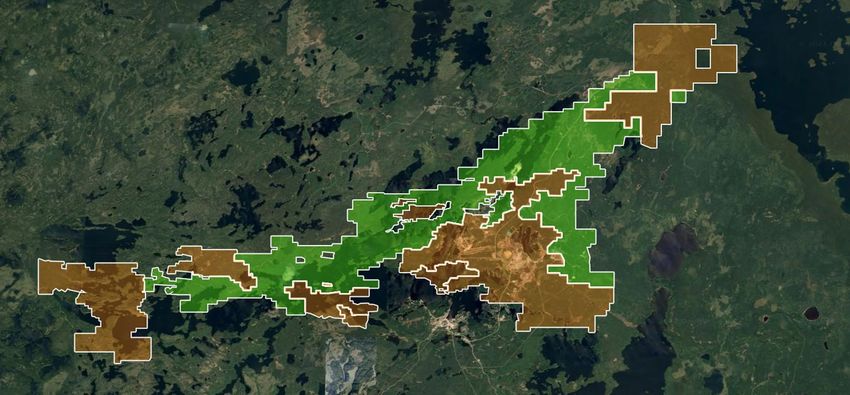
SUPERIOR RETURNS ON INVESTMENT
           Group EBITDA Margin
                    52%                        53%
         48%                     48%                        49%
  46%

                                                                   Cowal         Mungari2          Ernest Henry

 FY16    FY17      FY18         FY19          FY20         FY21

Date acquired                                                        July 2015     August 2015        November 2016
Total price (incl transaction costs)                                 US$567M        US$269M             US$675M

Net Cash Flow                                                        US$570M        US$220M              $US815M

Average annual return on investment1                                   17%            16%                  26%

                                                                                                              5
Remaining mine life today                                              17+            13+
                                                                                                 Extension studies underway

                 Red Lake acquired April 2020 – transformation into a high-margin, long-life asset underway

            1.   Average annual returns since acquisition
            2.   Excludes Kundana assets acquired in August 2021
                                                                                                                        8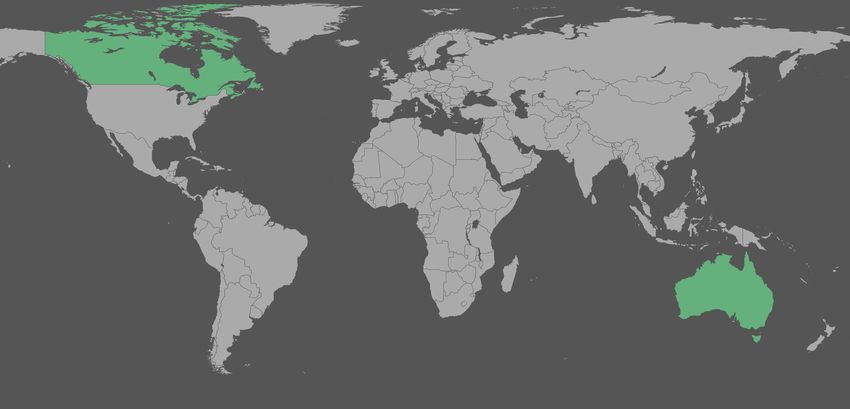
COWAL – A WORLD CLASS ASSET

Acquisition in July 2015

                                             July 2015                 June 2021
                                                                                                                                                                                 9.7
Ore Reserves                                   1.6Moz                   4.6Moz1                                                                                                     Mineral
                                                                                                                                                                         8.6
                                                                                                                                                                                 Resources
Mineral Resources                              3.4Moz                   9.7Moz1                                                                                  7.4                 (Moz)

Mine life2                                         2024                    2040                                                                6.1
                                                                                                                                5.0                                             4.6
Plant capacity                                7.2Mtpa                  ~9.0Mtpa
                                                                                                                                                             3.9
                                                                                                                                                                        3.6
                                                                                                                                                                                        Ore
Gold production                                                          1.4Moz                                 3.4             3.2          3.0                                   Reserves
                                                                                                                                                                                 4.6
                                                                                                                                                                 3.9
                                                                                                                                                                                      (Moz)
                                                                                                                                                                         3.6
Operating cash flow                                                     US$1.2B                                                 3.2            3.0
                                                                                                                1.6
                                                                                                                 1.6
Net cash flow3                                                         US$570M
                                                                                                  FY15          FY16          FY16           FY17          FY18        FY19    FY20    FY23+

         1.   Mineral Resources and Ore Reserves estimate at 31 December 2020. See the Appendix   2.   Seeking regulatory approval to extend mine life to 2040
              of this release for details on Mineral Resources and Ore Reserves                   3.   Post all capital and exploration                                                       9
COWAL – THE FUTURE
In the next three years
US$285M investment in Cowal Underground
First underground ore scheduled for H2 FY23
Production
Strong community and regulatory support for the project ramp-up to 350kozpa
Higher grade ore source underpins production growth
All-in Cost
expected to ~28%
decrease by
Mine Life 17+ years
10RED LAKE
In the next three years
Red Lake Transformation – a clear pathway to 350kozpa
Production
Mineral Resource of 11Moz1 with potential for further additions ramp-up to 200kozpa
Growth plans accelerated by Battle North acquisition
Investment now focused on mine development
All-in Cost
expected to ~26%
decrease by
Mine Life
(Years) 15+ years
In the next five years
Further
ramp-up goal
by FY26
350kozpa
1. Mineral Resources and Ore Reserves estimate at 31 December 2020. Excludes Battle North Ore Reserves and Mineral Resources which have not been estimated in accordance with JORC Code. See the
11
Appendix of this release for details on Mineral Resources and Ore ReservesRED LAKE DISTRICT CONSOLIDATED
Red Lake (incl JV) tenements
Battle North tenements acquired
Mill Locations Bateman mill
Campbell mill
Red Lake mill
N
10 km
Milling capacity of 1.5Mtpa with expansion opportunity to 2.0Mtpa
12RED LAKE – THE PATHWAY TO 350,000 OZ
Upper Campbell
McFinley1 HG Young MR – 4.4Moz @ 10.4g/t Au
MR – 1.4Moz @ 6.2g/t Au MR – 0.4Moz @ 5.4g/t Au
Upper Red Lake
MR – 1.2Moz @ 6.1g/t Au
Upper
Cochenour
1200m below surface
Lower 11Moz Mineral Resource
Cochenour + McFinley
+ Exploration potential
Cochenour Total
MR – 1.4Moz @ 5.6g/t Au
Existing Workings
Lower Campbell Lower Red Lake
MR – 1.1Moz @ 6.9g/t Au MR – 2.5Moz @ 5.9g/t Au
Resource
1 km
Reserve Plunge +03 Azimuth 033
1. NI43-101 Bateman Gold Project Feasibility Study Technical Report and available to view under Battle North Gold’s profile at www.sedar.com
Note: • Mineral Reserve estimate of 3.56Mt grading 5.54g/t for 635koz Au
McFinley deposit is projected onto this • Measured & Indicated Mineral Resource estimate (excluding Mineral Reserves) of 1.71Mt grading 7.09g/t for 390koz Au
schematic section and is not to scale. • Inferred Mineral Resource of 1.56Mt grading 6.83g/t for 343koz Au 13
• Mineral Resource shown in picture above is a combination of the Mineral Reserves and Mineral Resources referenced above.RED LAKE – THE PATHWAY TO 350,000 OZ
Upper Campbell
McFinley1 HG Young MR – 4.4Moz @ 10.4g/t Au
MR – 1.4Moz @ 6.2g/t Au MR – 0.4Moz @ 5.4g/t Au
Upper Red Lake
MR – 1.2Moz @ 6.1g/t Au
Upper
Cochenour
1200m below surface
Lower Stage one: 1 million tonnes
Cochenour Stage two: 2 million tonnes
Cochenour Total Stage three: The future
MR – 1.4Moz @ 5.6g/t Au
Existing Workings
Lower Campbell Lower Red Lake
MR – 1.1Moz @ 6.9g/t Au MR – 2.5Moz @ 5.9g/t Au
Resource
1 km
Reserve Plunge +03 Azimuth 033
1. NI43-101 Bateman Gold Project Feasibility Study Technical Report and available to view under Battle North Gold’s profile at www.sedar.com
Note: • Mineral Reserve estimate of 3.56Mt grading 5.54g/t for 635koz Au
McFinley deposit is projected onto this • Measured & Indicated Mineral Resource estimate (excluding Mineral Reserves) of 1.71Mt grading 7.09g/t for 390koz Au
schematic section and is not to scale. • Inferred Mineral Resource of 1.56Mt grading 6.83g/t for 343koz Au 14
• Mineral Resource shown in picture above is a combination of the Mineral Reserves and Mineral Resources referenced above.MUNGARI – ANOTHER DISTRICT CONSOLIDATED
Underground operating mines recently acquired Map of the Kundana Assets Legend
from Northern Star and Mungari Evolution
Kundana Assets
Located within 8km of Evolution’s low-cost
Current ore sources
Processing facilities
Mungari Mill2 Carnage
Development /
discovery
Higher production from a 4g/t gold ore source Carbine Tenements
Mine life extension from 9 to 13+ years with Kanowna
Belle Mill
addition of 2.4Moz of Mineral Resource and
0.6Moz of Ore Reserve4 Castle Millennium
Hill Raleigh
WKJV
Significant immediate cost synergies from shorter RHP3 Kalgoorlie
White Foil
ore haulage distances and lower processing costs Mungari Frog’s Leg
Mill
Further synergies likely to be realised as assets
are integrated
Coolgardie
Opportunity for resource extensions below current
resource boundaries
50km
1. For details on the transaction, see announcement entitled “Acquisition to Elevate Mungari to Cornerstone Asset” 0 10km Radius
released to the ASX on 22 July 2021 and available to view at www.evolutionmining.com
2. Refers to estimated haulage distance from the Kundana and EKJV deposits to the Mungari Mill
3. RHP – Rubicon, Hornet, Pegasus
4. Kundana Assets Mineral Resources and Ore Reserves are provided in the Appendix of this presentation and reported as at 31 March 2021. Those Mineral Resources and Ore Reserves have been prepared using a gold price assumption of A$2,250/oz
to estimate Mineral Resources and A$1,750/oz to estimate Ore Reserves
15ERNEST HENRY – A WORLD CLASS ASSET
Generated US$230M of net mine cash flow in FY21 Net cash flow
Ongoing resource drilling and advancing studies to extend ore body generated
below 1200mRL since US$815M
acquisition
Targeting a 3 – 5 year mine life extension from 2026
Mine life extension milestones
Below Concept study
1,200mRL completed
Advancing
to Pre- H1 FY22
Feasibility
16CONCENTRATED HIGH QUALITY PORTFOLIO
Four long-life, high-margin assets
2,500
Production
Base2
Ernest Henry
2,000 100koz
LOM AISC Margin (US$/oz)1
1,500 Cowal
Red Lake
Mungari
1,000
Mt Rawdon
Mt Carlton
500
-
- 2 4 6 8 10 12 14 16 18 20
Mine Life3
1. LOM AISC Margin based on Evolution’s current life of mine plan. AISC margin assumes the spot gold price of US$1,800/oz on 8 September 2021
2. Production base refers to FY21 actuals for Ernest Henry, Mt. Rawdon and Mt. Carlton. Mungari is based on post Mungari mill expansion objective of ~200kozpa. Cowal and Red Lake based on medium-term
production objectives of ~350kozpa (refer to ASX announcement released on 16 July 2021 entitled “Cowal Underground Board Approval and Group 3 Year Outlook”)
17
17
3. Mine Life based on Evolution’s current life of mine plans. Mungari reflects the contribution to mine life extensions expected from the Kundana AssetsBALANCE SHEET 120%
Dividends declared (AUD cps) 20
18
100%
16
14
80%
12
Dividends: 9
60% 10
5
8
17 consecutive dividends declared since 2013 40% 6 6
4
A$943M returned to shareholders 20% 1 2 3 7 7 4
1 1 2 3.5 3.5 2
0% 0
FY15 FY16 FY17 FY18 FY19 FY20 FY21
Interim (cps) Final (cps)
Continued Strengthening of Balance Sheet
Investment grade debut debt placement
Pro forma debt maturity profile (A$M) 1
477
US$550M with maturities in FY29 and FY32
Average fixed coupon of 3.05%
273
240
Average debt maturity now 7 years
No material debt repayments until FY26 50 50 50 50
Low leverage at < 0.5x and modest gearing at 15%
FY22 FY23 FY24 FY25 FY26 FY27 FY28 FY29 FY30 FY31 FY32
Facility E - Term Loan New USPP Notes
1. USPP notes to be drawn in November 2021. Part of the proceeds will be directed to repayment of the Facility B loan
which is currently drawn to A$450M. 18Disciplined growth
Portfolio located Continued focus
investment in long-
solely in tier 1 on return on
life cornerstone
jurisdictions capital
assets
Building a gold company that prospers through the cycle
19Appendix
20EVOLUTION 2020 GOLD MINERAL RESOURCES
Gold Measured Indicated Inferred Total Resource Dec 19
Resource
Gold Gold Gold Gold Gold Gold Gold
Tonnes Gold Tonnes Tonnes Tonnes CP4 Gold Metal
Project Type Cut-Off Metal Grade Metal Grade Metal Grade Metal
(Mt) Grade (g/t) (Mt) (Mt) (Mt) (koz)
(koz) (g/t) (koz) (g/t) (koz) (g/t) (koz)
Cowal1 Open pit 0.35 20.63 0.46 306 209.19 0.85 5,724 22.90 0.84 615 252.71 0.82 6,645 1 6,0891
Cowal UG 1.5 - - - 22.78 2.55 1,868 14.75 2.43 1,151 37.53 2.50 3,019 1 2,502
Cowal1 Total 20.63 0.46 306 231.97 1.02 7,593 37.65 1.46 1,765 290.24 1.04 9,664 1 8,591
Red Lake3 Total 3.3 - - - 28.09 7.45 6,371 19.72 6.82 4,322 47.81 7.19 11,053 2 -
Mungari1 Open pit 0.5 - - - 37.55 1.19 1,443 6.80 1.35 296 44.36 1.22 1,739 3 1,849
Mungari UG 1.8 0.34 5.09 56 1.78 3.25 187 2.58 2.46 204 4.71 2.95 448 3 560
Mungari1 Total 0.34 5.09 56 39.34 1.29 1,629 9.39 1.66 500 49.07 1.39 2,186 3 2,409
Mt Rawdon1 Total 0.21 7.29 0.34 81 32.91 0.60 630 10.47 0.52 175 50.66 0.54 885 4 1,062
Mt Carlton1 Open pit 0.35 - - - 6.96 0.70 157 2.17 2.56 178 9.12 1.14 335 5 3431
Mt Carlton3 UG 2.55 - - - 0.33 4.26 45 0.08 3.19 7.88 0.40 4.05 52 5 75
Mt Carlton1 Total - - - 7.28 0.86 201 2.24 2.58 186 9.53 1.26 387 5 418
Ernest Henry2 Total 0.9 4.29 0.51 70 45.43 0.61 896 8.98 0.61 177 58.70 0.61 1,143 6 1,288
Marsden Total 0.2 - - - 119.83 0.27 1,031 3.14 0.22 22 122.97 0.27 1,053 1 1,053
Total 32.55 0.49 513 504.85 1.15 18,711 91.59 2.43 7,147 628.99 1.30 26,371 15,167
Data is reported to significant figures to reflect appropriate precision and may not sum precisely due to rounding. Mineral Resources are reported inclusive of Ore Reserves. ‘UG’ denotes underground.
1Includes stockpiles 2 Ernest Henry Operation cut-off 0.9% CuEq 3 Red Lake cut-off is 3.3g/t Au except for Cochenour (3.0g/t Au) and HG Young (3.2g/t Au) deposits
4Group Mineral Resources Competent Person (CP) Notes refer to 1. James Biggam; 2. Dean Fredericksen; 3. Brad Daddow; 4. Tim Murphy; 5. Ben Coutts; 6. Jessica Shiels (Glencore)
5The Mineral Resource for the Mt Carlton A39 underground deposit has been estimated using a AuEq (g/t) cut-off of 4.4g/t to enable quotation of this silver rich deposit as equivalent gold ounces.
The gold equivalent (AuEq) calculation accounts for silver recoveries determined from metallurgical test work and uses an assumed silver price of A$26/oz and gold price of A$2,000/oz as per the below equation.
AuEq=26/2,000*0.8203*silver grade (Silver price/Gold price*silver recovery*silver grade). It is the Competent Persons opinion that the assigned cut-off criteria satisfies the JORC Code requirement that the reported Mineral Resource meets reasonable prospects of eventual
economic extraction and that the silver present within the A39 deposit can be economically recovered.
Full details of the Evolution Mineral Resources and Ore Reserves are provided in the report entitled “Annual Mineral Resources an Ore Reserves Statement” released to the ASX on 17 February 2021 and available to view at www.evolutionmining.com.au
Full details of the Ernest Henry Mineral Resources and Ore Reserves are provided in the report entitled “Glencore Resources and Reserves as at 31 December 2020” released 3 February 2021 and available to view at www.glencore.com.
The Company confirms that it is not aware of any new information or data that materially affects the information included in the Reports and that all material assumptions and parameters underpinning the estimates in the Reports continue to apply and have
not materially changed except for the Cowal Underground. This revised information is provided in ASX release entitled ‘Cowal Underground Board Approval, Red Lake Growth Update and Group Three-year Outlook‘ released on 16 July 2021 and available to
view at www.evolutionmining.com. The Company confirms that the form and context in which the Competent Persons’ findings are presented have not been materially modified from the Reports. Evolution Mining has an economic interest earning rights to
100% of the revenue from future gold production and 30% of future copper and silver produced from an agreed area, and 49% of future gold, copper and silver produced from the Ernest Henry Resource outside the agreed area. The Ernest Henry Resource
is reported here on the basis of economic interest and not the entire mine resource. The above reported figures constitute 77% of the total Ernest Henry gold resource. 21EVOLUTION 2020 GOLD ORE RESERVES
Dec 19
Gold Proved Probable Total Reserve
Reserves
Gold Gold Gold CP4
Tonnes Gold Tonnes Gold Grade Tonnes Gold Gold Metal
Project Type Cut-Off Metal Metal Metal
(Mt) Grade (g/t) (Mt) (g/t) (Mt) Grade (g/t) (koz)
(koz) (koz) (koz)
Cowal1 Open pit 0.45 20.60 0.46 306 104.72 0.96 3,241 125.32 0.88 3,547 1 3,6341
Cowal Underground 1.8 - - - 12.55 2.59 1,045 12.55 2.59 1,045 2
Cowal Total 20.60 0.46 306 117.27 1.14 4,287 137.87 1.04 4,593 4,438
Red Lake3 Total 4.3 - - - 13.16 6.90 2,929 13.16 6.90 2,929 3
Mungari Underground 2.9 - - - 0.30 3.57 35 0.30 3.57 35 4 68
Mungari1 Open pit 0.75 - - - 9.68 1.35 419 9.68 1.35 419 4 500
Mungari1 Total - - - 9.98 1.41 454 9.98 1.41 454 4 568
Mt Rawdon1 Open pit 0.3 4.26 0.41 56 15.82 0.67 342 20.08 0.62 398 5 538
Mt Carlton1 Open pit 0.8 - - - 6.13 0.63 124 6.13 0.63 124 6 2701
Mt Carlton5 Underground 3.2 - - - 0.30 4.52 44 0.30 4.52 44 6 40
Mt Carlton1 Total - - - 6.43 0.81 168 6.43 0.81 168 6 311
Ernest Henry2 Underground 0.9 2.67 0.81 70 29.94 0.47 455 32.62 0.50 525 7 660
Marsden Open pit 0.3 - - - 65.17 0.39 817 65.17 0.39 817 6 817
Total 27.54 0.49 432 257.77 1.14 9,452 285.31 1.08 9,884 6,642
Data is reported to significant figures to reflect appropriate precision and may not sum precisely due to rounding
1Includes stockpiles 2 Ernest Henry Operation cut-off 0.9% CuEq 3Red Lake cut-off is 4.3g/t Au except for Lower Campbell (4.4g/t Au) and Upper Campbell (2.5g/t Au) deposits
4Group Ore Reserve Competent Person (CP) Notes refer to 1. Ryan Kare; 2: Joshua Northfield; 3.Brad Armstrong; 4: Ken Larwood; 5. Thomas Lethbridge; 6. Anton Kruger; 7. Michael Corbett (Glencore)
5The Ore Reserve for the Mt Carlton A39 underground deposit has been estimated using a AuEq (g/t) cutoff of 6.1g/t to enable quotation of this silver rich deposit as equivalent gold ounces.
The gold equivalent (AuEq) calculation accounts for silver recoveries determined from metallurgical test work and uses an assumed silver price of A$20/oz and gold price of A$1,450/oz as per the below equation.
AuEq = 20/1,450*0.8203*silver grade (Silver price/Gold price*silver recovery*silver grade). It is the Competent Persons opinion that the assigned cut-off criteria meets the minimum acceptable criteria to support economic extraction and that the silver present within the A39
deposit can be economically recovered.
Full details of the Evolution Mineral Resources and Ore Reserves are provided in the report entitled “Annual Mineral Resources an Ore Reserves Statement” released to the ASX on 17 February 2021 and available to view at www.evolutionmining.com.au
Full details of the Ernest Henry Mineral Resources and Ore Reserves are provided in the report entitled “Glencore Resources and Reserves as at 31 December 2020” released 3 February 2021 and available to view at www.glencore.com.
The Company confirms that it is not aware of any new information or data that materially affects the information included in the Reports and that all material assumptions and parameters underpinning the estimates in the Reports continue to apply and have
not materially changed except for the Cowal Underground. This revised information is provided in ASX release entitled ‘Cowal Underground Board Approval, Red Lake Growth Update and Group Three-year Outlook‘ released on 16 July 2021 and available to
view at www.evolutionmining.com. The Company confirms that the form and context in which the Competent Persons’ findings are presented have not been materially modified from the Reports. Evolution Mining has an economic interest earning rights to
100% of the revenue from future gold production and 30% of future copper and silver produced from an agreed area, and 49% of future gold, copper and silver produced from the Ernest Henry Resource outside the agreed area. The Ernest Henry Resource
is reported here on the basis of economic interest and not the entire mine resource. The above reported figures constitute 86% of the total Ernest Henry gold reserve 22EVOLUTION 2020 COPPER RESOURCES & RESERVES
Group Copper Mineral Resource Statement
Dec 19
Copper Measured Indicated Inferred Total Resource
Resources
Copper Copper Copper Copper Copper Copper CP3
Tonnes Copper Tonnes Copper Tonnes Tonnes Copper
Project Type Cut-Off Metal Metal Grade Metal Grade Metal
(Mt) Grade (%) (Mt) Grade (%) (Mt) (Mt) Metal (kt)
(kt) (kt) (%) (kt) (%) (kt)
Marsden Total 0.2 - - - 119.83 0.46 553 3.14 0.24 7 122.97 0.46 560 1 560
Ernest Henry2 Total 0.9 1.54 0.93 14 20.20 1.16 234 7.11 1.16 83 28.85 1.15 331 2 356
Mt Carlton1 Open pit 0.35 - - - 1.25 0.29 4 1.04 0.43 5 2.29 0.29 7 3 14
Mt Carlton UG 2.55 - - - 0.33 1.30 4 0.08 1.07 1 0.40 1.25 5 3 4
Mt Carlton1 Total - - - 1.58 0.50 8 1.12 0.48 5 2.69 0.49 13 3 18
Total 1.54 0.93 14 141.61 0.56 794 11.36 0.84 95 154.51 0.58 904 934
Group Copper Ore Reserve Statement
Dec 19
Copper Proved Probable Total Reserve
Reserves
CP3
Copper Copper Copper Copper Copper Copper Copper
Project Type Cut-Off Tonnes (Mt) Tonnes (Mt) Tonnes (Mt)
Grade (%) Metal (kt) Grade (%) Metal (kt) Grade (%) Metal (kt) Metal (kt)
Marsden 0.3 - - - 65.17 0.57 371 65.17 0.57 371 1 371
Ernest Henry2 Total 0.9 0.80 1.49 12 12.94 0.91 117 13.74 0.94 129 2 150
Mt Carlton1 Open pit 1.8 - - - 0.32 0.12 0 0.32 0.12 0 1 10
Mt Carlton Underground 3.2 - - - 0.30 1.40 4 0.30 1.40 4 1 1
Mt Carlton1 Total - - - 0.62 0.74 5 0.62 0.74 5 1 11
Total 0.80 1.49 12 78.73 0.63 493 79.53 0.63 505 532
Group Mineral Resources Competent Person3 (CP) Notes refer to: 1. James Biggam; 2. Jessica Shiels (Glencore); 3 Ben Coutts
Group Ore Reserve Competent Person3 (CP) Notes refer to: 1. Anton Kruger; 2. Michael Corbett (Glencore)
Data is reported to significant figures to reflect appropriate precision and may not sum precisely due to rounding. Mineral Resources are reported inclusive of Ore Reserves. Evolution cut-off grades are reported in g/t gold
1 Includes stockpiles. 2 Ernest Henry Operation cut-off 0.9% CuEq
Full details of the Evolution Mineral Resources and Ore Reserves are provided in the report entitled “Annual Mineral Resources an Ore Reserves Statement” released to the ASX on 17 February 2021 and available to view at www.evolutionmining.com.au
Full details of the Ernest Henry Mineral Resources and Ore Reserves are provided in the report entitled “Glencore Resources and Reserves as at 31 December 2020” released 3 February 2021 and available to view at www.glencore.com.
The Company confirms that it is not aware of any new information or data that materially affects the information included in the Reports and that all material assumptions and parameters underpinning the estimates in the Reports continue to apply and have
not materially changed. The Company confirms that the form and context in which the Competent Persons’ findings are presented have not been materially modified from the Reports. Evolution Mining has an economic interest earning rights to 100% of the
revenue from future gold production and 30% of future copper and silver produced from an agreed area, and 49% of future gold, copper and silver produced from the Ernest Henry Resource outside the agreed area. The Ernest Henry Resource is reported
here on the basis of economic interest and not the entire mine resource. The above reported figures constitute 38% of the total Ernest Henry copper resource and 35% of the total Ernest Henry copper reserve.
23KUNDANA ASSETS RESOURCES & RESERVES
Kundana Assets Mineral Resource Statement1
Gold Measured Indicated Inferred Total Resource
Gold Gold
Tonnes Gold Grade Tonnes Gold Gold Metal Tonnes Gold Gold Metal Tonnes Gold Metal
Project Metal Grade
(Mt) (g/t) (Mt) Grade (g/t) (koz) (Mt) Grade (g/t) (koz) (Mt) (koz)
(koz) (g/t)
Kundana (100%) 0.59 4.2 80 4.07 4.4 571 3.27 3.8 403 7.93 4.1 1,053
EKJV (51%)2 1.12 6.2 223 2.88 5.2 485 2.06 4.5 295 6.06 5.2 1,003
Carbine (100%) - - - 2.89 2.3 213 1.87 2.9 174 4.76 2.5 387
Total 1.71 5.5 302 9.84 4.0 1,269 7.20 3.8 872 18.83 4.1 2,443
Kundana Assets Ore Reserve Statement1
Gold Proved Probable Total Reserve
Gold Grade Gold Metal Gold Grade Gold Metal Tonnes Gold Grade Gold Metal
Project Tonnes (Mt) Tonnes (Mt)
(g/t) (koz) (g/t) (koz) (Mt) (g/t) (koz)
Kundana (100%) 0.20 4.8 30 1.34 4.3 184 1.53 4.4 214
EKJV (51%)2 0.66 4.8 101 1.07 5.4 185 1.73 5.1 286
Carbine (100%) - - - 1.24 2.0 78 1.24 2.0 78
Total 0.85 4.8 131 3.65 3.8 447 4.50 4.0 579
(1) Kundana Assets Mineral Resources and Ore Reserves are provided in Evolution’s ASX announcement entitled ‘Acquisition to elevate Mungari to a cornerstone asset and A$400 million equity raising’ released on 22 July 2021 and available to view at
www.evolutionmining.com.au. Those Mineral Resources and Ore Reserves have been prepared based on Mineral Resource and Ore Reserve estimation criteria using a gold price assumption of A$2,250/oz to estimate Mineral Resources and A$1,750/oz
to estimate Ore Reserves. The Kundana Assets Mineral Resources and Ore Reserves are expected to be re-estimated as at 31 December 2021 as part of Evolution’s Annual Mineral Resources and Ore Reserves Statement which will be released in
February 2022. Rounding may result in apparent summation differences between tonnes, grade and contained metal content. Ounces are estimates of metal contained in the Ore Reserve and do not include allowances for processing losses
(2) EKJV deposits are 51% interest, except Raleigh and Falcon North which are 50%
The Company confirms that it is not aware of any new information or data that materially affects the information included in the Company’s 22 July 2021 announcement and that all material assumptions and parameters underpinning the estimates in the Report
continue to apply and have not materially changed. The Company confirms that the form and context in which the Competent Persons’ findings are presented have not been materially modified from the Company’s 22 July 2021 announcement.
24FY22 GUIDANCE – PRODUCTION COSTS & CAPITAL
All-in Sustaining Sustaining
Gold Production Major Capital**
FY22 Guidance Cost* Capital**
(oz) (A$/oz) (A$M) (A$M)
Cowal 230,000 – 250,000 1,180 – 1,220 35.0 – 40.0 260.0 – 280.0
Red Lake 155,000 – 165,000 1,600 – 1,660 55.0 – 60.0 130.0 – 155.0
Mungari 115,000 – 125,000 1,750 – 1,800 15.0 – 22.5 25.0 – 40.0
Mt Rawdon 75,000 – 80,000 1,470 – 1,520 5.0 – 10.0 12.5 – 17.5
Mt Carlton 45,000 – 50,000 1,650 – 1,700 5.0 – 10.0 12.5 – 17.5
Ernest Henry 80,000 – 90,000 (780) – (720) 10.0 – 12.5 0
Corporate 70 – 75
Group 700,000 – 760,000 1,220 – 1,280 125.0 – 155.0 440.0 – 510.0
Ernest Henry (Cu t) 17,000 – 19,000
Mt Carlton (Cu t) 1,500 – 2,500
*AISC is based on Gold price of A$2,200/oz (royalties) and Copper price of A$11,000/t (By-product credits)
** Corporate capital of A$3M (Sustaining) and A$2M (Major) not included above
25FY22 GUIDANCE
DISCOVERY AND NON-CASH
Depreciation &
Discovery
FY22 Guidance Amortisation
(A$M)
(A$/oz)
Cowal 410 – 460 5.0 - 10.0
Red Lake 330 – 380 15.0 – 20.0
Mungari 420 – 470 5.0 – 10.0
Mt Rawdon 700 – 750 0.0 – 2.0
Mt Carlton 520 – 570 0.0 – 3.0
Ernest Henry 1,420 – 1,470 0.0
Corporate 10.0 – 15.0
Group 560 – 610 35.0 – 60.0
26PRODUCTION AND COST OUTLOOK
Cornerstone assets driving production towards 1Mozpa by FY24 Production (koz)
Cowal trends up to 350kozpa by FY24 from Stage H and Underground
940 – 1,010
Red Lake achieves >200kozpa in FY23 and >250kozpa in FY24 815 - 875
700 - 760
Mungari improved by Kundana and EKJV acquisition
681
Mt Rawdon production lower due to change to wall angles
Mt Carlton benefits from Crush Creek in FY24 FY21A FY22 FY23 FY24
Copper production of 18 – 20ktpa
All In Sustaining Cost1
Maintaining low cost (AISC) position (A$/oz)
Labour costs remain at ~53% of cost base
Expected to move at 3 – 4% each year
Production mix drives AISC for FY22 mainly Mungari
1,220 - 1,170 -
1,215 1,125 -
Cowal and Red Lake main drivers to lower costs in FY23 1,280
1,185 1,230
Increase in FY24 is driven predominantly by higher mine development
(operating and capital) at Red Lake to match with increased FY21A FY22 FY23 FY24
processing capacity
Three-year forecast financials to be read in conjunction with information provided on
slide 3 of this presentation
1. AISC is based on Gold price of A$2,200/oz (royalties) and Copper price of A$11,000/t
(By-product credits)
27CAPITAL OUTLOOK SUSTAINING CAPITAL
Equipment and infrastructure replacement due to longer mine life plans
Sustaining Capital Cowal A$35 – 45M per year
(A$M) Red Lake A$40 – 45M (FY22); A$45M – 55M (FY23 & FY24)
Red Lake mine development: A$15 – 20M per year
MAJOR CAPITAL
106 125 - 155 120 - 160 125 - 165
FY21A FY22 FY23 FY24
Cowal FY22 FY23 FY24
Underground A$145 – 160M1 A$235 – 245M A$35 – 40M2
Integrated Waste Landform A$75 – 80M A$45 – 50M A$25 – 30M
Major Capital
(A$M) Open Pits Feasibility Study A$15 – 20M
Red Lake
Existing Mining Operations A$50 – 55M A$50 – 55M A$55 – 60M
440 - 510 490 - 560 Upper Campbell A$35 – 40M A$70 – 75M A$55 – 60M
274 290 - 360
McFinley A$25 – 30M A$35 – 40M A$10 – 15M
FY21A FY22 FY23 FY24
Campbell Mill Expansion A$10 – 15M A$20 – 25M
Bateman Mill Expansion3 A$10 – 15M A$40 – 45M
Three-year forecast financials to be read in conjunction with
information provided on slide 3 of this presentation Mungari
Mine development A$20 – 30M A$20 -30M
1. Includes A$15-20M for completion of Galway Decline
2. Mine capital development post-commissioning
Plant expansion A$80 – 90M
3. Includes water treatment project of A$15-20M 28You can also read