Critical Habitats and Biodiversity: Inventory, Thresholds and Governance - High Level Panel for a ...
←
→
Page content transcription
If your browser does not render page correctly, please read the page content below
Commissioned by

                                                                            BLUE PAPER

                  Critical Habitats
                  and Biodiversity:
                  Inventory,
                  Thresholds and
                  Governance
                  LEAD AUTHORS

                  Alex D. Rogers, Octavio Aburto-Oropeza

                  CONTRIBUTORS:

                  Ward Appeltans, Jorge Assis, Lisa T. Ballance, Philippe Cury, Carlos Duarte,
                  Fabio Favoretto, Joy Kumagai, Catherine Lovelock, Patricia Miloslavich,
                  Aidin Niamir, David Obura, Bethan C. O’Leary, Gabriel Reygondeau, Callum
                  Roberts, Yvonne Sadovy, Tracey Sutton, Derek Tittensor, Enriqueta Velarde

                                                                                        oceanpanel.org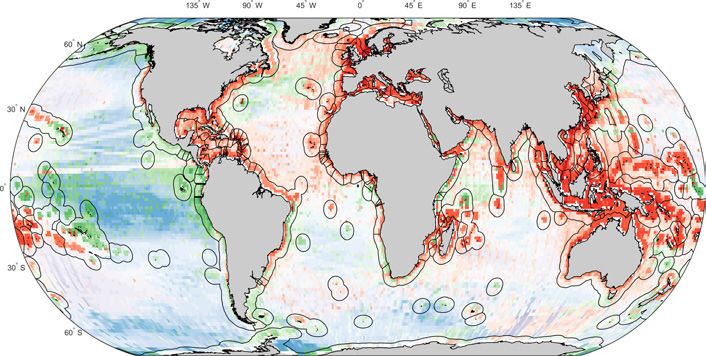
About this Paper
         Established in September 2018, the High Level Panel for a Sustainable Ocean Economy (HLP) is a unique
         initiative of 14 serving heads of government committed to catalysing bold, pragmatic solutions for ocean
         health and wealth that support the Sustainable Development Goals of the United Nations and build a better
         future for people and the planet. By working with governments, experts and stakeholders from around the
         world, the HLP aims to develop a roadmap for rapidly transitioning to a sustainable ocean economy and to
         trigger, amplify and accelerate responsive action worldwide.

         The HLP consists of the presidents or prime ministers of Australia, Canada, Chile, Fiji, Ghana, Indonesia,
         Jamaica, Japan, Kenya, Mexico, Namibia, Norway, Palau and Portugal, and it is supported by an Expert
         Group, Advisory Network and Secretariat that assist with analytical work, communications and stakeholder
         engagement. The Secretariat is based at the World Resources Institute. The HLP has commissioned a
         series of ‘Blue Papers’ to explore pressing challenges at the nexus of the ocean and the economy. These
         papers summarise the latest science and state-of-the-art thinking about innovative ocean solutions in the
         technology, policy, governance and finance realms that can help accelerate a move into a more sustainable
         and prosperous relationship with the ocean.

         This paper is part of a series of 16 papers to be published between November 2019 and October 2020. It
         addresses how multiple human impacts will impact biodiversity underpinning ecosystem services such
         as marine fisheries, aquaculture, coastal protection and tourism. The paper examines the distribution of
         marine species and critical marine habitats around the world; analyses trends in drivers, pressures, impacts
         and response; and establishes thresholds for protecting biodiversity hot spots, and indicators to monitor
         change. From this scientific base, it assesses the current legal framework and available tools for biodiversity
         protection, current gaps in ocean governance and management and the implications for achieving a
         sustainable ocean economy tailored to individual coastal states grouped by social indicators.

         This Blue Paper is an independent input to the HLP process and does not represent the thinking of the HLP,
         Sherpas or Secretariat.

         Suggested Citation: Rogers, A., O. Aburto-Oropeza, et al. 2020. Critical Habitats and Biodiversity: Inventory,
         Thresholds and Governance. Washington, DC: World Resources Institute. Available online at
         www.oceanpanel.org/blue-papers/critical-habitats-and-biodiversity-inventory-thresholds-and-governance.

ii | High Level Panel for a Sustainable Ocean Economy
Table of Contents
1. Overview. . . . . . . . . . . . . . . . . . . . . . . . . . . . . . . . . . . . . . . . . . . . . . . . . . . . . . . . . . . . . . . . . . . . . . . . . . . . . . . . 4
2. An Inventory of Marine Habitats and Biodiversity. . . . . . . . . . . . . . . . . . . . . . . . . . . . . . . . .  7
3. Biodiversity Loss. . . . . . . . . . . . . . . . . . . . . . . . . . . . . . . . . . . . . . . . . . . . . . . . . . . . . . . . . . . . . . . . . . . . . 14
4. Thresholds and Tipping Points. . . . . . . . . . . . . . . . . . . . . . . . . . . . . . . . . . . . . . . . . . . . . . . . . . . . . 31
5. Monitoring. . . . . . . . . . . . . . . . . . . . . . . . . . . . . . . . . . . . . . . . . . . . . . . . . . . . . . . . . . . . . . . . . . . . . . . . . . . . 35
6. Gaps and Challenges in Habitat Protection. . . . . . . . . . . . . . . . . . . . . . . . . . . . . . . . . . . . . .  39
7. International Conventions and Agreements. . . . . . . . . . . . . . . . . . . . . . . . . . . . . . . . . . . . . . 46
8. Opportunities for Action. . . . . . . . . . . . . . . . . . . . . . . . . . . . . . . . . . . . . . . . . . . . . . . . . . . . . . . . . . . . 53
9. Limitations of the Paper and Conclusions. . . . . . . . . . . . . . . . . . . . . . . . . . . . . . . . . . . . . . . . 61
Abbreviations. . . . . . . . . . . . . . . . . . . . . . . . . . . . . . . . . . . . . . . . . . . . . . . . . . . . . . . . . . . . . . . . . . . . . . . . . .  63
Endnotes. . . . . . . . . . . . . . . . . . . . . . . . . . . . . . . . . . . . . . . . . . . . . . . . . . . . . . . . . . . . . . . . . . . . . . . . . . . . . . . . 65
Acknowledgements. . . . . . . . . . . . . . . . . . . . . . . . . . . . . . . . . . . . . . . . . . . . . . . . . . . . . . . . . . . . . . . . . . .  84
About the Authors. . . . . . . . . . . . . . . . . . . . . . . . . . . . . . . . . . . . . . . . . . . . . . . . . . . . . . . . . . . . . . . . . . . . .  84
Foreword
The High Level Panel for a Sustainable Ocean Economy (HLP) commissioned us, the co-chairs of the HLP Expert Group
(a global group of over 70 content experts), to organize and edit a series of ‘Blue Papers’ to explore pressing challenges
at the nexus of the ocean and the economy. The HLP identified 16 specific topics for which it sought a synthesis of
knowledge and opportunities for action. In response, we convened 16 teams of global content experts. Each resulting
Blue Paper was independently peer reviewed and revised accordingly. The final Blue Papers summarise the latest science
and state-of-the-art thinking on how technology, policy, governance and finance can be applied to help accelerate a
more sustainable and prosperous relationship with the ocean, one that balances production with protection to achieve
prosperity for all, while mitigating climate change.

Each Blue Paper offers a robust scientific basis for the work of the HLP. Together they provide the foundation for an
integrated report to be delivered to the HLP. In turn, the HLP plans to produce its own set of politically endorsed
statements and pledges or recommendations for action.

Marine biodiversity is being lost at an unprecedented rate as a result of human activities, both direct and indirect, on land
and in the water. Such loss has significant consequences for the whole of society. Marine biodiversity provides a unique
set of goods and services to society, including moderating climate; processing waste and toxicants; and provisioning
food, medicines and employment for significant numbers of people. Because most of the biodiversity in the ocean is
still unexplored, we do not know the myriad new medicines, materials, knowledge and solutions still to be discovered.
The loss of marine biodiversity impacts livelihoods and food security and jeopardises human health and security—today
and in the future. This Blue Paper provides an overview of the reasons for habitat degradation and biodiversity loss and
the impacts that result. Moreover, it proposes action opportunities that would help ensure that activities affecting the
ocean respect, maintain and, where possible, restore the ocean’s habitats and biodiversity. This paper provides a strong
argument for the need to conserve critical habitats in the context of planning for a sustainable ocean economy.

As co-chairs of the HLP Expert Group, we wish to warmly thank the authors, the reviewers and the Secretariat at the World
Resources Institute for supporting this analysis. We thank the members of the HLP for their vision in commissioning this
analysis. We hope they and other parties act on the opportunities identified in this paper.

Hon. Jane Lubchenco, Ph.D.               Professor Peter Haugan, Ph.D.                      Hon. Mari Elka Pangestu, Ph.D.
Oregon State University                  Institute of Marine Research, Norway               University of Indonesia

                                                                                               Critical Habitats and Biodiversity | 1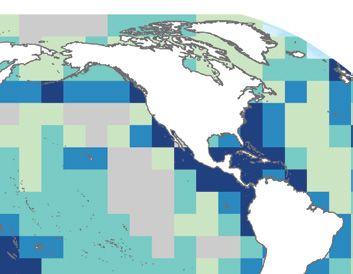
Key Messages
Evidence suggests that ocean biodiversity at all levels is being lost as a result of the direct and indirect
impacts of human pressures. The main drivers of biodiversity loss are overexploitation and human
pressures in coastal environments (development, habitat loss, pollution, disturbance). Increasingly,
climate change and ocean acidification are and will be drivers of biodiversity loss especially in sensitive
coastal ecosystems.
Despite advances in understanding the distribution of species and habitats in the ocean, many aspects
of marine biodiversity remain poorly understood. As a result, changes in marine biodiversity are difficult
to ascertain and there is a critical need to establish current baselines and trends through survey and
monitoring activities.
There needs to be a concerted effort to increase funding and capacity for marine biodiversity research,
especially in developing countries which are rich in biodiversity. There also needs to be an increase in
collaboration across scientific disciplines and other data users and measures to make data collection
and analysis interoperable and repeatable to ensure that we can enjoy the benefits of ecosystem services
which underpin the blue economy whilst ensuring that biodiversity is conserved. These efforts should be
focused on the already established international networks for biodiversity monitoring that include the
Biology and Ecosystems Panel of the Global Ocean Observing System (GOOS BioEco), the Group on Earth
Observation Biodiversity Observation Network (GEO BON), the Marine Biodiversity Observation Network
(MBON), and global data integrators such as the Ocean Biogeographic Information System (OBIS) of the
International Oceanographic Data and Information Exchange (IODE) programme of the International
Oceanographic Commission of the United Nations Educational, Scientific and Cultural Organization
(UNESCO-IOC) and the Ocean Data Viewer of the United Nations Environment Programme’s World
Conservation Monitoring Centre (UNEP-WCMC).
There has been a significant apparent increase in the coverage of marine protected areas (MPAs). However,
most MPAs are only lightly to minimally protected, with many lacking even management plans and very
few classified as fully protected. Maximum environmental and societal benefits accrue only when 30–40
percent of key marine ecosystems are represented in fully or highly protected and implemented MPAs.
We estimate that only 3 percent of the key habitats explored in this study lie in fully protected MPAs, and
for some habitats, no countries have placed them in fully protected MPAs. Hence, opportunities abound
to strengthen protection in existing MPAs and create new highly to fully protected MPAs, paying close
attention to positive enabling conditions, good design principles and adequate enforcement and funding.
It is critical to establish a legal framework for the conservation of biodiversity in the whole ocean, including
areas beyond national jurisdiction. For this reason, reaching a strong agreement for the new international
legally binding instrument on the conservation and sustainable use of biological diversity of areas beyond
national jurisdiction (BBNJ) is essential.
The ability of wealthier countries to implement conservation measures within their exclusive economic
zones (EEZs) is higher and might need to compensate for less wealthy countries with higher biodiversity
and higher pressures. Achieving the 30–40 percent target in fully or highly protected areas, especially in
developing countries, will be greatly enhanced by capacity building, financial support and development of
alternate economically viable options for employment.
Marine ecosystems often exhibit tipping points where pressures lead to a major regime shift that results
in an alternative and less productive state. Recognising such tipping points and incorporating them as
reference points in fisheries management can greatly improve marine species conservation as well as the
functioning and resilience of marine ecosystems.
2 | High Level Panel for a Sustainable Ocean Economy Accelerated and expanded reform of fisheries management practices are required if the food and
nutritional needs of a growing human population are to be met without permanent and long-lasting
biodiversity loss resulting in the erosion of ecosystem services. It is especially important that these
reforms include greatly improved monitoring of catch and bycatch in fisheries; the elimination of
illegal practices in industrial fisheries through improved enforcement; a reduction in the fishing
capacity where it is contributing to overfishing and/or damage to biodiversity whilst ensuring that basic
needs for food, nutrition and livelihoods are met in coastal communities; and better incorporation
of biodiversity considerations into all levels of fisheries management and the fishing industry. There
must be better collaboration with the environmental sector for government departments and also with
intergovernmental and non-governmental organisations.
Critical Habitats and Biodiversity | 31. Overview
Marine habitats are extremely valuable in many ways damage to society (Beck et al. 2018). Without reefs, the
(e.g., economically, culturally or for subsistence) and economic impact of flooding would more than double,
provide many necessary services for humans (Costanza with the area of land affected increasing by 69 percent
et al. 1997, 2014). Despite their importance, coastal and and people affected by 81 percent (Beck et al. 2018).
oceanic habitats are increasingly threatened by fishing, The loss of this critical ecosystem, which is estimated
climate change, oil and gas exploration, pollution and to result in a 1–10 percent reduction of its former range
coastal development (Jackson et al. 2001; Halpern et under the most optimistic future scenarios (IPCC 2018), is
al. 2008, 2019; Heery et al. 2017; Harris 2020). Habitat a looming crisis of vast ecological and social dimensions.
degradation and loss from these threats are not
In response to habitat degradation, losses in biodiversity
uniformly distributed and are cumulative with poorly
and associated impacts, there has been an international
understood interactions between pressures (Halpern
effort towards conserving marine ecosystems. The
et al. 2008). Despite the enormous impacts humans
Strategic Plan for Biodiversity 2011–2020 from the
have had on marine ecosystems in the global ocean
Convention on Biological Diversity (CBD) has resulted
over the past 50 years, they tend to appear not as the
in an accelerated effort to increase the protection of
complete extinction of individual species (Dulvy et al.
marine areas. Specifically, Aichi Biodiversity Target 11
2003) but rather as changes in ecosystem composition
calls for the conservation by 2020 of ‘at least 10% of
and in the relative abundance and ecological status of
coastal and marine areas, especially areas of particular
individual species, along with more regional or local
importance for biodiversity and ecosystem services . . .
extirpations (Worm and Tittensor 2011). A species
through effectively and equitably managed, ecologically
need not become globally extinct to radically alter the
representative and well-connected systems of protected
composition of the ecosystem (‘ecological extinction’),
areas and other effective area-based conservation
disappear from the local environment (‘local extinction’)
measures’. A body of scientific literature suggests that
or become commercially non-viable (‘commercial
the Aichi Biodiversity Target should be a first step. More
extinction’). Biodiversity loss is a globally significant
ambitious targets of ocean protection (e.g., 30 percent),
symptom of unsustainable exploitation of Earth’s natural
have been proposed and discussed in the scientific
environment and a major threat to the ecosystem
literature for many years (Gell and Roberts 2003;
services on which we, and future generations, depend.
Balmford et al. 2004). Recent meta-analyses indicate
The ocean’s natural capacity to provide ecosystem that maximum environmental and societal benefits do
services such as food, coastal protection and carbon not accrue until 30–40 percent of representative marine
sequestration are being eroded as a result of the above ecosystems are protected (Gell and Roberts 2003; Gaines
changes (Cheung et al. 2010, 2013; Barange et al. 2014; et al. 2010; O’Leary et al. 2016; Sala et al. 2018a). This
Spalding et al. 2014; Arias-Ortiz et al. 2018). Over 500 call for an enhanced scope for protection was endorsed
million people worldwide live in the coastal zone and are by Resolution 50 of the International Union for the
afforded protection by ecosystems such as coral reefs, Conservation of Nature (IUCN) at the World Conservation
mangroves forests, seagrass beds and kelp forests. In the Congress in 2016 ‘to designate and implement at
case of coral reefs, the reduction in damage to terrestrial least 30% of each marine habitat in a network of
assets conferred through coastal protection is estimated highly protected MPAs and other effective area-based
at US$4 billion annually (Beck et al. 2018). For the top conservation measures, with the ultimate aim of creating
five countries that benefit from reef protection, this is the a fully sustainable ocean’. This call included specific
equivalent benefit of $400 million annually in mitigated reference to implementing protected areas in the
4 | High Level Panel for a Sustainable Ocean Economyexclusive economic zone (EEZ) of countries and in areas but complementary tool to supplement an existing MPA
beyond national jurisdiction (ABNJ) (IUCN 2016). network; however, they are not necessarily (or generally)
mandated with a biodiversity conservation objective
Spatial conservation measures such as marine protected
(Tittensor et al. 2019).
areas (MPAs) are one way of addressing these problems
and have become the most recognised area-based Therefore, this Blue Paper focuses on MPAs because they
marine conservation measure worldwide. An abundance are supported by an important body of peer-reviewed
of evidence suggests that if they are well designed, literature indicating their effectiveness as fisheries
enforced and financed, fully protected MPAs can provide management and conservation tools. Furthermore, MPAs
an abundance of benefits, including increases in can protect biodiversity but can also restore ecosystem
biodiversity, size and abundance of previously targeted structure, function and potentially services (Cheng
species (Halpern 2003; Lester and Halpern 2008; Lester et al. 2019) that mitigate and promote adaptation to
et al. 2009; Edgar et al. 2014; Sala and Giakoumi 2017); climate change (Mumby and Harborne 2010; Micheli et
enhanced spillover of juveniles and adults to adjacent al. 2012; Roberts et al. 2017). Therefore, implementing
fished areas (Halpern et al. 2010; Di Lorenzo et al. MPAs preserves habitats and their biodiversity and
2016); and restoration of ecological interactions within allows the maintenance of valuable ecosystem services
the protected area (Micheli et al. 2004; Mumby et al. (Costanza et al. 2014). We can roughly divide MPAs into
2007). More recent studies report additional benefits, no-take areas (where no fishing is allowed) and multiuse
including enhanced resilience to environmental and areas. Although, in some cases, the latter category
climate changes (Mumby and Harborne 2010; Micheli does generate some benefits, in others, MPAs fail to
et al. 2012; Roberts et al. 2017; Bates et al. 2019). It is reach their conservation objectives completely (Agardy
important to note here that biodiversity may benefit et al. 2011). Scientific evidence is now accumulating
even further if more than 30–40 percent of representative in favour of fully protected MPAs (also known as
habitats are protected by networks of MPAs. However, marine reserves), which are dubbed most effective in
because of trade-offs between ocean conservation environmental management (McClanahan et al. 2008;
and uses such as fisheries, placing 30–40 percent of Edgar et al. 2014; MacNeil et
habitats in highly or fully protected MPAs is viewed as al. 2015; Sala and Giakoumi
the optimal balance between protection of biodiversity 2017). Fully protected marine If they are
and ecosystem service provision (Gaines et al. 2010). reserves, besides prohibiting
Also, to attain a representative coverage of 30 percent fishing activities, also remove well designed,
of marine habitats in fully or highly protected MPAs, or minimise other human
a larger area may be required than 30 percent of the pressures that enable species enforced and
ocean to attain representativeness (O’Leary et al. to maintain or recover their
financed, fully
2018; see Jones et al. 2020 for an assessment based abundance, biomass and
on species ranges lying within MPAs). Other effective diversity (Lester et al. 2009). It protected MPAs
area-based marine conservation measures (OECMs), is notable, however, that MPAs
such as locally managed marine areas, territorial use are often not well designed, can provide an
rights for fishing programs (TURFs), fisheries restricted enforced or financed (Gill
areas, particularly sensitive sea areas, and areas of et al. 2017; Dureuil et al.
abundance of
particular environmental interest, among others, have 2018), which impacts their benefits, including
proven successful in conserving important areas for effectiveness, and there is
biodiversity and ecosystem services that include food particular concern for regions increases in
security and poverty alleviation, such as in Northern of high marine biodiversity,
Mozambique (Diz et al. 2018). The IUCN has created such as the marine biodiversity
biodiversity, size
guidelines to recognise and report OECMs (IUCN-WCPA hot spot in Southeast Asia, and abundance
2019) to incentivise robust long-term conservation and where many species are
management of biodiversity. OECMs are an important reduced and destructive of previously
targeted species
Critical Habitats and Biodiversity | 5exploitation is expanding largely unchecked even Identify the range of measures undertaken by
within MPAs. governments and industrial sectors to monitor,
protect and address loss of marine biodiversity and
The High Level Panel for a Sustainable Ocean Economy
their effectiveness.
has a vision of a productive and protected ocean, which
will play a major role in achieving the Sustainable Determine opportunities for action to improve the
Development Goals (SDGs). Continued loss of marine sustainability of blue economic activities with respect
biodiversity will undermine our ability to achieve a to maintaining, and, where possible, restoring, the
number of the SDGs, especially SDG 14 (to conserve ocean’s habitats and biodiversity.
and sustainably use the ocean), but also other goals
We use the Convention on Biological Diversity’s
(e.g., SDG 2, hunger and food security; SDG 9, resilient
definition of biodiversity as the variability among living
infrastructure). This Blue Paper addresses the topic
organisms, including diversity within species, between
of critical habitats and marine biodiversity with the
species and of ecosystems (CBD 2003). The topics
following specific aims:
of marine biodiversity and ecosystem integrity are
Synthesise knowledge presenting the most recent complicated by a lack of data, which pervades almost
inventory of marine habitats and biodiversity in the all aspects of our understanding of its distribution
global ocean. and trends. By necessity, therefore, we have been
driven to examine specific aspects of the topic, such
Provide a brief overview of the impacts of habitat
as well-studied groups of organisms or habitats as
degradation and biodiversity loss in reducing
well as particular case studies. This underlines the
ecosystem services.
need for more scientific work on many aspects of
Review evidence of how biodiversity relates to ocean biodiversity, from variation within species and
ecosystem function and exploitation/degradation connectivity of populations to processes at the level
tipping points. of habitats and entire ecosystems, the sum of which
underpin the functioning of Earth.
6 | High Level Panel for a Sustainable Ocean Economy2. An Inventory of Marine
Habitats and Biodiversity
non-extracted taxa, and larger organisms tend to be
2.1 Species better known than smaller organisms (Fautin et al. 2010;
Globally, it is estimated that only 10–25 percent of Worm and Tittensor 2018). Currently, only a handful of
marine species have been described (Mora et al. species are considered to have enough independent
2011; Appeltans et al. 2012), and some of the least- records that describe their full geographic distribution
known groups are likely to have thousands to over a (about 50,000 species; Gagné et al. 2020). Emblematic
hundred thousand undescribed species (e.g., Isopoda, (mammals, corals or fish) and exploited species (fish and
Gastropoda, Tanaidacea). The geographic distributions invertebrates) are among the most well-documented
of even fewer species are known (Gagné et al. 2020). spatially. Other patterns of biodiversity, including
Genomic approaches, coupled with large-scale intraspecific genetic variation and habitat diversity,
sampling of the upper layers of the ocean (e.g., the are also not well described (Fautin et al. 2010; Blasiak
Tara expedition), have also revealed tens of thousands et al. 2020), with some exceptions. The Global Ocean
of uncharacterised microbes, including eukaryotes, Biodiversity Initiative (GOBI), which uses CoML and
prokaryotes and viruses (de Vargas et al. 2015; Sunagawa OBIS as primary sources of data, has participated in
et al. 2015). However, it is estimated that about half of the CBD effort to identify ecologically and biologically
the major taxonomic groupings (e.g., Vertebrata) have significant areas (EBSAs) in the ocean.2 These areas
identified more than 50 percent of their known species can be characterised by high biological diversity, but
already, and with the current rate of description of they also include a number of other criteria, including
new species (average of 2,000 new species described unique or rare species or communities; importance for
per year), those groups might have all their species the life history stages of marine species; importance
described by the end of the century (Appeltans et for threatened or endangered species or habitats;
al. 2012). vulnerability, fragility or slow recovery; biological
productivity; and naturalness (CBD 2009). Geographic
Knowledge of marine biodiversity varies markedly across
areas with the best knowledge of marine biodiversity do
regional, national and, more importantly, trophic levels
not match well with areas of highest diversity, reflecting
(Costello et al. 2010). Data from the Census of Marine
both historical and present-day scientific capacity for
Life (CoML) programme is available in the ever-growing
taxonomy. Historically, highly sampled regions are often
Ocean Biogeographic Information System (OBIS)1 of
located in the Northen Hemisphere in the coastal regions
the Intergovernmental Oceanographic Commission
around developed countries. It is crucial to account for
(IOC) of the United Nations Educational, Scientific and
such sampling bias when examining the distribution of
Cultural Organization (UNESCO). The CoML data suggest
biodiversity (Tittensor et al. 2010; Gagné et al. 2020). The
that, in relative terms, China, Australia and Europe
common approaches to provide an unbiased picture of
have the best knowledge base of marine species with
marine biodiversity consist of (i) removing species with
the tropical western Atlantic, tropical eastern Pacific
not enough records to describe their full distribution and
and Canadian Arctic regions being poorly studied
(ii) applying statistical methodologies on known species
(Costello et al. 2010). Ecosystems that are particularly
records to correct for bias. The main hot spots of marine
poorly known include the deep sea, coral reefs, ice-
biodiversity have been recognized in the Indo-Pacific
covered areas and chemosynthetic habitats (Costello
Coral Triangle and a lower peak in the Caribbean (Briggs
et al. 2010). Knowledge of the identity and distribution
2007; Worm and Tittensor 2018; see Box 1). A general
of commercially exploited taxa is greater than that of
Critical Habitats and Biodiversity | 7Box 1. Estimating Global Patterns of Biodiversity Using the biodiversity data found in Reygondeau (2019) and Gagné et al. (2020), the authors developed a standardised database drawing on online websites with records of the global distribution of marine species with sufficient records to have a robust distribution. Specifically, the database was populated with species data for which at least 10 spatially informed occurrences were available. Occurrence data originated from the Ocean Biogeographic Information System (OBIS);a Intergovernmental Oceanographic Commission (IOC) of the United Nations Educational, Scientific and Cultural Organization (UNESCO);b the Global Biodiversity Information Facility (GBIF);c Fishbase;d the Coastal and Oceanic Plankton Ecology Production and Observation Database (COPEPOD);e the Jellyfish Database Initiative;f and the International Union for the Conservation of Nature (IUCN).g The full filtering methodology can be found in Gagné et al (2020). From the initial data set (more than 1 billion entries), we removed records (i) with spatial location as “not assigned” (NA) or null values, (ii) not identified to species level and (iii) replicated among databases (i.e., records with the same species name, coordinates, and sampling details). The remaining records (731,329,129 records; more than 101,000 species) were assigned full taxonomic information using the Taxize library4 in R Studio. We also used this procedure to update all species’ synonyms to valid names, as officially recognised by the Integrated Taxonomic Information System (ITIS)h and the World Register of Marine Species (WoRMS).i Next, we explored the relationship between the number of independent records (independent in time and area of sampling) and latitudinal range and thermal range for species with well-known global coverage and ecology (number of observations greater than 2,000; 1,196 species). For each known species, we randomly selected n records (number of observations from 1 to 1,000) within the global pool, and for each selected number of records (n = 1 to 1,000 records), we computed the species' latitudinal range and thermal range. The procedure was replicated 1,000 times. We then confronted the simulated latitudinal range and thermal range (1,000 simulations) to values obtained using all the information gathered on the species. We computed an interval of confidence of known range by quantifying the difference between the 1st and the 99th percentile of observed latitude coordinates and thermal value, and we assumed that the acceptable number of records to capture the latitudinal and thermal range was obtained when more than 950 randomly selected records were included within the confidence interval determined from the global pool of records. The median number of points found to capture the latitudinal range was 33+/-4 records and 41+/-3 records for thermal range. All species with less than 41 independent records were removed from further analysis. Thus, the final data set on which all analyses presented in this study are based comprises up-to-date taxonomic information and filtered occurrences for 41,625 species, for a total of 51,459,235 records representing 17 percent of all accepted marine and non-fossil species. Notes: a. OBIS, http://www.iobis.org; b. UNESCO-IOC, http://ioc-unesco.org/; c. GBIF, http://www.gbif.org; d. FishBase, http://www.fishbase.org; e. COPEPOD, http://www.st.nmfs.noaa.gov/plankton; f. Jellyfish Database Initiative, http://people.uncw.edu/condonr/JeDI/JeDI.html; g. IUCN, http://www.iucnredlist.org/technical-documents/spatial-data; h. ITIS, http://www.itis.gov; i. WORMS, http://www.marinespecies.org; j. for more information see WORMS. 8 | High Level Panel for a Sustainable Ocean Economy
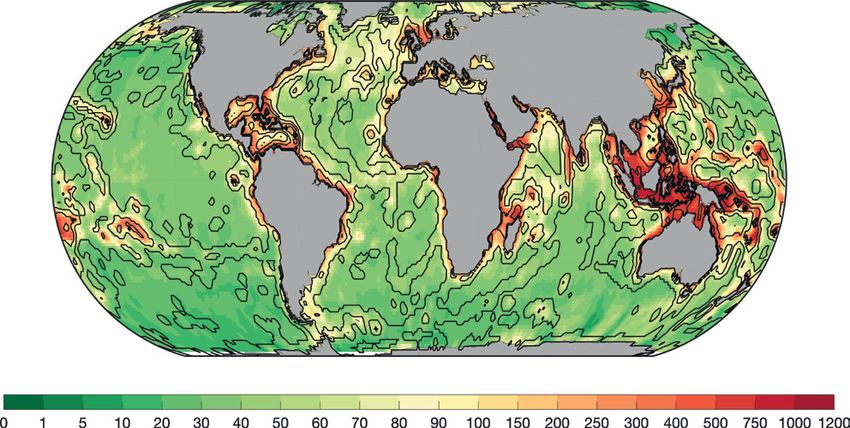
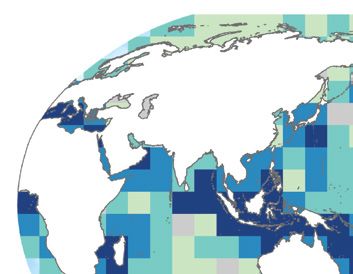
Figure 1. Global Patterns of Biodiversity and Habitat Richness

  A

                                                                    Species richness

 0               1       5   10   20   30    40     50      60     70      80     90        100          150 200 250 300 400 500 750 1000 1200

  B                                                              All species            C                                                        All species
                 80
                                                                                                   80

                 60
                                                                                                   60

                 40                                                                                40

                 20                                                                                20
                                                                                        Latitude
      Latitude

                     0                                                                             0

                 -20                                                                               -20

                 -40                                                                               -40

                 -60                                                                               -60

                 -80                                                                               -80
                                                                                                         1.2   1.4      1.6     1.8              2          2.2
                                  Species richness                                                                Mean habitat number

Notes: Map of species richness (A) is on a 100 x 100 km equal-area grid with a superimposed contour map of the number of habitats per geographical cell (see habitat
section). Latitudinal gradient of species richness (B) is of all marine species. (C) Plot of the average number of habitats versus latitude.
Source: Authors.

                                                                                                                 Critical Habitats and Biodiversity | 9
decline in biodiversity from the tropics to the polar in species biodiversity, particularly for coastal species;
latitudes has also been hypothesised, although there but there are steep longitudinal gradients in diversity,
is debate on whether some taxa show more bimodal with an increase from both east and west towards
patterns (Thorson 1952, 1957; Fischer 1960; Stehli et al. Southeast Asia, and from east to west in the tropical
1967, 1972; Clarke and Crame 1997; Williamson 1997; Roy Atlantic. The Indo-Pacific Coral Triangle, central and
et al. 1998; Tittensor et al. 2010; Edgar et al. 2017; Worm western Indian Ocean, Red Sea, South West Pacific
and Tittensor 2018; Box 1). Hypothesised explanations Islands (i.e., the Bismarck Archipelago, the Great Sea
include speciation and extinction rates over geological Reef of Fiji, New Caledonia, New Guinea, the Solomon
timescales as correlated with latitude (Crame and Clarke Islands, Vanuatu) and Southeast Asia show the highest
1997; Jablonski et al. 2006, 2013) and ecological drivers levels of species richness as indicated in previous
such as habitat area, land versus ocean area by latitude, studies (e.g., Selig et al. 2014). The Caribbean also has
sea surface temperature (Worm and Tittensor 2018), and a relatively high species richness, but not as high as
intrinsic biological traits such as larval development the aforementioned areas and parts of the northeast
mode and interspecies interactions (Roy et al. 1998; Atlantic, such as the North Sea, are as diverse. This latter
Pappalardo and Fernández 2014; Edgar et al. 2017). result may reflect the high number of species records in
the northeast Atlantic, introducing some bias into the
The distribution of biodiversity in the global ocean has
overall picture of the distribution of species richness
been described for numerous taxa, particularly in recent
given the exclusion of species with less than 41 samples.
years as more observations have been synthesised into
Also, small areas, such as tropical or subtropical islands,
large-scale patterns (Tittensor et al. 2010; Reygondeau
which are characterized by a high species diversity may
2019). While there is consistency across many groups,
be unresolved because of the spatial resolution of this
it is important to bear in mind that there remains
analysis (as for Selig et al. 2014). Individual taxonomic
a significant taxonomic bias in our understanding.
groups and different parts of the ocean (coastal, pelagic,
There are some groups that we know well (typically
deep sea) can show differing distributions. Taxa that
those species in which we have a keen commercial
follow the general pattern, albeit with some variation
interest or which are charismatic, such as vertebrates,
in relative intensity of hot spots, include reef-building
or those which form biogenic habitats such as corals
corals, coastal fishes, shallow-water ophiuroids (brittle
and seagrasses), but there are many for which we
stars), cone snails, mangroves, coastal cephalopods,
have very limited information (numerous invertebrate
lobsters and gastropods. Seagrasses have a more
groups, most deep-sea taxa, and much of the microbial
temperate-skewed distribution of richness, perhaps
biosphere). In Box 1 we present
reflecting their improved ability to tolerate cold
a new analysis of the global
Species pattern of marine biodiversity
water, relative to reef-building corals and mangroves.
Macroalgae (seaweeds such as kelp) are less well-known
which is aimed at reducing
biodiversity bias from the issue of uneven
in terms of distribution at the species level, but at the
genus level again appear to peak at more temperate
appears to peak sampling of species from
or subtropical latitudes (Gaines and Lubchenco 1982;
different parts of the ocean
Kerswell 2006; Short et al. 2007; Tittensor et al. 2010;
in the tropical Keith et al. 2014; Worm and Tittensor 2018). Coastal
At a global scale, the
Indo-Pacific, with biodiversity distribution sharks show a similar pattern to other coastal fishes, but
estimated from our study their distribution is more centered around temperate
a secondary peak appears to be relatively latitudes (Lucifora et al. 2011). Deviations from the
general patterns described include coastal marine
in the Caribbean, consistent with other studies,
resolutions and analyses mammals, whose endothermy has enabled them to
and a general (Figure 1; Tittensor et al. 2010; develop a metabolic advantage in colder waters (Pompa
Asch et al. 2018; Reygondeau et al. 2011; Grady et al. 2019). Pinnipeds (seals, sea-lions
tropical or 2019). The pattern across and walrus) show an inverse pattern with peak species
multiple taxa is primarily diversity in subpolar and polar environments (Tittensor
subtropical peak tropical to subtropical peaks et al. 2010; Pompa et al. 2011).
in richness
10 | High Level Panel for a Sustainable Ocean EconomyBiodiversity in the open ocean shows a generally to ascertain whether these patterns hold across multiple
bimodal pattern (Chaudhary et al. 2016), with pelagic taxonomic groups.
zooplankton such as foraminifera, copepods and
Biodiversity metrics, other than species richness,
euphausiids, open ocean fishes such as tuna and
that have been assessed at a global scale are few. The
billfishes, pelagic sharks, and cetaceans all showing
global distribution of functional richness in fishes
a mid-latitudinal peak in species richness, generally
appears similar to species richness, but evenness
between latitudes 30 and 40 degrees (Tittensor et
shows an opposite pattern (increasing with latitude),
al. 2010). Some differences between these taxa are
and functional diversity appears highest in the tropical
apparent, including cetaceans being widely distributed
eastern Pacific (Stuart-Smith et al. 2013). The fish
in terms of richness peaks across latitudinal bands,
food web is globally connected and suggests a higher
whereas pelagic shark hot spots tend to skew towards
vulnerability to species extinctions in the open ocean
the coast. Marine bacteria and phytoplankton diversity
compared to coastal areas (Albouy et al. 2019).
patterns remain much less well-known at a global scale,
though modelling has predicted an intermediate latitude In summary, known patterns (based on a biased sample
peak in phytoplankton, and there may be a similar of taxonomic groups) indicate that species biodiversity
gradient in bacteria, though more data and analyses appears to peak in the tropical Indo-Pacific, with a
are needed to confirm this for both groups (Worm secondary peak in the Caribbean, and a general tropical
and Tittensor 2018). Pelagic cephalopods are under- or subtropical peak in richness. Coastal species tend to
sampled, but they appear to show a similar intermediate match this pattern more closely than oceanic species,
latitudinal peak, albeit only in the Northern Hemisphere which tend to show bimodal peaks at intermediate
(Tittensor et al. 2010). Pelagic seabirds (such as albatross latitudes; yet whilst deep-sea taxa remain poorly
and petrels) show a mid-latitude peak, but only in the known, one group (brittle stars) shows a markedly
Southern Hemisphere (Davies et al. 2010). different distribution with temperate peaks close to
continental margins and in areas of high food export
Deep-sea biodiversity is far less known, and whilst
from the surface ocean.
regional patterns have been described for multiple
groups (Rex and Etter 2010), global patterns are far less
well understood at the species level (though model
2.2 Habitats
predictions of habitat suitability are available at higher Using previously published spatial data sets (Table 1), we
taxonomic levels for other taxa, such as cold-water synthesised information at the global level to produce
corals; Tittensor et al. 2009). A global pattern has been patterns of habitat diversity (see Figure 2). Because of
described only for the ophiuroids (brittle-stars), which, their ecological and socio-economic importance, and
as mentioned above, show a relatively typical shallow- the relative availability of information, we focused
water pattern of a peak in diversity at low latitudes on the following marine habitats ordered from their
on the continental shelf and slope, but they have a distance to the coast: estuaries, mangroves, saltmarshes,
markedly different distribution in deep waters (more seagrasses, coral reefs, kelp forests, shelf valley and
than 2,000 metres; Woolley et al. 2016). Deep-water canyons, cold-water corals (deep sea corals), seamounts
ophiuroids show maximum richness at temperate and guyots, trenches, hydrothermal vents and ridges
latitudes (between latitudes 30 and 50 degrees), (Table 1).
with diversity higher in regions closer to continental
The global habitat diversity index was based on the 12
margins where particulate organic material export
habitats in Table 1. First, these habitats were converted
from the surface, used as a food source by most deep-
into binary rasters at a 1-kilometre (km) resolution and
sea organisms, is higher. The deep sea is an extremely
projected into the World Robinson projection. A constant
food-limited, lightless environment, with relatively
raster was created at a resolution of 1,000 km by 1,000
shallow gradients of temperature over large distances
km. Next, these rasters were imported into R Studio. The
horizontally, and these environmental factors may shape
packages ‘raster’, ‘sp’, ‘rgdal’, and ‘tidyverse’ were used
different patterns, though more information is needed
to work with the data. Within each cell of the constant
Critical Habitats and Biodiversity | 11Table 1. Spatially Referenced Habitat Data for Coastal and Oceanic Ecosystems Included in the Habitat Diversity Analysis
HABITAT TIME SPAN DATA TYPE SOURCE
Estuaries 2003 Polygon Alder (2003)–updated by UNEP-WCMC
Mangroves 1997–2000 Polygon Giri et al. (2011)–updated by UNEP-WCMC
Saltmarsh 1973–2015 Point McOwen et al. (2017)–updated by UNEP-WCMC
Seagrasses 1934–2015 Polygon UNEP-WCMC and Short (2018)
Coral reefs 1954–2018 Polygon UNEP-WCMC et al. (2018)
Kelp forests NA Point Jorge Assis, research in progress
Shelf valley and canyons 1950–2009 Polygon Harris et al. (2014)
Cold coral reefs 1915–2014 Point Freiwald et al. (2017)–updated by UNEP-WCMC
Seamounts and guyots 1950–2009 Polygon Harris et al. (2014)
Trenches 1950–2009 Polygon Harris et al. (2014)
Beaulieu and Szafranski (2018) (InterRidge
Hydrothermal vents 1994–2019 Point
Vents Database)
Ridges 1950–2009 Polygon Harris et al. (2014)
Source: Authors.
Figure 2. Global Habitat Diversity
Habitat Diversity
NA
≤ 0.5
≤ 1.0
≤ 1.3
≤ 2.0
Land
Note: Habitat diversity calculated with Shannon-Wiener diversity index for habitats studied. Habitat diversity is displayed for 1,000-kilometre pixels.
Source: Authors.
12 | High Level Panel for a Sustainable Ocean Economyraster, the number of 1 km pixels that contained a habitat of the extent of global habitats, the progressive use of
were summed. Each of the cells of the constant raster improved large-scale mapping technologies will improve
was then viewed as a community, and the Shannon our knowledge of global habitat diversity patterns.
Index of diversity was used to calculate a diversity value
Based on the habitat diversity analysis, the Indo-Pacific
for each cell using the number of cells of each habitat as
Coral Triangle, the eastern seaboard of Australia and the
species counts. These values were then transformed into
Caribbean are hot spots for habitat diversity (Figure 2),
a raster and were uploaded into ArcGIS Pro 2.4 to create
a pattern which is similar to that for species diversity
Figure 2.
(Figure 1). The distribution of these data skews to the
Coastal areas had a much higher diversity, because of right, with fewer areas with higher diversity. The United
the occurrence of 6 of the 12 habitats considered. The States, Australia and Indonesia have the highest area of
other 6 habitats occur in deeper waters, where many analysed habitats with an average of 6.94 percent, 5.81
areas remain understudied. Although our technological percent and 5.05 percent of the global total, respectively.
capability is increasing through efforts like the global Unsurprisingly, there is a strong and significant
Seabed 2030 mapping project,3 there are still large gaps correlation with EEZ area, explaining 63 percent of the
in our understanding of deepwater habitat distribution variation. Russia, which also has a very large EEZ, does
(Rogers et al. 2015). Hence, although the data considered not seem to follow this trend—probably because much of
(Table 1) are the current best-available representation its coastline lies at polar latitudes.
Critical Habitats and Biodiversity | 133. Biodiversity Loss
To reduce bias, the assessment was restricted to taxa
3.1 Evaluating the Loss of Species with more than 10 species assessed. Whilst these taxa
The dominant pressures on the ocean are direct represent a relatively small proportion of those living in
exploitation by fisheries, followed by land and sea marine environments, they are the best studied to date;
use change (Costello et al. 2010; IPBES 2019). These therefore, they present a good (if taxonomically biased)
pressures were identified by the Global Assessment data set on which to assess the threat of extinction and
Report on Biodiversity and Ecosystem Services of the its causes across a range of marine ecosystems (Webb
Intergovernmental Science-Policy Platform on Biodiversity and Mindel 2015). Only around 3 percent of the roughly
and Ecosystem Services (IPBES) and by previous studies. 240,000 described marine species have been assessed
Of the three other main drivers considered, invasive for the Red List (Sullivan et al. 2019).
species, climate change and pollution are growing
in importance. Climate change impacts arise from 3.2 Invertebrates
ocean warming, acidification, deoxygenation, changes
There are 3,081 marine invertebrate species in
in currents and circulation, and sea level rise (IPCC
seven classes across four phyla that have had some
2019). Temperature rise is correlated with global shifts
representative assessment on the IUCN Red List (see
in distribution, generally away from the tropics but
Figure 3 and Table 2). The numbers reflect the extremely
influenced by regional and local oceanography (Cheung et
low level of assessment of marine invertebrates, a total
al. 2009; Burrows et al. 2011, 2014; Poloczanska et al. 2013,
of 2.6 percent of species across these four phyla, from
2016; Humphries et al. 2015; Molinos et al. 2016). This is
as low as 0.5 percent for Arthropoda to 7.5 percent for
driving the large-scale alteration of marine communities
Cnidaria (Table 2). Furthermore, these samples are
at middle to high latitudes (e.g., the Atlantification
biased: 839 species of hard corals (order Scleractinia)
of the Barents Sea; Fossheim et al. 2015; Oziel et al.
and 16 fire corals (genus Millepora) make up 97 percent
2017; Vihtakari et al. 2018) and may be exacerbated
of the cnidarians assessed, all from a single assessment
by geographic patterns of thermal tolerance in marine
(Carpenter et al. 2008), and the 686 Cephalopoda species
species (Stuart-Smith et al. 2015). Deoxygenation of
represent 44 percent of all marine Mollusca assessed but
the ocean has already caused a shift in the vertical and
likely less than 1 percent of all marine Mollusca. By their
horizontal distribution of pelagic species such as marlins
nature, Red List assessments tend to focus on relatively
and squid (Stramma et al. 2012; Stewart et al. 2013;
well-described taxa for both marine and terrestrial
reviewed in Breitburg et al. 2018). Climate change is also a
species (Webb and Mindel 2015).
significant driver of ecosystem damage, including on coral
reefs (Hoegh-Guldberg et al. 2007; Gattuso et al. 2015; With these caveats and the challenge of data deficiency,
Hughes et al. 2018a) and seagrass beds (Thomson et al. the proportion of species threatened ranges from
2015; Arias-Ortiz et al. 2018). a lower bound of 11 percent to an upper bound of
46 percent. The most speciose invertebrate classes
To evaluate such impacts on biodiversity, we analysed the
(Anthozoa, Gastropoda, Malacostraca) as well as the
IUCN Red List for 12 marine invertebrate and vertebrate
Cephalopoda show the lowest levels of threat. The
taxa. This list comprises analyses of the current status of
criteria used for assessment are indicative of marine
populations of species with respect to extinction risk, and
species characteristics: of the 326 species listed in
it considers population decline, negative changes in range
one of the three ‘threatened’ categories (vulnerable,
(e.g., range of occupancy and/or levels of fragmentation
endangered, and critically endangered), over 75 percent
of populations), and whether populations of a species
(254) are listed on the basis of estimated population
are very small (IUCN 2017). For marine invertebrates and
decline (Criterion A, for the past, present and/or future),
vertebrates, data were extracted from the IUCN online
14 percent were listed on the basis of small range and
Summary Statistics.4
decline (Criterion B), and 7 percent were listed for their
14 | High Level Panel for a Sustainable Ocean EconomyFigure 3. IUCN Red List Threat Categories for Marine Species
EX CR EN VU DD NT LC
Scientific Name 0% 25 50 75 100 Totals
Hydrozoa 16
Anthozoa 868
Invertebrates
Bivalvia 53
Gastropoda 831
Cephalopoda 686
Malacostraca 256
Holothuroidea 371
Chondrichthyes 1,085
Vertebrates
Actinopterygii 8,200
Reptilia 95
Aves 868
Mammalia 137
Invertebrates 3,081
Overall
Vertebrates 10,385
Note: These taxa have more than 10 species assessed. Data deficient (DD) species are depicted between the threatened categories (CR = critically
endangered; EN = endangered; VU = vulnerable) and non-threatened categories (NT = not-threatened; LC = least concern). EX = extinct in the wild.
Numbers on the right of the bars represent the total number of species assessed per taxon group.
Source: Authors.
Critical Habitats and Biodiversity | 15Figure 3. Proportion of Invertebrate Species Assessed on the IUCN Red List Compared to the Total Number of Species
Currently Described on the World Register of Marine Species
NUMBER OF SPECIES NUMBER OF SPECIES
PHYLUM % ASSESSED
DESCRIBED ASSESSED
Arthropoda 56,479 266 0.5
Cnidaria 11,744 884 7.5
Echinodermata 4,408 372 5.0
Mollusca 48,275 1,570 3.3
TOTAL 120,906 3,092 2.6
Source: WoRMS, n.d.
very small population size or range (Criterion D). Only 5 of these DD species may also be threatened but the lack
species were listed under more than one criterion. of data prohibits this assessment from being made.
This situation highlights the poor overall understanding
3.3 Vertebrates we have of many fish species, even some that are
Compared to invertebrates, marine vertebrates are heavily exploited, such as many deepwater and coral
relatively well represented in the IUCN Red List (Figure 3). reef fishes; examples include the deepwater orange
Reptiles, birds and mammals have been fully assessed, roughy (Hoplostethus atlanticus), coral reef groupers
and among marine fishes, of the approximately 18,000 and snappers (Epinephelidae and Lutjanidae), coastal
described to date, just over 50 percent have been and estuarine groups such as croakers (Sciaenidae), and
assessed (9,285 species of sharks, rays and bony fish). Of cold-water wolf-fishes (Anarhichas). The documentation
these, there are 8,200 marine actinopterygians, from 30 of these species should be a priority from the perspective
different orders, for which at least 10 species have been of population (status, distribution and trends) and use
assessed. The two fish classes included in this analysis (i.e., fisheries catches). However, for all taxa there is also
make up 79 percent of all assessed marine vertebrates a need to collect data on less well-understood aspects
and compose 70 percent of marine vertebrates listed of impacts on populations, such as from unintentional
as threatened. However, the actinopterygians have catch/bycatch or through destruction of key life history
the lowest overall proportion of threatened species areas such as spawning or nursery grounds. Such data
(4 percent) compared to other marine vertebrate taxa are collected for some fisheries but by no means all, and
(20–30 percent). The chondrichthyan extinction risk at data are often aggregated at higher taxonomic levels that
this taxonomic level of analysis is substantially higher render them useless for species-level assessments.
than for most other vertebrates, and only about one-
third of species are considered safe (Dulvy et al. 2014). 3.4 Drivers of Species Decline
We note that all species of marine turtles are currently We analysed the identified drivers of extinction risk
threatened with extinction. for species listed as critically endangered, endangered
or vulnerable for the 12 groups in Figure 3. This was
The actinopterygians are less well understood than
achieved by looking at each threatened species in the
marine reptiles, birds and mammals, and, as a result,
IUCN Red List and recording the drivers of extinction
have by far the highest proportion (and number) of
risk. Whilst many of the IUCN drivers of biodiversity
species listed as ‘data deficient’ (DD; see Figure 3); some
decline are relatively straightforward to interpret,
16 | High Level Panel for a Sustainable Ocean Economythe category ‘biological resource use’ requires some note a controversy that began in the 1990s regarding
explanation. This refers to the effects that harvesting the use of the IUCN extinction threat categories for
activities have on the extinction risk, including those commercially fished species (Rice and Legacè 2007). The
caused by targeted catch and bycatch for commercial main policy instruments used for fisheries management
and artisanal fisheries, the aquarium trade, marine curio such as the United Nations Convention on the Law
trade, shell collecting and traditional medicine. We also of the Sea (UNCLOS), the United Nations Fish Stocks
0-10 10-20 20-30 30-40 40-50 50-60 60-70 70-80 80-90 90-100
Figure 4. The Proportion of the Threatened Species of Each Taxon Affected by Different Drivers of Extinction Risk
Coastal development 100 98.2 34.5 14.7 24 68.4 24.3 51.4
Biological resource use 100 98.2 63.8 100 93.75 100 43.1 68.4 77.4 97.3
LOCAL SCALE
Pollution 100 97.8 43.1 6.25 11.7 31.7 52.6 46.9 78.4
Transportation 100 97.8 5.2 2.5 5.7 10.5 10.7 70.3
Invasive species 100 97.8 6.9 0 13.8 31.7 83.1 45.9
Climate change 100 99.1 3.4 6.25 2.5 35.9 63.2 50.8 51.4
GLOBAL SCALE
Human disturbance 100 97.8 17.2
Agri/Aquaculture 3.4 6.25
Energy/Mining 1.7
System modification 8.6
Actinopterygii
Hydroza
Anthozoa
Gastropoda
Cephalopoda
Holothuroidea
Chondrichthyes
Reptilia
Aves
Mammalia
BIOLOGICAL COMPLEXITY
Note: The percentage is reported within each cell. Threatened species out of those assessed for each taxon were: 5 out of 16 Hydrozoa; 226 out of 868 Anthozoa; 58 out
of 831 Gastropoda; 5 out of 52 Cephalopoda; 16 out of 371 Holothuroidea; 197 out of 1,085 Chondrichthyes; 334 out of 8,200 Actinopterygii; 19 out of 95 Reptilia; 177
out of 868 Aves; 37 out of 137 Mammalia. Note that drivers are drawn from the IUCN (2019) Red List. Several drivers are often listed for an individual species.
Source: IUCN Red List.
Critical Habitats and Biodiversity | 17Agreement and the Code of Conduct for Responsible activity are still being formulated by the International
Fishing (CCRF) by the Food and Agricultural Organization Seabed Authority (ISA) of the United Nations. Whether
of the United Nations (FAO) all highlight biomass these measures will be sufficient to protect vent-endemic
at maximum sustainable yield (Bmsy) as a target for species with small ranges from the effects of exploitation
sustainable fisheries management. Under a sustainable of seabed massive sulphides remains to be seen (Durden
management regime, it is possible to reduce a stock et al. 2018; Washburn et al. 2019).
size to below levels which would trigger categorising a
Across the marine vertebrate taxa assessed (except
species or stock as threatened with extinction under the
birds), the major driver of extinction risk is resource
IUCN Red List criterion of decline in population size while
use, including by both small- and large-scale fisheries
other fisheries management reference points indicate
and both targeted and incidental catch (Figure 4). This
the stock can still be exploited (Rice and Legacè 2007).
is in general agreement with the key messages of the
Whilst this has been a subject of debate (see Rice and
IPBES Global Assessment Report (2019). In particular,
Legacè 2007), more recent studies have demonstrated
larger species at higher trophic levels have been
that conservation metrics as assessed by Red List criteria
heavily reduced by exploitation whether as high-value
align well with fisheries assessments of stock status (e.g.,
target species or because they are taken incidentally
Davies and Baum 2012; Fernandes et al. 2017). Thus,
as bycatch, and many have shown a sharp decline
it can be concluded that threat categories identified
(Christensen et al. 2014; Suazo et al. 2014; Fernandes et
through the Red List criteria do not exaggerate extinction
al. 2017). However, the full impacts of incidental catch
or extirpation risk and occurrences of disagreement
are little understood for smaller fish species and many
between the two approaches are rare (Davies and Baum
invertebrates, because catch data poorly documents
2012; Fernandes et al. 2017). The IUCN has specifically
them at the species level. Despite little evidence
identified this issue in the guidelines for applying
that overexploitation or bycatch have caused global
extinction risk criteria (IUCN 2017).
extinctions, local extinctions and commercial extinctions
For invertebrates, the most significant threat for mobile (in which a species is reduced to a level at which it is no
taxa was biological resource use (Figure 4), including longer commercially viable) are much more common
overexploitation of populations through directed fishing (Dulvy et al. 2003). In addition, overexploitation has
(Holothuroidea), bycatch (Cephalopoda) or for shell dramatically reduced the abundance of numerous
collecting (Gastropoda). For sessile taxa, Anthozoa species worldwide, both large and small (McCauley et
and Hydrozoa, drivers of extinction risk are evenly al. 2015), caused large range contractions (Worm and
distributed amongst multiple drivers, reflecting a range Tittensor 2011) and impacted body mass (Ward and
of anthropogenic stressors in coastal ecosystems. The Myers 2005). At the ecosystem level, overexploitation
assessed Gastropoda are also predominantly coastal, has triggered trophic cascades (Worm and Myers
and this is reflected in the broader range of drivers of 2003; Frank et al. 2005; Daskalov et al. 2007), reduced
extinction risk in this taxon. Other contributing factors total community biomass (Ward and Myers 2005) and
to extinction risk included small geographic range (e.g., degraded habitat structure (Thrush and Dayton 2002;
cone shells; Peters et al. 2013), life history factors (e.g., Clark et al. 2016). Within species, it has also affected
Cephalopoda, Holothuroidea; Bruckner et al. 2003; genetic diversity and induced evolutionary effects
Collins and Villaneuva 2006) and high commercial value (Pinsky and Palumbi 2014; Heino et al. 2015; Kuparinen
(e.g., Holothuroidea; Purcell et al. 2014). We also note and Festa-Bianchet 2017), both of which can potentially
that the first assessment of threat from deep-sea mining reduce the capacity of populations to adapt to threats
has just occurred, with the first of 14 hydrothermal such as climate change (Blasiak et al. 2020).
vent invertebrates (a snail) being listed as ‘endangered’
A growing number of species are part of high-value
(Sigwart et al. 2019). This assessment was on the basis of
consumer markets. As with the Holothuroidea (Purcell
the small geographic range and number of populations
et al. 2014), greater rarity pushes their value even higher,
of this species, an attribute shared by other vent-
which means that they continue to be sourced even if
endemic taxa. Deep-sea mining is currently controversial,
they become more difficult to procure (Courchamp et
and regulations for environmental management of this
al. 2006; Sadovy de Mitcheson et al. 2018). Examples of
18 | High Level Panel for a Sustainable Ocean EconomyYou can also read