Credit, Income, and Inequality - Federal Reserve Bank of New ...
←
→
Page content transcription
If your browser does not render page correctly, please read the page content below
NO. 929
 JUNE 2020 Credit, Income, and
 REVISED
OCTOBER 2021
 Inequality
 Manthos Delis | Fulvia Fringuellotti | Steven Ongena
Credit, Income, and Inequality
Manthos Delis, Fulvia Fringuellotti, and Steven Ongena
Federal Reserve Bank of New York Staff Reports, no. 929
June 2020; revised October 2021
JEL classification: G21, D31, E24, O15

 Abstract

How does credit access for small business owners affect the growth and inequality of their future
income? A bank’s cutoff rule, employed in the decision to grant loans and based on applicants’
credit scores, provides us with the exogenous variation needed to answer this question. Analyzing
uniquely detailed loan application data, we find that application acceptance increases recipients’
income five years later by more than 10 percent compared to denied applicants. This effect is mostly
driven by the use of borrowed funds to undertake investments and is stronger when individuals are
more credit-constrained.

Key words: credit constraints, income, business loans, economic mobility, income inequality,
regression discontinuity design

_________________

Fringuellotti: Federal Reserve Bank of New York (email: fulvia.fringuellotti@ny.frb.org). Delis: Montpellier Business School-
Montpellier Research in Management (email: m.delis@montpellier-bs.com). Ongena: Department of Banking and Finance,
University of Zurich (email: steven.ongena@bf.uzh.ch). They authors are grateful to participants of the ASSA 2021 Virtual
Annual Meeting, the European Finance Association 2020 Annual Meeting (Helsinki), the 35th Annual Congress of the European
Economic Association (Rotterdam), the 2021 Federal Reserve “Week After” Conference on Financial Markets and Institutions,
the CEPR Endless Summer Conference on Financial Intermediation and Corporate Finance (Larnaca), the 9th MoFiR Workshop
on Banking, the CompNet/NBS Conference on “Sustainable Development, Firm Performance and Competitiveness Policies in
Small Open Economies,” and the 18th Paris Finance Meeting for many comments. They also thank seminar participants in the
Essex Business School (University of Essex), Adam Smith Business School (University of Glasgow), Durham Business School,
Federal Reserve Bank of New York, Montpellier Business School, and the Athens University of Economics and Business. For
comments, they thank Knut Are Aastveit, Christoph Basten, Tobias Berg, Rajashri Chakrabarti, Nicola Cetorelli, Jerry Coakley,
Francisco Covas, Hans Degryse, Yota Deli, Filippo Di Mauro, Robin Döttling, René Garcia, Miguel Ferreira, Pedro Gete,
Mariassunta Giannetti, Linda Goldberg, Jens Hagendorff, Iftekhar Hasan, Rajkamal Iyer, Olivier De Jonghe, Sotirios Kokas,
Alexandros Kontonikas, Michael Lamla, David Lucca, John Mondragon, Georgios Panos, Nicola Pavanini, Diane Pierret,
Maxim Pinkovskiy, Tomasz Piskorski, Matthew Plosser, Andrea Presbitero, Simon Price, Manju Puri, Enrichetta Ravina, Jean
Charles Rochet, Farzad Saidi, Asani Sarkar, Enrico Sette, László Tétényi, Wilbert van der Klaauw, and Diego A. Vera-Cossio.
Ongena acknowledges financial support from ERC ADG 2016 - GA 740272 lending. This paper was previously circulated under
the titles “Credit and Income Inequality” and “Credit and Income.”

This paper presents preliminary findings and is being distributed to economists and other interested readers solely to stimulate
discussion and elicit comments. The views expressed in this paper are those of the author(s) and do not necessarily reflect the
position of the Federal Reserve Bank of New York, the Federal Reserve Bank of Philadelphia, or the Federal Reserve System.
Any errors or omissions are the responsibility of the author(s).

To view the authors’ disclosure statements, visit https://www.newyorkfed.org/research/staff_reports/sr929.html.
I. Introduction

Over past decades, the gap between the rich and the poor has risen in most OECD countries

(OECD, 2015), posing serious concerns for economic growth and social cohesion (Galor and

Zeira, 1993; Alesina and Rodrick, 1994; Galor and Moav, 2004; Persson and Tabellini, 1994

Putnam, 2000; Stiglitz, 2012; Larsen, 2013; Piketty and Saez, 2013). The increase in income

inequality has been associated with an increase in intergenerational social immobility in many

countries, creating an upward sloping schedule commonly referred as “the Great Gatsby curve”

(Corak, 2013; Kearney and Levine, 2016; Chetty et al., 2017). A lively debate ensued on the

sources of this phenomenon and the proper measures to contain the problem. The role of finance

is at the forefront in shaping economic opportunities of households and businesses.

 This study aims to identify and quantify how banks’ credit decisions (credit acceptance or

rejection) affects applicants’ future income. The extent to which applicants that are similar in terms

of income and other traits experience significantly different incomes after the credit decision has

important implications for the real effect of credit on upward mobility and inequality.

 Theoretically, asymmetric information between lenders and borrowers affects credit

availability. Because the enforcement of loan contracts is imperfect, lenders often require

borrowers to pledge collateral. Lenders also ration credit based on an expected probability of

repayment. In general, when a credit expansion accompanies a relaxation of credit constraints, it

leads to more financing opportunities for the full spectrum of potential borrowers (including the

poor) and a possible tightening of the income distribution (Banerjee and Newman, 1993; Galor

and Zeira, 1993).

 However, credit-constrained individuals often have limited wealth, and their exclusion

from credit can hinder economic mobility and fuel persistent income inequality. More specifically,

 1
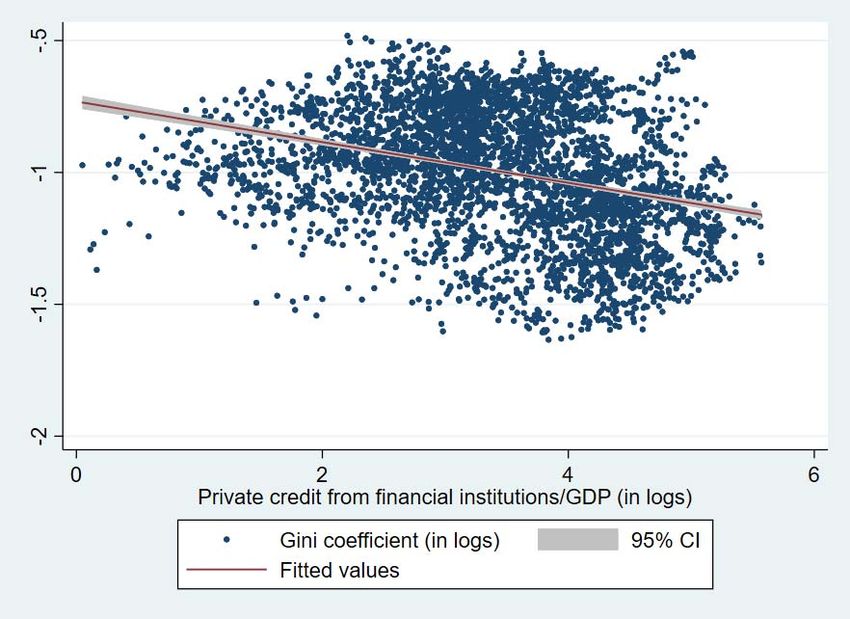
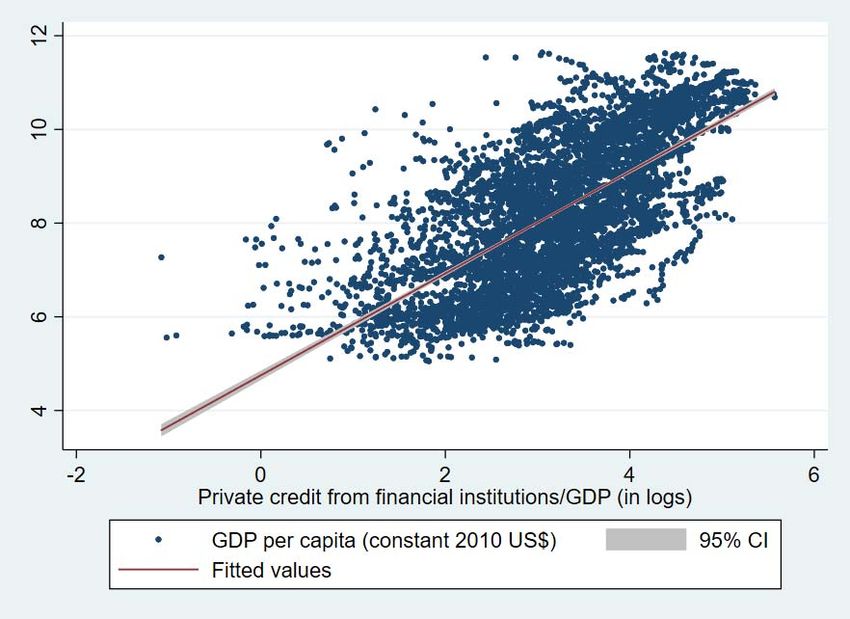
financial frictions in the form of informational asymmetry imply an important role for wealth (or

capital) endowment in liquidity creation. The endowment represents a fixed cost for credit access.

The relatively poor cannot always overcome it, irrespective of the quality of their investment ideas,

due to adverse selection and moral hazard in the loan origination process. Thus, returns on capital

can lead to high persistence in income growth only for those with substantial wealth (Piketty, 1997;

Mookherjee and Ray, 2003; Demirgüç–Kunt and Levine, 2009). Further, returns on investment

usually increase with the amount of capital wealthier individuals employ, initiating a second-order

effect due to economies of scale in larger projects (e.g., Evans and Jovanovic, 1989; Greenwood

and Jovanovic, 1990).

 A simple plot between GDP per capita (or the Gini coefficient) and the ratio of private

credit to GDP for 150 countries over 1960-2015, shows that income (income inequality) is strongly

and positively (negatively) correlated to private credit from banks and other financial institutions

over GDP (Figure 1). Of course, this relation cannot be interpreted as causal. It is confounded by

reverse causality, meaning that income (income inequality) may actually drive the availability of

credit (Kumhof and Rancière, 2010; Rajan, 2010). Omitted-variable bias is an additional concern

due to unobserved factors that are difficult to measure (e.g., the availability of new investment

ideas), which jointly affect the distribution of income and the degree of financial depth.

 [Insert Figure 1 here]

 Our study provides the first empirical analysis of how access to credit affects individuals’

income and its distribution in a developed economy, by comparing the future incomes of accepted

applicants to those of rejected applicants with approximately the same characteristics (e.g., income

and credit quality). We identify this effect using a unique data set of business loan applications to

 2

a single large European bank. This is a systemic bank subject to the ECB Single Supervisory

Mechanism and headquartered in a highly developed northern European country.

 Our focus is on loan applications from small and micro enterprises that are majority-owned

by individuals. This focus yields two major advantages for investigating our research question.

First, the income of such entrepreneurs is very much related to the performance of their business.

Second, for these applicants, the bank has information on the business owners’ incomes and

decides whether to grant the loans based on a credit score cutoff rule. Specifically, each applicant

receives a credit score at the time of the loan application. The credit score is an internal rating

constructed by the bank and it is not disclosed to the applicant. Then, credit is granted to applicants

whose credit scores are above the cutoff, and denied otherwise. We further restrict our sample to

applicants having an exclusive relationship with the bank, meaning that they do not have a lending

relationship with another regulated bank even if their loan application(s) at our bank is(are)

rejected.

 The uniqueness of our data lies in the available information on the majority owners, which

encompasses income, wealth, and the credit scores assigned by the bank, as well as other applicant

and firm characteristics.1 Importantly, the exclusivity of the relationship between the bank and the

applicant means that most applicants (accepted and rejected) reapply for loans. This in turn means

that the bank maintains information on applicants’ income after the original credit decision. We

exploit this feature of the data to build a balanced panel of 15,628 individuals who apply multiple

times over the period 2002-2016. For these applicants, the future income with respect to a given

loan application corresponds to the historical information on income collected by the bank in the

subsequent applications.

1
 In this regard the bank information we have access to comprises the set in, e.g., Artavanis et al. (2016).

 3
The availability of credit score and future applicants’ income is crucial for our

identification strategy because it allows us to exploit the cutoff rule as a source of exogenous

variation in the credit decision. Our approach builds on the idea that individuals whose credit

scores are around the cutoff are virtually the same in terms of credit quality, yielding a regression

discontinuity design (RDD). This implies identification from comparing changes in the income of

accepted and denied applicants, who prior to the bank’s credit decision have similar credit scores

(including similar incomes).

 We show that a loan origination increases the recipient’s income five years onward by 11%

compared to denied applicants, regardless of whether we control for application probability. The

economic interpretation of this finding is that marginally accepted applicants benefit from an

approximately 11% increase in their incomes compared to marginally rejected applicants, thereby

significantly affecting the distribution of income in the two groups. This finding is robust to several

re-specifications and is not affected the mix of the control variables. Further, the RDD passes the

tests for credit score manipulation, and the control variables are continuous around the cutoff.

Overall, our result suggests that bank credit decisions (loan origination or denial) affect

individuals’ income in a significant way improving upward mobility.

 This finding is not trivial. In principle, a loan origination should have a positive effect on

income only to the extent that credit is granted to applicants having good investment opportunities.

A relevant strand of literature shows that microcredit programs conducted in several developing

countries did not have a significant impact on the income of small business owners (Angelucci et

al., 2015; Attanasio et al., 2015; Augsburg et al.; 2015; Banerjee et al., 2015; Banerjee et al., 2015b;

Crépon et al., 2015; Tarozzi et al., 2015; Banerjee et al., 2018). More recently, Banerjee et al.

(2019) show that the implementation of a microfinance program in India entailed a significant

 4
increase in earnings only for the subset of incumbent entrepreneurs, but not for that of new

entrepreneurs (Banerjee et al., 2019). An important contribution of our study is that it focuses on

loan provision by a large commercial bank in a developed economy in Europe. In this context,

even highly constrained borrowers may have valuable investment projects and banks are likely to

extend credit efficiently.

 A crucial condition to properly estimate the effect of credit on income in our RDD setup is

that the control group (rejected applicants) is a proper counterfactual for the treatment group

(accepted applicants). In our main specifications, we rely on a nonparametric RDD model

characterized by a conservatively tight bandwidth, to consider only applicants whose credit score

is close enough to the cutoff, and a triangular kernel smoother, to assign higher weights to

observations at a lower distance from the cutoff. In this way, we ensure that we estimate the effect

of a loan origination on the income of business owners considering a subgroup of applicants who

are very similar across various dimensions.

 Even in this restricted subset of applicants, we may wonder, though, if rejected applicants

are fully comparable to accepted applicants. In particular, we know that applicants who are rejected

in our sample do not get credit from other regulated banks; however, we cannot exclude that they

may rely on non-bank credit after a loan denial. While a priori we know this is very unlikely given

the limited size of firms in our sample (their average total assets equal €369,500) and the marginal

role played by the shadow banking sector in providing credit to SMEs in Europe during our sample

period (Deutsche Bank, 2014; OECD, 2014; BIS and FSB, 2017), we provide further empirical

evidence suggesting that this is in fact not the case. First, no applicant in our sample is always

rejected. Applicants who experience a loan denial at some point in time are, on average, accepted

in more than half of their total credit applications. Importantly, firms of rejected applicants,

 5
considered in our baseline nonparametric RDD, do not increase their total debt financing

(measured relative to firm size in the year prior to the application) after a loan denial from our

bank. Overall, this suggests that we estimate the effect of access to credit on income of business

owners considering a subset of applicants (in the neighborhood of the credit score cutoff) that are

most similar.

 From an external validity perspective, we need to verify that applicants in our sample (i.e.,

owners of small and micro businesses that have an exclusive relationship with the bank and apply

multiple times) are not inherently different from other small business owners. A simple descriptive

exercise shows that firms in our sample experience similar rejection rates over time than the

average rejections rates faced by small and micro firms operating in the euro area as reflected in

the widely-used Survey on Access to Finance of Enterprises (SAFE) run by the European Central

Bank. In addition, leverage and profitability of firms in our sample follow a very similar pattern

than the average values of these metrics for small and micro firms located in six representative

European countries (i.e., Austria, Belgium, Denmark, France, Germany, and the Netherlands).2

 Next, we more formally address the issue of a potential selection bias relying on a two-

stage selection model as in, e.g., Heckman (1976), Dass and Massa (2011), and Jiménez et al.

(2014). We estimate the first stage on the full sample, which consists in an unbalanced panel

including all applicants to our bank, irrespective of whether they have an exclusive relationship

with the bank or not and apply a single or multiple times. This exercise leaves our findings virtually

unchanged, suggesting that applicants in our sample (i.e., firm owners who have an exclusive

relationship with the bank and apply multiple times) are similar enough to other small business

owners.

2
 To perform this analysis, we collect financial data on small and micro European firms from Bureau van Dijk Orbis.

 6
In a series of extensions to our baseline model, we examine the mechanisms behind the

effect of credit access on individual income. First, we show that a loan origination entails a stronger

increase in the income of applicants owning young firms compared to business owners of old

firms. Second, firms of accepted applicants invest more in business operations, are more likely to

repay existing bank loans, experience a higher increase in profitability, and grow at a higher rate

compared to firms of rejected applicants. Overall, these results reveal that access to credit is pivotal

for small firms to exploit good investment opportunities, expand their business, and improve

profitability.

 We, next, explore potential heterogeneities in the effect of credit access on income

depending on the private information held by the bank on the loan applicant. Specifically, we

decompose the credit score into two components attributable to hard information (e.g., observable

characteristics of the applicant) and soft information (e.g., information on the quality of the

investment opportunities of the firm), respectively. Then, we estimate the effect of a loan

origination on income for the subset of accepted and rejected applicants whose credit score is

positively affected by soft information, and the subset of accepted and rejected applicants whose

credit score is negatively affected by soft information. We show that the positive impact of credit

on income is more pronounced when the soft information held by the bank enters positively in the

calculation of the credit score. This confirms that the effect of a loan origination on income is far

from obvious, as it depends on how efficiently the bank extends credit.

 We then relate our finding to income inequality by calculating inequality measures (Gini

coefficients and Theil indices) for the loan applicants around the cutoff. We show that the Gini

and Theil indices increase (wider income distribution) for this set of individuals five years after

the credit decision compared to the year of the credit decision. Using the same inequality measures,

 7
we also document a tighter income distribution among accepted applicants and wider income

distribution among rejected applicants. These findings are consistent with the theory of a negative

nexus between finance and inequality when access to credit is improved (Greenwood and

Jovanovic, 1990).

 We further examine the heterogeneity of our findings in interesting subsamples reflecting

additional aspects of how credit affects income and its distribution more generally. We first

document stronger effects in low-income regions compared to high-income regions. This suggests

that a bank’s credit decision is even more important for an applicant’s future income in low-income

regions, thus potentially affecting income distribution within and across regions. Second, we use

the Great Recession to examine how an economic crisis and associated credit crunch affect the

credit-income relation. The identified effect is somewhat stronger during the crisis period, in line

with the premise that a credit crunch causes more harm to people with lower credit scores. We do

not find, instead, any relevant difference in the impact of credit access on income based on the

local immigration background.

 The next section provides a brief review of the literature. Section III describes the data set

and empirical identification, emphasizing the particular RDD. Section IV presents the empirical

results regarding how bank credit decisions affect loan applicants’ income; it also links these

effects to income distribution. Section V concludes the paper.

II. Literature Review

From an empirical viewpoint, our study relates to the literature on microfinance in developing

countries (Angelucci et al., 2015; Attanasio et al., 2015; Augsburg et al.; 2015; Banerjee et al.,

2015; Banerjee et al., 2015b; Crépon et al., 2015; Tarozzi et al., 2015; Banerjee et al., 2018;

 8
Banerjee et al, 2019). As highlighted above, these studies show that various microcredit programs

did not have a significant impact on individual income in developing countries, except for the

subset of well-established entrepreneurs, presumably because recipients on the extensive margin

lack good investment projects. We show that, in the context of a developed economy and a leading

financial institution, a loan origination has generally a positive and strong effect on applicants’

income and that the impact is stronger for new entrepreneurs, who are typically more credit

constrained.

 A substantial body of related literature examines how various social and economic

conditions (including race, gender, education, parents’ socioeconomic class, local neighborhood,

income inequality etc.) affect individual opportunities and, hence, economic mobility (Chetty et

al., 2014; Chetty and Hendren, 2018a, 2018b; Bell et al., 2019, Bergman et al., 2019; Chetty et al.,

forthcoming). We contribute to this literature documenting that credit provision to small businesses

is pivotal in fostering entrepreneurship and upward mobility.

 Our work also relates to the literature that looks broadly at how financial development

and/or credit constraints affect income distribution by relying on aggregate (at the country or

regional level) measures of inequality (mostly the Gini index) and financial development. This

body of literature provides mixed results. Clarke et al. (2006), Beck et al. (2010), Kappel (2010),

Hamori and Hashiguchi (2012), Delis et al. (2014), and Naceur and Zhang (2016), for example,

document a negative relation between financial development and income inequality, consistent

with the idea that a credit expansion corresponds to a relaxing of credit constraints. Denk and

Cournède (2015), Jauch and Watzka (2016), and de Haan and Sturm (2017), point instead to a

positive relation, suggesting that financial development improves access to credit only for the rich.

Kim and Lin (2011), and Brei et al. (2018) identify a non-monotonic relation depending on the

 9
degree of financial development and the financial structure of the economy. Minetti et al. (2019)

show that local banking structures affect regional income inequality. Our paper also relates to

several other studies on finance and income inequality (for a thorough review, see Demirgüç-Kunt

and Levine, 2009).3 We contribute to this literature by documenting the effect of credit origination

on income and income inequality at the individual, micro level.

 Another strand of related recent literature examines how credit constraints affect economic

and social outcomes. Looking at the Home Owners Loan Corporation “redlining” maps drawn in

the 1930s, Appel and Nickerson (2016) and Aaronson et al. (2019) show that reduced access to

credit in certain city neighborhood has negative long-lasting effects on home ownership, house

prices, and rents, while increasing racial segregation. Using data on loan applications (such as

ours), Berg (2018) documents that credit denial has stronger negative real effects on low-liquidity

firms, which need to increase cash holdings and dispose of other assets in response to a loan

rejection. A broader body of literature documents how financial constraints affect the transmission

of a credit shock due to changes in monetary policy (Gertler and Gilchrist, 1994; Kashyap and

Stein, 2000; Jiménez et al. 2012), bank conditions (Klein et al, 2002; Gan, 2007; Duchin et al.,

2010; Cingano et al., 2013; Chodorow-Reich, 2014; Balduzzi et al., 2017; Bentolila et al., 2017;

Choudhary and Jain, 2017; Acharya et al., forthcoming; Popov and Rocholl, forthcoming), or

regulation (Duflo and Banerjee, 2014). We contribute to this literature, which shows that the effect

of credit origination on the income of small business owners is stronger at the early stage of a firm,

in low-income regions and in the crisis period, all instances where entrepreneurs are more credit

constrained.

3
 Our paper also relates to Saez et al. (2012) and Moser et al. (2018), who look at the effect of payroll taxation and
credit supply, respectively, on inequality in wages.

 10
From a methodological perspective, we use uniquely granular data from a single bank as

in Iyer and Puri (2012), Berg (2018), and Delis et al. (2020). We show that our bank is similar

across different attributes to 32 other systematically important European banks (identified based

on the EBA’s guidelines). Importantly, the detailed information on loan applications that we

exploit ensures that we rigorously assess the effect of credit decisions on individual income and

inequality at the micro level.

III. Data and Empirical Identification

A. Loan Applications

We use a unique sample of loan applications to a single large European bank supervised by the

ECB Single Supervisory Mechanism and headquartered in a rich northern European country.4 The

bank provides credit to a wide array of small and large firms, as well as to consumers, households,

and the public sector both domestically and abroad. Our sample is limited to loan applications

from individuals, firms and administrations that are located in the country where the bank is

headquartered. We consider all types of commercial credit, including working capital loans,

mortgages, lines of credit, venture loans for startups, etc. Importantly, we use only loan

applications from small and micro enterprises (total assets less than €10 million as per the

European Commission’s definition) that are majority-owned by specific individuals (i.e., holding

more than 50% of equity).5 The reason why we restrict the sample to this subcategory of applicants

is twofold: first, the evolution of income of such entrepreneurs is almost uniquely tied to the

4
 The bank is considered a systematically important financial institution based on the criteria defined by the European
Banking Authority (EBA), see https://eba.europa.eu/risk-analysis-and-data/global-systemically-important-institutions
and https://eba.europa.eu/risk-analysis-and-data/other-systemically-important-institutions-o-siis-.
5
 Using the European Commission’s definition, a small enterprise has total assets less than €10 million; a micro
enterprise less than €2 million in assets.

 11
performance of their business; second, for these applicants, the bank has information that is

essential to address our research question. Specifically, we have information on whether the loan

is originated or denied, as well as loan characteristics, firm characteristics, and applicant

characteristics. Loan characteristics include the requested amount and maturity, as well as other

features such as collateral, covenants, and performance-pricing provisions if the loan is originated.

Firm characteristics encompass several accounting variables, such as assets and sales, profits,

leverage, as well as the firm’s region and industry.

 What makes this data unique is information on the applicant (the firm’s majority owner).

The applicant characteristics include income (total income reported by the individual, including

wages, “dividends” from the firm, and any other source of income), assets (wealth), gender,

education, relationship with the bank (an exclusive relationship or not), and the credit score

assigned by the bank. We identify applicants having an exclusive relationship with the bank as

those who do not have a lending relationship with another regulated commercial, even if their

application(s) to our bank is (are) rejected.6 The exclusivity of the relationship consists in an

objective fact and does not stem from any legal agreement between the firm and the bank. For two

reasons, we focus on loan applications from individuals who have exclusive relationships with the

bank (as per our definition) and apply multiple times during the sample period. First, the bank has

income information for these applicants for several years before and after the loan decision.7

Second, these applicants are generally unable to obtain credit from another bank, especially if their

application is denied; moreover, they cannot access capital markets due the firm’s small size. In

6
 Our bank has information on any credit relationship in place between a firm and another supervised bank (by the
EBA or the country’s regulatory and supervisor authority) from both the firm and the national credit register,
irrespective of whether the loan application to our bank is accepted or rejected.
7
 To understand how we exploit this feature to build our dataset, consider the case of a business owner who lodges
two loan applications during our sample period. Then, the future income of the entrepreneur with respect to the time
of the first application corresponds to the information on his/her past income collected by the bank at the time of the
second application.

 12
principle, a rejected applicant may seek credit in the shadow-banking sector which is largely

unregulated. However, ceteris paribus, non-banks are likely to charge higher interest rates and,

generally, worse credit terms than banks given their higher cost of capital (Chen et al., 2017).8 In

addition, a number of reports by Deutsche Bank (2014), OECD (2014), and BIS and FSB (2017)

suggest that, in Europe during our sample period, SMEs had very limited access to credit outside

of the banking system. Consistently with that, in the subsection presenting our empirical findings,

we show evidence that denied applicants (having an exclusive relationship with our bank) do not

get credit elsewhere after a rejection. In general, it is fairly common for small and micro firms to

have an exclusive relationship with a bank. In our full sample this is the case for 65% of firms,

which is close to the value of 71% documented by Berger at al. (2011) for SMEs in three large

European countries (i.e., Germany, Italy and UK). Overall, these characteristics of our sample

allow us to identify the effect of the bank’s credit decision on applicants’ income.

 From a methodological perspective, a crucial piece of information that allows us to

investigate our research question is the credit score assigned by the bank. Each applicant is given

a credit score at the time of the application, and this score is the decisive factor in loan origination.

The credit score consists in a private rating constructed by the bank, which is not accessible to

anyone including the applicant. The bank generates the credit score based on both hard information

(observable applicant and firm characteristics) and soft information (e.g., the bank’s perception of

the applicant, the quality of the investment opportunities of the firm, the strength of the firm-bank

relationship). For comparative purposes, we normalize the credit score to be around the cutoff

value of 0. The bank originates the loan if the credit score is higher than 0 and denies the loan

otherwise. For very few applications (72 cases), this criterion does not hold. These exceptions are

8
 Non-banks do not benefit from deposit insurance and implicit government guarantees.

 13
possibly due to data-entry mistakes and thus we disregard them in our analysis. We explicitly

define the credit score along with all the variables used in our empirical analysis in Table 1 and

provide summary statistics in Table 2.

 [Insert Tables 1 & 2 about here]

 Using this information, we generate a balanced panel data set, where applicants are the

cross-sectional unit of the panel and years 2002-2016 are the time unit. For each applicant, we

know his/her income over the full sample period, irrespective of whether they apply for credit in a

given year. This sample also includes information for the rest of the applicant and firm

characteristics defined in Table 1. Our stringent cleansing process yields a panel of 234,420

observations corresponding to 15,628 individual applicants over 2002-2016.9 In this panel, there

are 61,863 loan applications (the sample used in the majority of our empirical tests).

 All individuals reapply for loans within a four-year period and the average time between

two consecutive applications is 2.9 years. Applicants apply on average around four times during

our sample period and are either always accepted (11,956 applicants), or sometimes accepted and

sometimes rejected (3,672 applicants); no business owner is always rejected. The bank accepts

87% of loan applications and rejects 13%. Applicants that experience at least one loan denial make

one average 4.4 loan applications and are accepted 52% of the times. This suggests that accepted

and rejected applicants are similar enough and this is especially true for individuals whose credit

score is in the neighborhood of the cutoff.

 We report summary statistics for the variables used in our empirical analysis in Table 2.

The mean future income (respectively, in one year, three years, and five years) tends to rise over

9
 The actual number of loan applications from small and micro enterprises, including business-loan applications from
individuals who have non-exclusive relationships with the bank or never reapply for loans, as well as those from
applicants for which we lack dynamic income information, is 513,525.

 14
time for loan applicants. After its transformation, the mean credit score is positive and equal to

approximately 0.1. Average loan duration is roughly three years. Summary statistics for our control

variables show that the mean applicant has tertiary education and total wealth of €187,200 (see

Table 2). The mean firm size (total assets) is €369,500, and mean firm leverage is 20.7%, which

is comparable to European averages (e.g., Carvalho, 2017). Overall, the summary statistics show

that our data set is consistent with the mean value of our variables at the European level.

 Using data from a single entity is not an unusual practice when the research question is

detailed (Adams et al., 2009; Iyer and Puri, 2012; Berg, 2018; Delis et al., 2020). In our case, we

take advantage of granular application-level data for one bank to document how the decision to

grant or deny credit affects individuals’ income. Also, the bank that we look at is a major financial

institution operating on a national scale. This ensures that the bank is representative enough for

the banking system, so that we can reasonably generalize the results of our study.

 We, nonetheless, perform three formal checks to verify that the bank and firms in our

sample (i.e., small and micro businesses that have an exclusive relationship with the bank and

apply at multiple times in our sample period) exhibit similar characteristics to other systemic

European banks and other small European firms, respectively.

 We start by comparing annual averages of key attributes of 32 systematically important

European banks (identified as per EBA’s guidelines) with the corresponding characteristics of our

bank. To this end, we collect the data on banks’ balance sheet from Compustat. We focus on three

metrics: the liquidity ratio (i.e., the ratio of cash plus short-term securities to total assets), the

market-to-book ratio, and the (before tax) returns on assets (ROA). In Figures 2a to 2c, we show

scatterplots and a linear fit of our bank’s annual values (y-axes) against the corresponding averages

for the set of systemic banks (x-axes). The coefficients of the three linear regressions are all

 15
positive and highly statistically significant, suggesting that liquidity, market value and profitability

conditions of our bank are similar to the average counterparts of other European systemic banks.

 [Insert Figure 2 about here]

 We next use data from the Survey on Access to Finance of Enterprises (SAFE) to compare

access to credit of small and micro firms operating in the euro area with that of firms in our

sample.10 Figure 3 shows the time series of the average rejection rate in the euro area along with

the rejection rate in our sample of 61,863 applications during 2002-2016. The two series follow a

similar path over time, with the rejection rate of our bank being somewhat higher than the euro

area’s average in 2010-2014 and slightly lower from 2015 onward.

 [Insert Figure 3 about here]

 As a last exercise, we present a comparative analysis of leverage and profitability of the

15,628 firms in our sample versus small and micro firms located in six representative European

countries (i.e., Austria, Belgium, Denmark, France, Germany, and the Netherlands). We collect

balance sheet data on small businesses operating in these countries from Bureau van Dijk Orbis.

Figures 4a and 4b show that the average leverage ratio and profitability of the two groups are

closely aligned during the whole sample period, although firms in our sample exhibit a slightly

lower leverage and higher ROA.11 Such small differences are probably explained by the fact that

our sample country is characterized by a high per-capita income and was less affected from the

economic downturn of 2010-2014 compared to other European countries. We conclude that small

firms in our sample are very similar, across different dimensions, to small firms located in

representative European countries.

10
 Both groups of firms comply with the requirements set by European Commission to define a firm as a small or
micro business.
11
 Additional plots comparing other firm characteristics are available upon request.

 16
[Insert Figure 4 about here]

B. Empirical Identification

Three important features of our data set are the availability of information about (i) originated and

denied loans, (ii) the exclusivity of the relationship between loan applicants and banks (the

applicant cannot obtain credit from another regulated commercial bank if his/her application is

rejected),12 and (iii) applicants’ income before and after the loan application. Based on these

features, a standard identification method would compare the incomes of approved applicants (the

treated group) with the incomes of rejected applicants (the control group) before and after the loan

decision. Unfortunately, the treatment here is endogenous to several factors behind the bank’s

decision to grant the loan, making a differences-in-differences exercise far from optimal.

 The fourth and most important feature of our data set for identification purposes is the

availability of information on credit scores and the perfect correlation of the scores above the cutoff

with loan origination.13 This implies a sharp discontinuity in treatment as a function of credit

score.14 Therefore, we rely on a sharp RDD using credit score as the assignment (also referred to

as “the running” or “the forcing”) variable (Imbens and Lemieux, 2008; Lee and Lemieux, 2010).

 Assuming that the relation between access to credit and income is linear, the simplest form

of the RDD is:

 , ̅ . (1)

12
 The bank has this information from the applicants, meaning that no other bank is able/willing to finance the same
project. This feature of our sample implies that the loan applicants do not leave the sample; therefore, we do not have
such attrition bias.
13
 This is after dropping the 72 exceptions due to data entry errors.
14
 Berg (2018) exploits a similar type of discontinuity to investigate how loan rejection affects firms’ cash holdings.

 17
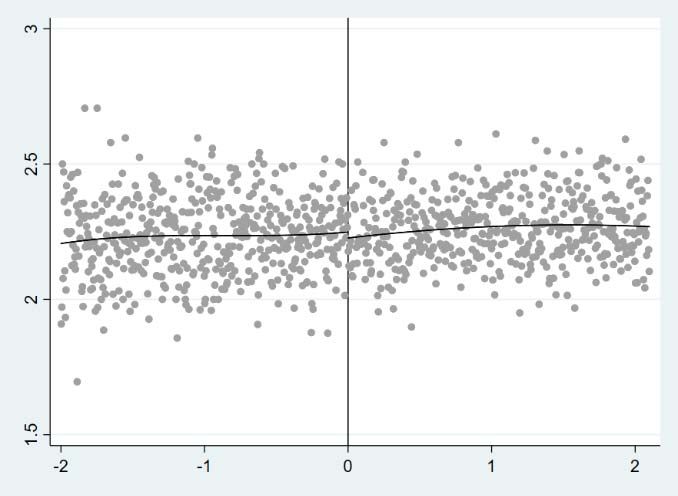
In equation 1, y is applicant’s i income in the nth year ahead of the loan application, which takes

place in year t. D is a binary variable that equals 1 if the credit score is above the cutoff and zero

otherwise, which determines whether the loan is granted. Thus, a1 is the treatment effect. Also,

 ̅ is the distance between the cutoff and applicant i’s credit score given at the time of the

loan application.

 The distribution of applicant’s income depicted in Figure 5 exhibits a regular shape. The

main assumption for the validity of this model, similar to any other RDD, is that applicants cannot

precisely manipulate their credit scores and loan officers do not artificially adjust the credit scores

to move applicants on either side of the cutoff. If applicants, even while having some influence,

are unable to manipulate their credit scores precisely and loan officers do not perform ad hoc

adjustments of the credit scores, the variation in treatment around the cutoff provides a randomized

experiment. The lack of precise manipulation is the most compelling requirement of the RDD vis-

à-vis other identification methods, such as differences-in-differences or instrumental variables

(Lee and Lemieux, 2010).

 [Insert Figure 5 about here]

 Theoretically, precise manipulation by applicants is unlikely, as loans officers’ prudent

behavior should prevent applicants from having exact information on their credit scores. Although

credit underwriting has increasingly become an automated process in the past decades thanks to

digitalization (Straka, 2000; Frame et al., 2001; Evans and Schmalensee, 2005), we cannot fully

rule out that loan officers manipulate the credit score of their applicants fostering an approval or a

rejection. We demonstrate, through a specific statistical test, that credit score manipulation either

by applicants or loan officers is absent in our setup. Specifically, we test for manipulation of the

assignment variable around the cutoff. Self-selection or nonrandom sorting of applicants would

 18
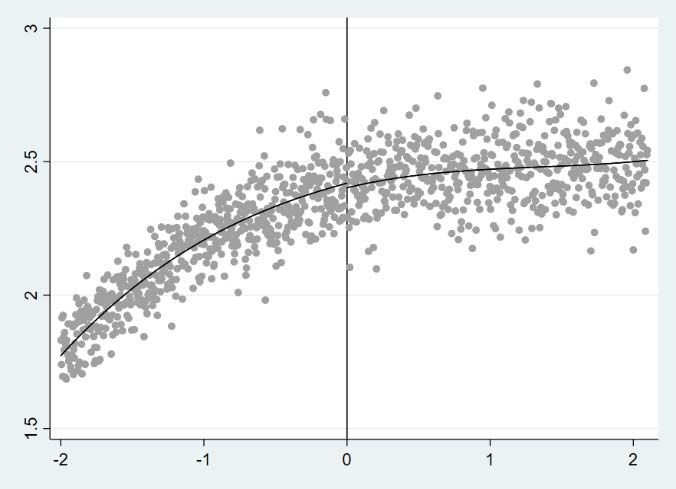
entail a discontinuous change in the distribution of the credit score. Figure 5 shows that the

probability density of the credit score does not jump around the cutoff. In line with the graphical

evidence, the formal test of Cattaneo et al. (2018) confirms there is no statistical evidence of

manipulation of the forcing variable (see Table 3 and Figure 6). As we show in Section 4.F, we do

not find evidence of manipulation of the credit scores even when we focus on the subsample of

applicants for which the soft information held by the bank enters positively (or negatively) in the

calculation of the credit score (Table 11). This further corroborates that loan officers do not

artificially adjust the credit scores of applicants around the cutoff.

 [Insert Table 3 & Figure 6 about here]

IV. Empirical Results

A. Graphical Evidence

We begin our RDD analysis with a graphical inspection of the relation between access to credit

and income. Figure 7 shows applicants’ income five years after the loan decision against the credit

score. There is a clear upward shift in applicants’ income around the cutoff. This indicates that the

treatment (loan origination) entails a sharp discontinuity in the outcome variable (income),

corroborating our methodological approach.

 [Insert Figure 7 about here]

 Also, the plot shows a linear relation between applicants’ income and the credit score on

both sides of the cutoff. The relation looks slightly increasing below the cutoff and almost flat

above. This evidence suggests that the econometric analysis should focus on a linear model

allowing for a different slope on each side of the cutoff. More importantly, the upward

discontinuity in applicants’ income at the cutoff, as well as the flat relationship between income

 19
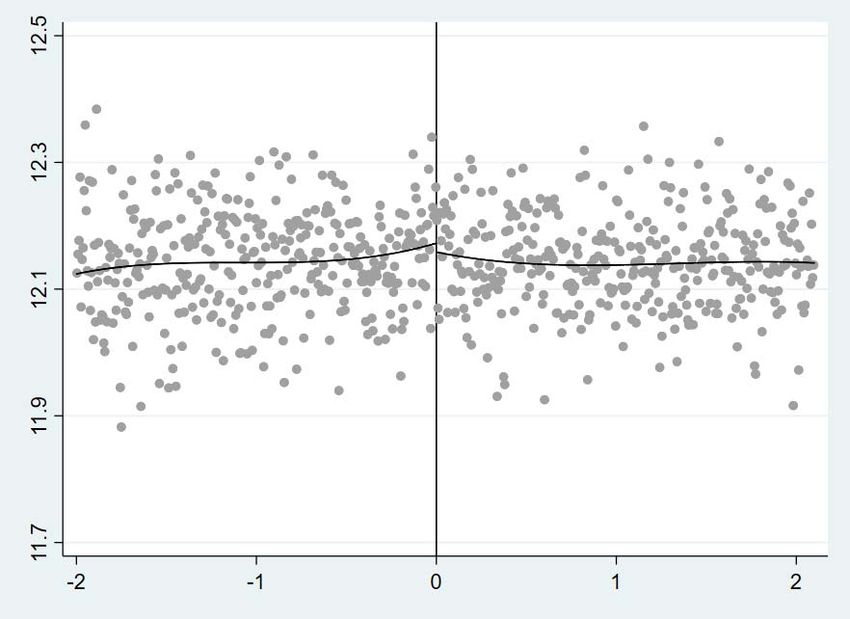
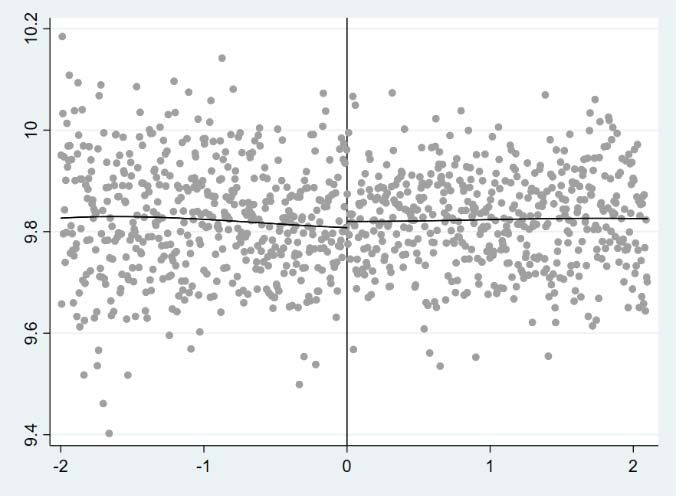
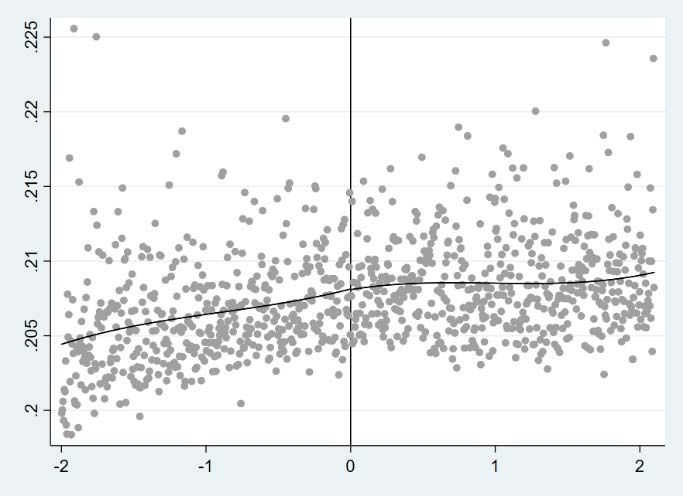
and credit score above the cutoff, reveal that access to credit plays a preeminent role in shaping

the future income path of small business owners.

B. Parametric Model

We first consider estimating equation (1) with a parametric model (OLS). We use clustered

standard errors at the individual level to ensure robust inference. To allow for a differential effect

on the two sides of the cutoff, we include the interaction ̅ , so that equation (1)

becomes:

 , ̅ ̅ . (2)

The coefficient of interest is , which is the coefficient of the acceptance dummy Granted, which

captures the treatment effect.

 Table 4 reports the results. Specifications 1-3 use as a dependent variable the applicants’

income one year ahead, three years ahead, and five years ahead of the loan application. We find a

positive and statistically significant coefficient on Granted in all three specifications. The

magnitude of this coefficient suggests a 5.1% increase in the incomes of approved applicants one

year after loan origination (column 1), a 7.3% increase three years after (column 2), and a 7%

increase five years ahead (column 3). Also, the coefficient of the interaction between Granted and

Credit Score is negative and statistically significant three and five years after loan origination,

confirming our prior differential effect on the two sides of the cutoff.

 [Insert Table 4 about here]

 In specifications 4-6, we introduce the set of loan, firm, and applicant controls variables.

Loan controls include the requested amount (Loan amount) and loan maturity (Maturity). Firm

variables include total assets (Firm size) and leverage ratio (Leverage). Applicant controls include

 20
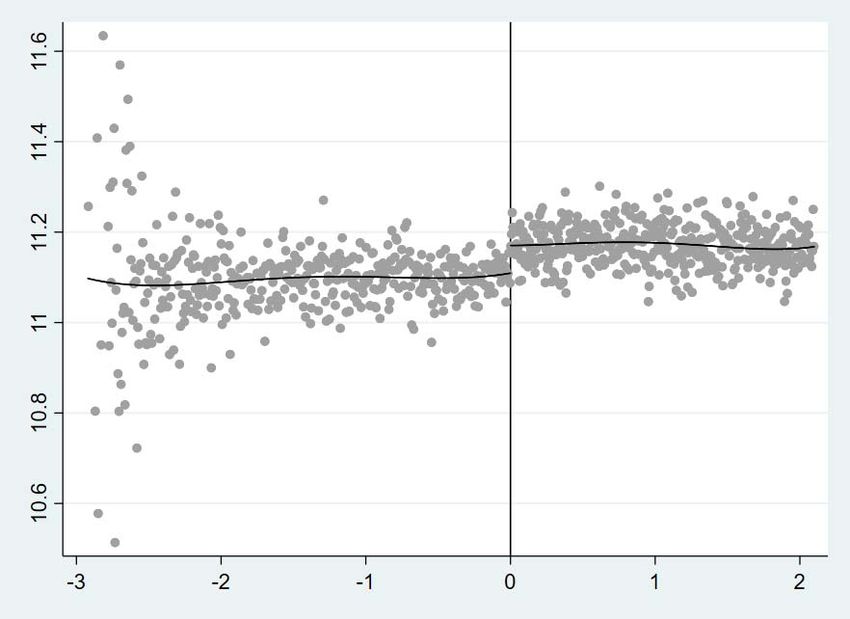
degree of education (Education) and income one year before the application (Income t-1). We

provide thorough definitions for these variables in Table 1.

 The results are similar to those in the first three columns and, if anything, slightly

strengthen. Being approved for a loan implies an increase in applicant income by 5.4% one year

after of the loan decision (column 4), by 7.5% three years after (column 5), and by 7.2% five years

after (column 6). Looking at the covariates, most are not statistically significant. This is not

surprising, as many of them concur in determining the credit score. Nevertheless, we find a positive

and statistically significant coefficient for Income t-1, suggesting persistence in the outcome

variable. Leverage has a positive and significant coefficient, but it is largely collinear with the

credit score.15 We also find a positive coefficient on Maturity, although it is significant only in

column 4. These results remain unchanged if we add industry, loan type, and year fixed effects to

our specifications (results in Table A1 of the Appendix).

 On the use of control variables, a key assumption of the RDD is that the expectation of the

outcome variable conditional on the assignment variable is continuous. This requires that the

relation between the covariates and the credit score is smooth around the cutoff. A graphical

inspection confirms that this condition is fulfilled (Figure 8). This means that our baseline model

in equation (2) is well specified, and using the controls will not significantly affect our main result.

 [Insert Figure 8 about here]

15
 Our analysis focuses on firms able to raise external funds only by borrowing from the bank under study. In our
specifications, we control for the leverage ratio observed in the year of the loan decision. The cutoff rule implies that
applicants whose credit scores are above the cutoff are approved for a loan. As a consequence, leverage ratios increase
in the year of the loan origination (see Figure 5). This explains why our covariate is to a large extent collinear with
the credit score.

 21
C. Local Linear Regression

The linear model identifies the treatment effect placing equal weight on all information available

in the sample. This suggests a potential bias, as it treats observations far from the cutoff in the

same way as observations close to the cutoff, and the treatment effect is estimated using two groups

of individuals that might not be comparable. To handle this issue, we use a local linear regression

(for a general description, see Imbens and Lemieux, 2008, and Calonico et al., 2014). The main

advantage of this approach is the assignment of higher weights as we move closer to the cutoff

(using a kernel smoother). We determine the optimal bandwidth using the approach in Calonico et

al. (2014), and for efficient estimation we mainly base our inference on the local-quadratic bias-

correction in Calonico et al. (2018).

 Table 5 reports the estimates of the average treatment effect for our set of local linear

regressions.16 For each specification, we report the conventional RD estimates with conventional

variance estimator (Conventional), the bias-corrected RD estimates with conventional variance

estimator (Bias-corrected), and the bias-corrected RD estimates with robust variance estimator

(Robust).

 Regardless of whether we include (in columns 1-3) or do not include (in columns 4-6) the

set of controls, we find that granting a loan has a positive and significant effect on an applicant’s

future income. Relying on Robust estimates for inference, we find an income increase of

approximately 6% among approved applicants one year or three years after of the loan origination,

and an increase of approximately 11% five years ahead.

16
 The average treatment effect here is the counterpart of the coefficient of the acceptance dummy in equation (2). It
is nonparametrically identified as lim | lim | .
 → ̅ → ̅

 22
Overall, the estimates of the treatment effect are comparable to those in the corresponding

regressions of Table 4. Given the small discrepancy in the results between the parametric and

nonparametric RDD and the advantages of the nonparametric RDD highlighted in the literature,

we consider this method as our benchmark and we use it in most of our sensitivity tests (unless not

applicable).

 [Insert Table 5 about here]

 Despite the advantage of focusing on observations close to the cutoff, the nonparametric

approach does not necessarily represent the ideal functional form of the RDD. In light of that, Lee

and Lemieux (2010) suggest relying on different bandwidth-selection methods to test if the results

are stable across different specifications. Table A2 of the Appendix shows that the results remain

unchanged when using the mean-squared error (MSE) or the common coverage error (CER)

bandwidth selector. Also, Figure 9 shows that the significance of Conventional in model (3) is

robust to different windows around the cutoff where (small-sample) inference is conducted.17

 [Insert Figure 9 about here]

 While relying on the nonparametric model allows us to restrict our attention to accepted

and rejected applicants that are virtually the same in terms of credit quality (as captured by the

credit score), we may still wonder if these two groups are perfectly comparable. Specifically, we

know that applicants who are rejected are not getting credit elsewhere in the banking system, but

we cannot exclude that they may turn to non-bank financing. If this is the case, the estimated

treatment effect would carry a bias, as the control group (rejected applicants) would not be a proper

counterfactual for the treatment group (accepted applicants). If anything, the bias would be against

our results, i.e., leading to an underestimation of the effect of credit on income.

17
 Inference in Table 5 is based, instead, on large-sample approximations (Calonico et al., 2014).

 23
A series of facts suggests that rejected applicants are unlikely to seek credit outside of the

banking system. First, no applicant in our sample is always rejected, meaning that applicants who

experience a loan denial at some point in time get at least another application accepted during the

sample period. On average, more than half of credit applications from these applicants are

approved in our sample. Second, given the very limited size (average total assets equals is

€369,500), firms in our sample are unable to access capital markets. While other forms of non-

bank credit might be available to small and micro firms (e.g., fintech lending), Deutsche Bank

(2014), OECD (2014), and BIS and FSB (2017) suggest that reliance of SMEs on funding from

the shadow banking sector was very limited during our sample period in Europe. Lastly, non-banks

are likely to charge higher interest rates than banks, everything else equal, given their higher cost

of capital (Chen et al., 2017).

 We, nonetheless, assess in a more explicit way if business owners are able to obtain credit

outside of the banking system after a loan rejection from our bank. Table 6 reports values for total

firm debt, before and after the loan application, measured relative to total assets in the year prior

to the loan application for the subsets of accepted and rejected applicants considered in the 17,917

“effective observations” around the cutoff where we estimate the nonparametric RDD of Table 5.

While firms of accepted applicants experience a moderate increase in total debt right after a loan

origination, debt financing of firms or rejected applicants does not increase after a loan denial and,

if anything, slightly declines. We conclude that rejected applicants do not obtain non-bank credit

after a loan denial from our bank.

 [Insert Table 6 about here]

 In specifications 4-6 of Table 5 we estimate the effect of credit on income controlling for

a wide set of loan, firm, and applicant characteristics, including the requested loan amount and

 24
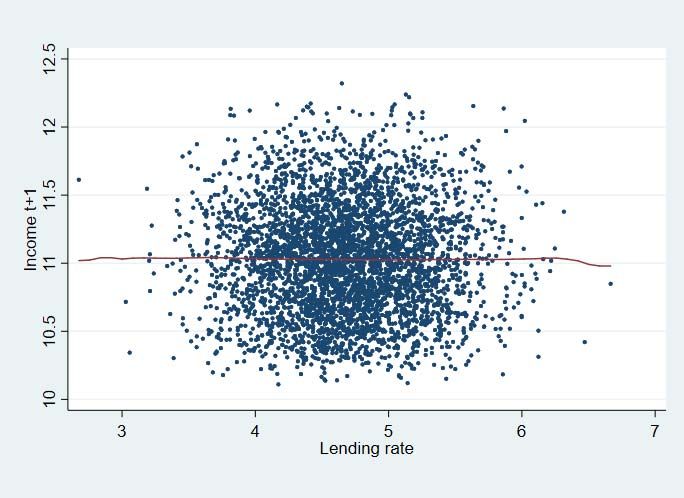
maturity. The lending rate applied on a new loan determines the future stream of payments and,

hence, may affect the recipient’s future income. Specifically, we would expect that the higher is

the credit score of a borrower, the lower is the interest rate applied. Figure 10 shows that the income

of accepted applicants considered in the nonparametric RDD one year after the loan decision is a

flat function of the lending rate. This means that the interest rate charged on newly granted loans

does not influence the effect of loan acceptance on individual income.

 [Insert Figure 10 about here]

 Overall, our analysis shows that credit decisions have real effects on income. Consider two

applicants: the first has a credit score slightly above the cutoff; the second has a credit score slightly

below the cutoff. At the time of the loan application, the credit quality of these two individuals is

virtually the same. However, the cutoff rule implies that credit is granted only to the former. The

increase in income experienced after loan origination documents a causal link between access to

credit and income. This link is not obvious. As documented in various studies on microfinance in

developing countries, access to credit may have no impact on individual income (Angelucci et al.,

2015; Attanasio et al., 2015; Augsburg et al.; 2015; Banerjee et al., 2015; Banerjee et al., 2015b;

Crépon et al., 2015; Tarozzi et al., 2015; Banerjee et al., 2018). Intuitively, a loan origination

improves individual income only if credit is granted to applicants having good investment

opportunities. This is likely to be the case for our bank, which is a major financial institution in

Europe. Therefore, our findings reveal that access to credit has a positive effect on individual

income when lending decisions are taken efficiently. Also, the magnitude of this effect is

substantial, suggesting that credit provision to small businesses impacts significantly the firm

owner’s economic opportunities and upward mobility.

 25
The large increase in income experienced by accepted applicants vis-à-vis rejected

applicants with similar attributes might show that the bank overlooks good investment

opportunities. As mentioned before, the percent of denied applications of this bank is in line with

the European averages reported in the Survey on access to finance for enterprises (SAFE)

published by the European Commission and the ECB. This suggests that the bank may limit its

lending capacity as a result of an optimization process. However, further looking into that

optimization process is beyond the scope of this paper and we leave it for further research.

D. Robustness Tests

In principle, wealthier individuals should be able to maintain higher incomes over time through

higher investment. Accordingly, part of the macro inequality literature highlights the role of initial

GDP per capita and suggests controlling for some sort of historical (or initial) wealth conditions

when estimating models of inequality (e.g., Li et al., 1998). To this end, we use individual wealth

in the first year before the loan application in which this information is available (Initial wealth;

see Table 1).

 As with the rest of the control variables, we show in Figure A1 that Initial wealth is

continuous around the cutoff. Of course, adding this variable to our covariates entails a substantial

drop in the number of observations in the sample. This is the reason we leave this exercise as a

robustness test. The nonparametric results in Table 7 show that including initial wealth does not

yield significantly different results. If anything, the treatment effect is slightly stronger, with the

only exception of the three-year horizon from the loan decision. We obtain similar patterns when

using the parametric RDD (Table A3 of the Appendix).

 [Insert Table 7 about here]

 26
So far, our framework considers a balanced panel of individuals with an exclusive

relationship with the bank. These individuals are firm owners who do not have a lending

relationship with another regulated bank at the time of the loan application, and who apply multiple

times during the sample period so that we have information on their income for several years

before and after the loan decision. While working on such balanced panel limits concerns of

attrition bias and allows us to estimate the treatment effect focusing on individuals for which we

have comprehensive information, there is a downside related to the potential introduction of a

selection bias. This is because we overlook one-time applicants who may drop out of the sample

because they turn to another lender or decide to stop operating their business (for example after a

denied application). We also discard firm owners who have credit relationships with multiple

banks. If these applicants differ in a substantial way from individuals having a long-lasting

exclusive relationship with the bank, we may either underestimate or overestimate the effect of

credit of income. The analysis presented in Section 3.A shows that small firms in our sample (i.e.,

firms of applicants having an exclusive relationship with the bank and applying multiple times

during our sample period) are on average very similar to other small firms operating in the euro

area. While this may entail similarities also between business owners inside and outside of our

sample, we need to address the issue of a potential selection bias in a formal way.

 To this end, we use a parametric two-stage selection model as in, e.g., Heckman (1976),

Dass and Massa (2011), and Jiménez et al. (2014). In the first stage, we estimate the probability

that a bank customer has a long-lasting exclusive relationship with the bank and applies for a loan

in a specific year (probit model). We run this regression on the full sample, which consists in an

unbalanced panel including all applicants, irrespective of whether they have an exclusive

relationship with the bank or not and apply a single or multiple times. The right-hand side variables

 27
You can also read