Creating Prosperity from Chaos: May 11, 2021 - Canadian Agri-Food Policy ...
←
→
Page content transcription
If your browser does not render page correctly, please read the page content below
May 11, 2021

Creating Prosperity
from Chaos:
A CAPI PRESENTATION AT THE BIG SOLUTIONS FORUM TRUSTED OPINION LEADERS PRE-DIALOGUE
1. Introduction
CAPI’s program of research launched a year and             The Creating Prosperity from Chaos research program
a half ago, Creating Prosperity from Chaos, was            culminated in a Pre-dialogue event with trusted
originally developed in response to the increasing         opinion leaders on May 11, 2021, which focused on
disruptions in global trade and the collateral             developing policy options, strategies and a path
damage to economic outcomes, sustainability of             to sustainable prosperity. At this event, CAPI used
agri-food systems, natural systems and food security.      the knowledge accumulated through its research,
The COVID-19 pandemic further highlighted the              webinars and dialogues over the past year with
imperative to evaluate the paths to sustainable and        thought leaders from agri-food supply chains, policy
resilient agri-food systems and a rules-based trading      makers, issue experts, NGOs, regulators and law
environment concurrently with global food security         makers to discuss options for Canadian agri-food
and socio-economic well-being. The pandemic has            trade, innovation, investment and regulatory policies
made it clear that the key existential issue of the 21st   that can lead to potential strategies and solutions. The
century is implementing a “One Health” approach            pre-dialogue was centred around a presentation made
that considers interactions between human, animal,         by Ted Bilyea, Chief Strategy Officer, that presented
and environmental health to produce better socio-          the key findings from the past year’s program of work.
economic outcomes. This is because socio-economic          The presentation is summarized below.
health and security depends on human, plant, animal,
and environmental health.

                                                                                                                      1
2. Background                                               by encouraging tropical deforestation. We also know
                                                            how Climate change and environmental degradation
                                                            have had a negative impact on global productive
2.1 Presentation on Creating                                capacity, which combined with the pandemic and
Prosperity from Chaos in a Post                             geopolitical disruption in trade have increased global
Pandemic World                                              food insecurity. Therefore, it is essential to use a One
                                                            Health approach as we seek to understand the forces
The presentation began with the purpose of the Big          affecting strategy and policy at the nexus of TRADE-
Solutions Forum which was to develop strategies and
                                                            CLIMATE CHANGE-FOOD SECURITY.
policy options to Create Prosperity from Chaos. The
BSF provided a venue to discuss the challenges and
opportunities facing the Canadian agri-food sector
which would lead to sustainable food production,            4. The three A’s of food
global food security and climate change solutions
while remaining competitive. The presentation
                                                            security connecting forces
brought together key learnings from CAPI’s four-            of change
pronged policy research program and dialogues,
which was centred around:                                   Food insecurity, both in Canada and at the global
                                                            level were highlighted during the pandemic and
Prosperity through…                                         are expected to become even more of an issue as
                                                            climate change and trade disruptions impact future
•   improved efficiency & conserving natural capital
                                                            food availability, accessibility and affordability- the
    – sustainable intensification
                                                            three A’s of food security. Even before the pandemic,
•   development of green growth technologies/               food insecurity in Canada was largely an income
    practices                                               (affordability) issue as Canada is known to have
                                                            an abundance of safe, high quality and nutritious
•   increased trade, and                                    food (availability), seeing as it is a massive surplus
•   adding value to products                                producer, which makes food readily accessible
                                                            to most Canadians through highly sophisticated
                                                            retail and distribution networks. The exception is
                                                            in Northern communities where access to food is
3. Forces of Change                                         limited due to distance from markets and because
                                                            indigenous food sources are being challenged by
CAPI’s research identified major forces of change           climate change, biodiversity loss and the threat of
that will affect the future sustainability and resilience   animal disease, such as chronic wasting disease
of the Canadian agri-food sector. The key ones              (CWD). So from a Canadian agricultural perspective,
were highlighted in the presentation. The pandemic          food insecurity is primarily a “global food security”
taught us how intimately connected are animal               issue. However, from a processed food perspective,
and human health which ultimately determine                 Canada’s value-added capacity is considered
socio-economic health. Therefore, there is a need           underdeveloped, raising concerns about local food
for industry strategies, government policies and            availability and supply chain vulnerabilities as well as
regulations that take a “One Health” approach.              resilience concerns. This was particularly brought to
Secondly, Canada’s agri-food sector is heavily              light during the pandemic. Hence, it appears we are
dependent on trade, and major geo-political conflicts       not as resilient as we need to be and more needs to
have disrupted our trade flows and investments. The         be done.
knock-on effect has been increasing global emissions

                                                                                                                       2
5. Sustainable Intensification
5.1 Past technological change and trade made it possible to feed increasingly
more people
Figure 1

Source: CAST, Agriculture and the Microbiome. August 2020

Food security has been a concern for millennia but          While innovation and trade have been instrumental
became particularly important in the post WW II             for ensuring the planet can feed increasingly more
period as Europe rose from the ashes of war and a           people, it has also created significant “One Health”
growing world population living on subsistence diets        problems, due to the environmental impacts of
became a major concern, affecting the political             agricultural production growth, including Climate
and social stability of many developing countries.          change, pesticide residue, antimicrobial resistance
Innovation and technological developments have              (AMR), eutrophication and groundwater decline. By
been key to being able to feed an increasing number         2050, farmers will need to produce enough food to
of people since the mechanization of agriculture            feed a world containing 9.7 billion people, which
in the late 1800s, when an acre of land produced            translates into over 450 people per acre of farmland.
enough food to feed 26 people (Figure 1). With the          We must also do this with less land, fewer inputs and
end of WW II, ammonium nitrate was no longer                70% less GHGs according to the World Resources
needed for bombs and the “green revolution” took            Institute (2018). Global success based on further
off with the introduction of chemical fertilizer,           intensification of production will depend on the
pesticides, new plant varieties and hybrid seed as well     sustainability of future practices and technologies.
as irrigation, allowing an acre of farmland to feed         So sustainable intensification will be the key.
155 people with a world population of 3 billion. With
the introduction of precision agriculture in the 1990s
each acre could produce enough food to feed 265
people, with a population then of 5.3 billion.

                                                                                                                    3
5.2. Productivity growth remains the key factor in achieving sustainable
intensification
The World Resource Institute’s report entitled Creating a Sustainable Food Future (2018) identified the role of new
technologies and innovation for improving productivity growth and increasing efficiency of natural resource use
as key factors for producing 56% more calories to feed 9.7 billion people while lowering emissions by 70%- all
essential for feeding the world in 2050 without destroying the planet.

         Figure 2

         Source: World Resource Institute, Creating a Sustainable Food Future.

As shown in Figure 2 above, the first column in grey                   share of the total and to prevent further heating of
reflects actual global agriculture GHG emissions of 12                 the planet. The remaining columns demonstrate
Gt/year in 2010. The second column in yellow reflects                  other ways to reduce the gap, including by reducing
the global emissions from agriculture with no further                  food demand, food waste, on-farm energy use and
productivity gains between now and 2050. Global                        other efficiency gains from livestock, rice production,
emissions will rise to 38 Gt/year and will represent                   fertilizer use and by restoring peatlands and
a larger share of the total by 2050. However, if we                    reforestation. Not only is maintaining the current rate
can maintain historical rates of productivity growth,                  of productivity gains critical, but further innovations
agricultural emissions will only rise to 15 Gt/year,                   that can raise productivity growth are essential. CAPI
a reduction by the amount of the third column in                       has coined this “producing more and better with less,”
green of 22 Gt/year in 2050. However, there is still a                 also known as “sustainable intensification”. The issue
substantial gap between the 15 Gt/year assuming                        is whether we can maintain or increase the pace
current productivity growth rates and the targeted                     of productivity gains by developing and adopting
4 Gt/year, which is required to maintain agriculture’s                 breakthrough technologies.

                                                                                                                                 4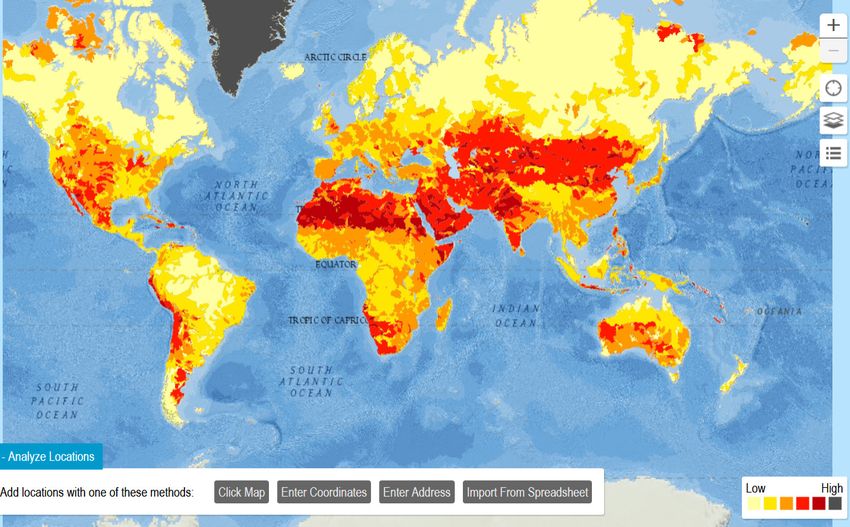
5.3. Climate change is one of the biggest risks to sustainable intensification
Unfortunately, climate change continues to loom                         negatively affected by climate change due to its
large as a risk factor for future productivity gains.                   northerly climate, and has thus far maintained its
According to a recent study by Ortiz-Bobea et al                        productivity gains. Russia is also an exception.
(2021), for much of the world climate change is
                                                                        Other studies, such as Fuglie et al. (2018), indicate
already cancelling out years of productivity gains,
                                                                        that agriculture productivity is slowing due to
as indicated in Figures 3 and 4. Research shows
                                                                        lower public and private investments in R&D in
that a 1oC increase in global temperature wiped
                                                                        agriculture. This is despite the fact that the World
out the productivity gains of the past 7 years. This
                                                                        Bank (2018) reports that $600 billion in global
is particularly the case for developing countries,
                                                                        domestic agricultural subsidies are being provided by
especially in tropical and semi tropical areas, which
                                                                        governments annually. Unfortunately, these subsidies
shows them faring the worst (in red). Canadian
                                                                        generally encourage unsustainable production
agriculture, on the other hand, has not been
                                                                        practices and negative environmental externalities.

            Figure 3

            Source: Ortiz- Bobea, A. et al. Nature Climate Change | VOL 11 | April 2021 | 306–312

                                                                          Figure 4
                                                                          Source: Ortiz-Bobea, A. et al. Nature Climate
                                                                          Change | VOL 11 | April 2021 | 306–312

                                                                                                                                5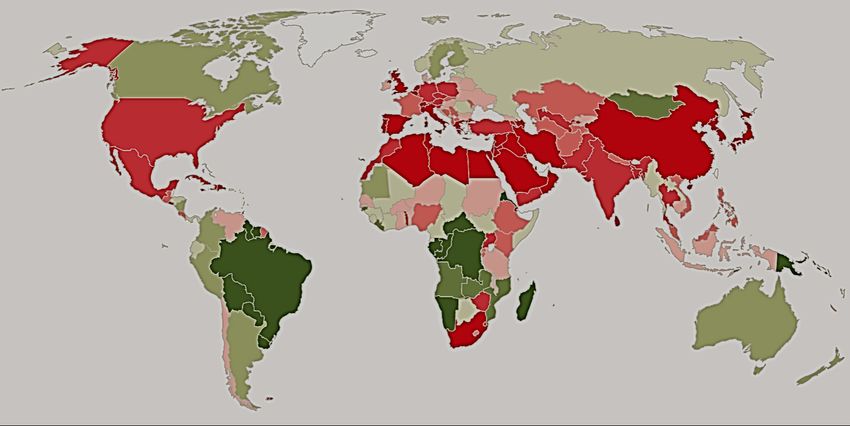
5.4. World Economic Forum Global Risk Landscape-2021
Climate change is one of many risk factors affecting    •   Infectious disease
agricultural production and future food availability
                                                        •   Climate action failure
and affordability. Other related risks include limits
to arable land and fresh water. The World Economic      •   Biodiversity loss
Forum’s most recent annual Global Risk Survey shows
that many of the risks with the greatest impact and     •   Natural resource crisis (including soil and water)
the greatest likelihood directly affect agriculture
                                                        •   Extreme weather
production. Some of these risks, shown in the extreme
upper right quadrant of Figure 5 below which have
the greatest impact and likelihood include:

Figure 5 Global Risks Landscape 2021

Source: WEF, Global Risks Report, 2021

                                                                                                                 6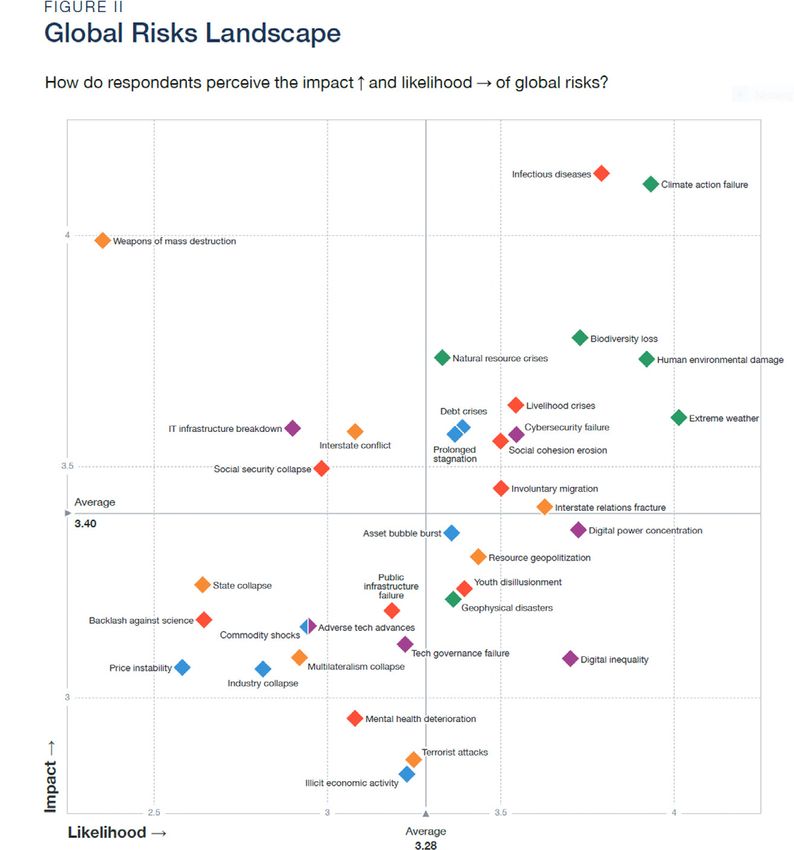
5.5. Water risk is a serious threat to food security and world peace
The depletion of soil and water is a significant direct         average, agriculture accounts for 70 percent of global
local threat to countries, particularly those facing the        freshwater withdrawals. With the additional demand
“double resource challenge” of having a biocapacity             for food projected by 2050, the FAO projects water
deficit and low income (Wackernagel et al. 2021).               demand could increase by 50 percent, but that would
In many cases these are also the regions which will             severely short other societal demands for water in a
be affected more drastically by climate change.                 growing list of countries. Loss of agricultural soil and
Figure 6 indicates the countries with the greatest              biodiversity are also problems that need solutions in
risk of growing water stress, which is becoming                 order for agriculture to be sustainable. And then there
an increasing food security problem as well. On                 is disease.

Figure 6 Overall Water Risk

Source: World Resources Institute: Aqueduct Water Risk Atlas.

                                                                                                                           7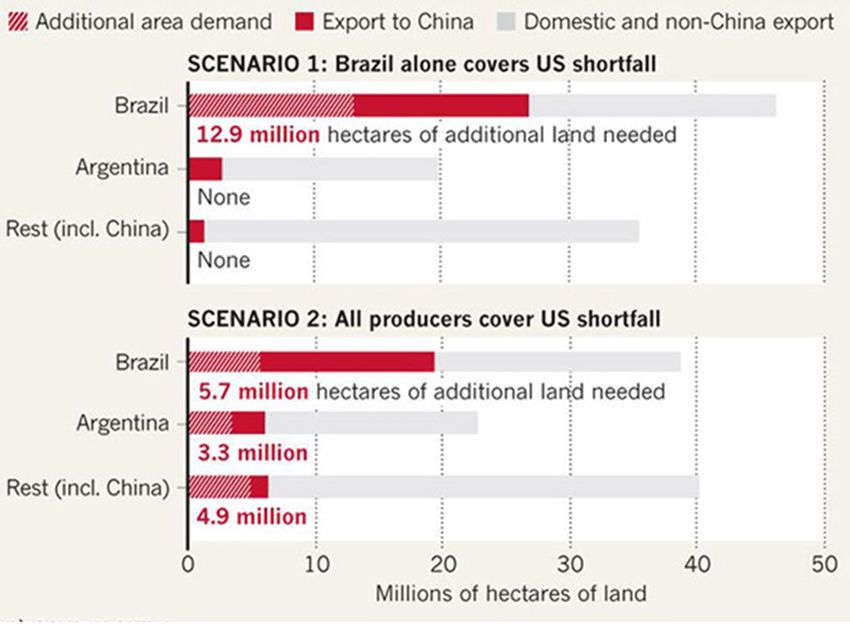
5.6 Intensification without sustainability is no longer an option
The recent pandemic has underscored the fact that          important and in some parts of the world it is out of
infectious disease, including zoonotic diseases, are       control. The World Bank estimates that antimicrobial
not only a threat to human health but also a serious       resistance (AMR) may reduce world GDP by upwards
socio-economic threat. Research shows that there           of 3.5% annually by 2050.
is a clear correlation between farm animal density,
                                                            So the risks of plant and animal disease need to be
as shown in Figures 7 to 10, and recent animal
                                                           evaluated through a lens that considers their impacts
disease outbreaks, such as African Swine Fever
                                                           on human health, food security, trade and socio-
(ASF) (Figures 7 and 9) and Avian Influenza (Figures
                                                           economic wellbeing. Therefore, innovation systems
8 and 10). Where there are more hogs and chickens
                                                           need to adopt a One Health approach. The Deans
per km2, there have been more disease outbreaks.
                                                           of Canadian Faculties of Agriculture and Veterinary
Intensification of agricultural production without
                                                           Medicine (CFAV) have put together some compelling
innovation therefore increases the risk of many
                                                           recommendations around a “One Health” approach”
negative externalities, including animal and plant
                                                           in this regard in their recent report“ Reinvigorating
disease. As an example, 75% of emerging infectious
                                                           Canada’s Economy by Investing in Agri-food and
diseases are zoonotic and we have increases in
                                                           Animal Health Innovation” (2021).
mortality from infectious disease for the first time
since the 19th century. Antimicrobial resistance is also

Figure 7 Hog Density                                       Figure 9 Poultry Density

Source: FAO, Gridded Livestock of the World                Source: FAO, Gridded Livestock of the World

Figure 8 African Swine Fever (2018-20)                     Figure 10 Avian Influenza (2018-20)

Source: FAO, Gridded Livestock of the World                Source: World Organization for Animal Health (OIE)

                                                                                                                   8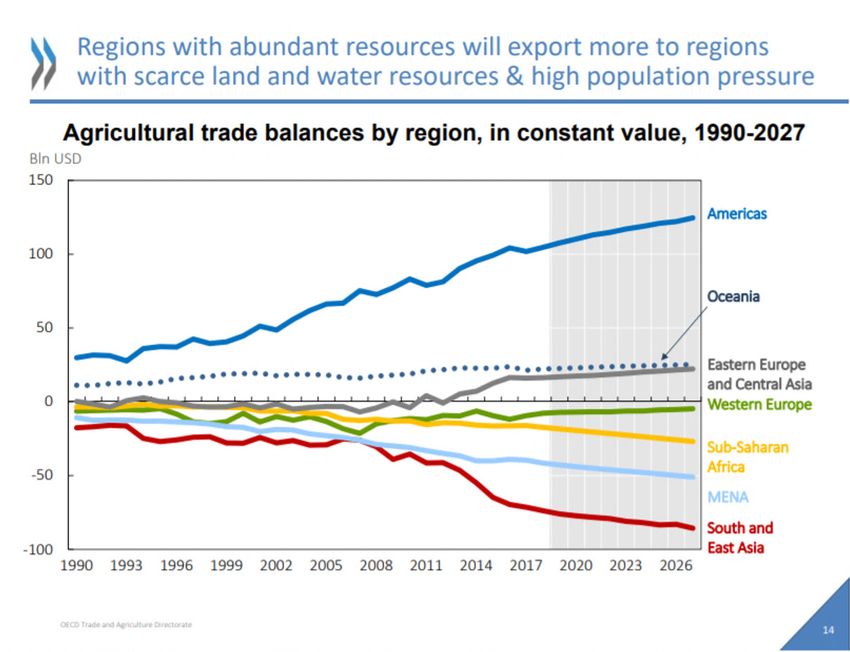
5.7 The 4th Industrial revolution and microbiome solutions will be key to feeding
more people with less land and fewer inputs
As per the Deans’ suggestions, in order to feed an                 interdisciplinary research and collaborative
increasing population better and more sustainably,                 communication, according to the Council for
we will need to rapidly adopt innovation around the                Agricultural Science and Technology (CAST) (2020)
phytobiome, microbiome, robotics, mRNA vaccines,                   (Figure 11). Each of these components drives and
big data and Artificial Intelligence (AI), and more,               improves the others and ensures faster uptake and
all of which flow from the 4th industrial revolution.              wide consumer acceptance. This is particularly
Clearly, the key to success will be an integrated                  important because sustainable intensification will be
approach that encompasses training and education,                  very knowledge and data intensive.

              Figure 11 Integrated Approach for Microbiome Solutions

              Source: CAST. Agriculture and the Microbiome. August 2020

                                                                                                                           9
5.8 Innovations have reduced GHG emission intensity in agriculture production
in North America and Europe by improving resource efficiency
As shown in Figure 12, GHG emissions from countries, including China and India. This is caused
agriculture vary significantly by region. In North on the one hand by a lag in technology, knowledge,
America, GHG emissions from agriculture are a and investment, and on the other hand, by the
quarter of emissions from South and Southeast Asia, negative effect of land use change and increased
and more than half of emissions from SubSaharan deforestation on emissions. North American
Africa. According to Blandford (2018), 92% of global agriculture has made substantial efficiency gains in
GHGs related to agriculture arise in developing production by improving resource efficiency.
Figure 12 GHG Emissions from Agriculture, by Region, 2014 Figure 13 Global Dairy Efficiencies 2013
Source: FAO Source: USDA/FAS, Agritrends 2013 data
As an example, as Figure 13 shows, dairy production the change if the developing world had fewer cows
in the U.S. and the EU is significantly more efficient but more milk and less need for feed and far fewer
than in Brazil, India and China, since with only 14% emissions? For the benefit of the global commons, it
of the global dairy herd, the U.S. and the EU produce will not be sufficient for the U.S., the EU and Canada
43% of global milk production. This compares with to just be an early adopter of agriculture innovation.
Brazil, India and China, which have 73% of the global We must also lead in standards development and
dairy herd, but only 37% of production. Imagine innovation dissemination globally.
105.9 Through science and innovation, Canada has become one of the most GHG
efficient producers of agri-food products
Innovations have also widened the gap in GHG milk production. Reductions in emissions intensity
emission intensity across countries. The value of in Canadian animal protein production have been
Canadian agricultural production has more than particularly dramatic, falling by 36% since 1981
doubled since 2007 (in constant 2007 prices) while (AAFC). This has made Canada one of the most GHG
GHG emissions from agricultural activity remained efficient producers of animal protein in the world
stable (Figure 14). This resulted in a decline in (Figure 15). It makes sense that as the world demands
GHG emission intensity, mostly due to reduced more meat, it would be best to produce it where GHG
tillage, cover crops, the introduction of 4Rs and intensity is lowest.
vast improvements in the efficiency of meat and
Figure 14
Source: ECCC,NIR 2020; Statistics Canada
Future investments in R&D and faster adoption of Processors are also doing their part moving towards
better management practices and new technologies carbon neutrality by adopting new technologies and
will be needed to continue to see emissions practices, by reporting their ESG performance and
reductions and efficiencies in agriculture. In terms of by participating in supply chain initiatives to source
carbon sequestration in soils, primary agriculture is and sell sustainable products. They are also ready to
well set to supply emission credits and to participate buy credits.
in public-private partnerships developing trusted
carbon accounting and certification systems as the
key to broadly successful emission trading systems.
Figure 15 Canada’s Relative Performance
in GHG emissions intensity for Protein
Source: FAO and AAFC
115.10 Agriculture accounts for 8.1% of total GHG emissions in Canada
To put green growth into perspective, Canadian In Canada, forestry and land use changes produce
agriculture accounted for 8.1% of total GHG emissions negative emissions, bringing Canada’s AFOLU to
in 2019, not including on-farm energy use. This is lower 7.8% of total. Canada performs much better than the
than at the global level where agriculture GHGs were global average when forestry and land use changes
estimated at 10-12% of the total in 2019. When net are included in the calculation as this is where the
emissions from forestry and land use changes are IPCC counts gains or losses in carbon sequestration.
included, the share of total emissions from agriculture, The fact that 50% of Canada’s agricultural
forestry and land use changes (AFOLU) globally production is exported indicates Canadian agriculture
accounted for 23% of the total (IPCC, 2020). This is is not just contributing to global food security by
because for many countries, deforestation is resulting producing and exporting food, but it is providing
in adding to emissions rather than offsetting them global climate change solutions with its low GHG
when carbon is stored as a sink, which is the case in intensity products.
many developed countries such as the U.S. and the EU.
6. Trade
6.1 Disruptions in trade can negate these global gains by shifting trade
to sub-optimal locations
However, it is easy to destroy progress on climate imports from the US to Brazil in 2019. This led to a
change and food security when countries disrupt rapid increase in food exports to China from South
global food trade for political gain with predatory America, with resulting social and environmental
trade policies, as exemplified during recent costs related to food price hikes, food insecurity, civil
geopolitical manoeuvring between the US and unrest and deforestation (Figure 16).
China that resulted in China diverting its soybean
Figure 16
No Meat, No Milk, No Bread: Hunger Crisis Rocks
Latin America
Millions are getting pushed into poverty, moving
from relatively comfortable lives to not knowing
where their next meal is coming from.
September 28, 2020
12The outcome of this trade diversion is still being felt in several ways. First, it is having environmental impacts as
would require an additional 12.9 million hectares of land in Brazil in order for Brazil to replace the U.S. soybeans
that would have been exported to China (Figure 17). If more land is brought into production by Brazil to meet
that Chinese import demand, this will result in an increase in global carbon emissions from land conversion
and deforestation. Second, it is having a socio-economic impact as food prices in Latin America have risen
dramatically given the excess demand, leading to increased poverty and food insecurity.
Figure 17 Impact of Trade Diversion on South American Land Use
Source: Richard Fuchs et. al., “Why the US-China trade war spells disaster for the Amazon” Nature, March 28, 2019, https://www.nature.com/
articles/d41586-019-00896-2
This example highlights how closely trade, environmental sustainability, food security and profitability are
connected. Environmental disaster will unfold if China’s trade diversion drives land use change in Brazil to more
deforestation and to lower dependency on low carbon intensive producers of soybeans and other food.
136.2. Another example is the jump in Chinese meat imports which resulted in
shortages and high prices in the exporting countries, with grave implications
for food security
In the case of meat protein, production is so skewed is uncompetitive in cattle and hog raising and
to China which has about half the hogs in the world, has a relatively high CO2e footprint, making the
that any large shortfall cannot be readily filled by decision to increase their meat self-sufficiency
trade. Since African Swine Fever emerged in 2018, and increase sourcing from certain parts of South
China has been importing about a third of global America incompatible with the goal of global carbon
meat exports with world meat exporters becoming neutrality. Unfortunately, this is an example of the
increasingly reliant on the Chinese market (Figure rules-based multilateral system being replaced
18). Meanwhile, 80% of Canadian meat plants and by power-based bi-lateral arrangements creating
some Australian plants are under political suspension investment and food security uncertainty.
by China causing significant trade diversion. China
Figure 17 Impact of Trade Diversion on South American Land Use
Source: Meat and Livestock Australia
146.3. Trade without accounting for externalities could worsen all environmental
outcomes
Sticking with the trade theme, a great deal of global food needs are increasing. In fact, over 11% of
global food trade ignores the significant negative global agricultural exports are entirely dependent on
externalities associated with production, which will groundwater depletion embedded in the food traded.
ultimately lead to future food security crises. The The countries with significant groundwater depletion
World Bank estimates that more than a third of the and food exports at risk are shown on the left of
world’s food is produced on irrigated agricultural Figure 19, and the largest importers of virtual water
land and that the source of approximately 40% of on the right includes Canada. When the wells run dry
the water used for irrigation globally is groundwater. those food sources will be gone. But well-intentioned
Alarmingly, satellite data and other monitoring tools efforts to reduce agricultural emissions can also have
show that groundwater supplies in many of the world’s unintended consequences.
key agricultural regions are shrinking at a time when
Figure 19
Source: Aldaya, M. Eating Ourselves Dry. Nature. 2017
156.4. Policies, such as EU’s Green Deal, aim to reduce domestic GHG emissions
but may inadvertently worsen global environmental outcomes
Various policy initiatives have been introduced to to offshoring of the environmental damage and
address climate change. The European Union’s increased GHGs from importing millions of tons of
Green Deal includes reductions in the use of land, crops and meat produced elsewhere, possibly with
antimicrobials, fertilizers and pesticides which higher carbon intensity and with resulting tropical
unless offset by a large jump in productivity will forest destruction offshore.
result in lower output. Studies suggest this will lead
Figure 20
Source: Fuchs et al. 2020.
Fuchs et al (2020) calls into question the logic of the EU biofuel industry which incents land use change with
tropical oil crop imports, driving climate change and threatening food security (Figure 20). In another report by
the USDA-ERS (2020) which model the impacts of the EU policy also finds similar results, including global food
price increases and worsening global food security. In addition to this, the EU is considering a carbon border
adjustment mechanism in an attempt to level the playing field with imports from countries with less rigorous
climate change policies, in order to keep from being overrun with lower cost imports.
166.5 When the dust settles, surplus production will come from areas with
production capacity: The Americas will remain the major agri-food surplus
suppliers to the world
According to the OECD (2019) presentation to a WTO meeting, the future of global food trade will be
characterized by “Regions with abundant resources exporting more to regions with scarce land and water and
high population pressure”. Asia, Africa and the Middle East, as major food deficit countries will continue to be
more food deficit and the Americas will be the strategic food resource (Figure 21).
Figure 21 Projected Agricultural Trade Balances by Region, 1990 to 2027
Source: OECD 2019
177. Adding Value
7.1 Canada needs export markets as much as the world needs Canada’s surplus
to feed a growing population
Figure 22 shows how Canada is one of the most seafood) almost reached $74 B in 2020. Canada
agriculture and food export dependent countries needs to leverage its strengths and boost its value-
in the world, with much of our exports being raw added processing capacity to be able to benefit
commodities or primary production (Figure 23). As from the opportunity to meet the growing global
the world’s 5th largest exporter and importer of agri- demand for food expected in the future. But this will
food products, Canada’s agri-food exports (including require investments.
Figure 22 Trade Dependent
Exporting Countries
Source: OECD/FAO (2020)
Figure 23 Canadian Primary
and Food and Beverage
Processing Exports, 2002
to 2020
Source: Statistics Canada
187.2 Demand will continue to grow in the food deficit regions particularly
for higher valued food products
Figure 24 shows regions of the world with food surplus China, India, Indonesia, Brazil, Russia, Mexico and
or deficit (share of net food imports in the domestic Turkey) are projected to grow to double the size of
food supply), measured in calories. Food security was the G7 countries by 2040, the map will grow more
top of mind for many countries even before African red. Household income in many Asian countries will
Swine Fever and COVID arrived. But as the economic grow far faster than in the western world, driving the
power of the E7 countries (emerging economies of demand for value added processed foods (Figure 25).
Figure 24 Food Surplus
and Deficit Countries
Source: FAO
Figure 25 Growth in household
income by country (2015 = 100)
Source: Fitch Connect
197.3 Canada has a good reputation internationally, but can we convert this into
sustainable investments in high value products?
According to a number of studies, Canada has on Economic Growth (2016) of 5.2% of world market
a strong positive reputation internationally but share for Canadian agri-food exports by 2027, would
needs to turn that into more investment in value require Food and Beverage processing exports to
added agriculture and food products (Figure 26). grow by 13.7% per year, a very unlikely possibility.
Reaching the target set by the Advisory Committee
Figure 26 Top Country ESG Scores, 2016 and 2017
Source: RobecoSAM
207.4 Scale remains a key issue for Canadian Food Processing
Clearly if we are to compete globally, Canadian food have simply kept on getting better, to the point where
processers will need to increase scale. With barely we have a greater market share in the most valuable
1% of our food processing companies considered market- Japan, than the Americans who have over 5
large, with over 500 people, Canada has a problem times more hogs to draw on. Creating hard-to-copy
(Figure 27). We need to become great at scaling niche desired niche products and developing sustainability
businesses. One example that stands out is chilled as a competitive advantage differentiator will be
pork. We were the first outside Asia to market it and increasingly important.
Figure 27
Source: Statistics Canada and Thompson
et. al. 2020
Figure 28 Number of FB
Processing Establishments
Source: Statistics Canada and Thompson
et. al. 2020
217.5 Adding value is critical for the resilience of Canada’s agri-food system and
contributes to the well being of Canadians
Finally, Canada’s capacity to produce its own the pandemic reminded us this can rapidly become
processed food products has deteriorated over time. a food security issue for Canada. Trade follows the
The number of FB processing establishments in money and as we have shown, wealth is shifting. As
most provinces has declined since 2009, except for we discovered with the pandemic, by boosting higher
Ontario and British Columbia (Figure 28). Canadians value processing capacity here at home, we could
have become more dependent on imports with the reduce our dependence on imported food, ensuring
share of processed food imports in Canada’s food more secured domestic food supplies while also
consumption more than doubling from 15% in 1992 to providing an alternative to commodity exports with
30% in 2020 (Figure 29). This is an economic issue and the inherent economic benefits of value added.
Figure 29
Source: Statistics Canada, AAFC Calculations
8. Conclusions • accelerate productivity gains, improve
environmental outcomes and provide solutions
to climate change through increasing
As a result of the research, analysis, webinars
sustainable intensification;
and dialogues CAPI has conducted over the past
year and half, both on its own and with partners • take a “One-Health” approach to strategy,
the Canadian agriculture and agri-food system policies, innovation and regulation since climate,
is competitive economically and environmentally animal and plant disease risks loom large for
(low GHG intensive) and has proven to be relatively productivity, food security, human health and
resilient during the pandemic. However, in the face socio-economic health.
of climate change, a growing world population with • work with like-minded countries to ensure global
shifting wealth and the need to feed the world and sustainability and food security by repairing
Canadians while preserving Canada’s natural capital rules-based trade; and
and environmental and socio-economic health, it is • boost value-added output of the Canadian
essential that the agri-food system (AFS): AFS to reduce trade risk, increase resilience and
improve domestic food security.
This formed the basis of the discussions at the Pre-dialogue event that was held on May 11, 2021 with Trusted
Opinion leaders, which led to a Synthesis Report and Executive Summary which highlights the key findings. This
Synthesis report was then used as the foundation of the discussion at the Big Solutions Forum held on May
20, 2021, where several Deputy Ministers and Industry thought leaders provided their perspectives on CAPI’s
findings. This is summarized in a What We Heard Report with Recommendations for Future Actions.
22ANNEX: Background Factsheet on the
Canadian Agriculture and Agri-food System
The Canadian agriculture and agri-food system is an engine
of growth for Canada’s economy
Figure 1
Source: Statistics Canada
• In 2020, the Canadian agriculture and agri-food • Primary agriculture is the foundation of this
system generated $133 billion in GDP, accounting system, accounting for $39.2 billion or 2% of the
for 7.1 % of Canada’s total. Canadian total.
• The system employed 2.3 million people, • The food and beverage processing industry
accounting for 12.3% of Canada’s total represents 1.7% of the total or $32.7 billion GDP.
employment picture.
• This was followed by the food retail and wholesale
industry with GDP of $32.8 billion (1.7% of the
total) and foodservice with $21 billion (1.1%).
23This is because Canada is blessed with an abundance of natural resources
Figure 2
Source: FAO, Global Perspectives Studies
• Canada is one of a select group of countries that • In terms of freshwater, Canada has the third
has a biocapacity surplus in terms of natural largest renewable freshwater supply worldwide
capital relative to population needs. and the second largest amount per capita among
developed countries, at 103,899 m3 per person.
• In terms of arable land per capita, Canada ranks
Canada withdraws only a small percentage
second in the world after Australia, despite the fact
(0.18%) for agriculture for irrigation.
that arable land only accounts for 5% of the total.
24This allows Canada to be a major agricultural producer that can help feed the
world and Canadians
Figure 3
Source: Statistics Canada
• Canada reported 193,000 farms made up of all • Agricultural production is spread across the
sizes and specialization with most farms producing country with Manitoba, Saskatchewan and Alberta
grains and oilseeds, followed by beef in 2016. producing most grains and oilseeds, Alberta
most cattle and beef, Quebec, Ontario and B.C.
• The average area per farm rose to 820 acres
most dairy and horticulture concentrated in B.C.,
in 2016 as farms continued to get larger. The
Ontario, Quebec and Nova Scotia.
average age of farm operators continued to edge
up to 55 years in 2016. • In 2020, farm cash receipts rose to $72 billion,
up 8% over 2019 and 15% over the past 5-year
average. This was due to higher crop receipts
in 2020, up 14%, while livestock receipts were
1% lower.
25Canada is one of the world’s top agriculture and food exporters
Figure 4
• Canada as a major trading country is the fifth
largest exporter of agriculture and agri-food
products but also the fifth largest importer.
• Canada ranks in the top five in terms of
global exports of canola, wheat, pulses and
the top ten for beef and pork.
• The U.S. is the major export destination for
most Canadian agriculture and agri-food
products, at 52% of Canada’s total exports in
2017. The U.S. is also an important source of
agri-food imports as the two economies are
highly integrated.
Source: GATS, UN Commtrade
Canada exports more agricultural products than it imports
Figure 5
• In 2020, despite the pandemic, Canada
exported a record $32 billion value of
agricultural commodities to markets overseas
• This followed a decline in 2019, due to trade
restrictions on canola exports to China
• Most grain and oilseed exports were up
in 2020, along with those of greenhouse
vegetables and potatoes.
Source: Statistics Canada
26Despite this growth in Canadian agricultural production, emissions from
agriculture were down slightly in 2019
Figure 6
• Total GHG emissions from agriculture
(including on-farm energy use) were 72 Mt
CO2e, down slightly from 2018.
• Emissions for both crop and animal
production were down from 2018, but
emissions from crop production were up
compared to the past five-year average.
• On-farm energy use was also up compared
over the past five-year average.
• Emissions from animal production are below
the 2005 peak due to reduced livestock
numbers and improvements in livestock
Source: ECCC, NIR efficiency.
Canada exports more agricultural products than it imports
Figure 7
• Agricultural emissions (IPCC definition
excluding on-farm energy use) stabilized
around 59 Mt CO2eq in 2019, up 5%
since 2002.
• However, carbon captured in soils
has been decreasing due to increased
crop production.
• CH4 emissions from livestock continue to
decline while N2O emissions from crop
production increased 29% since 2002.
Source: ECCC,NIR 2020 • Adoption of new technologies and
practices will be needed to reduce
emissions in the future.
27Canada’s food and beverage processing industry is the largest
manufacturing industry
Figure 8
Source: Statistics Canada
• Food and beverage processing was the largest • While these processing establishments are spread
manufacturing industry in Canada in 2020 in terms across the country, the bulk are concentrated in
of sales and GDP. Quebec, Ontario and B.C.
• Most food and beverage processing • Meat processing is the most important subsector,
establishments are small with fewer than 100 followed by dairy, beverages, grain and oilseed
employees (90%) while only 1% have more than products and bakeries and tortillas.
500 employees.
28Food and beverage processing exports and imports have been growing steadily
over the past three years
Figure 9
• Canada is the fifth largest exporter of processed • The bulk of Canada’s processed food exports were
food in the world. destined for the U.S.
• Exports rose to $41 billion in 2020, up significantly • Canada’s trade balance in primary and further
from $39 billion in 2019. processed food products remained positive at $ 4
billion in 2020.
• Imports also increased, to $37 billion, up from $35
billion in 2019.
29The trade balance for further processed food products still remains negative
despite some improvement recently
Figure 10
Source: Statistics Canada
• Canada’s trade balance in higher value-added • While beverages and spirits has shown some
food products has improved over the past few improvement, the trade deficit for miscellaneous
years but still remains in deficit at -$6.5 billion. food preparations continues to worsen.
• Two categories have shown particular • COVID brought light to the need for stronger
improvement – cereal preparations and cocoa domestic value-added capacity in Canada and
preparations, with trade surpluses of $1.1 billion this will require more investment.
and $0.1 billion respectively in 2020.
30The Canadian food and beverage processing sector continues to attract inward
FDI, but registers net outflows
Figure 11
Source: Statistics Canada
• Foreign Direct Investment into Canadian food and • Canadian FDI abroad also rose in 2019 to $23
beverage processing rose to $39 billion in 2019, up billion with most still destined for the U.S.
22% over 2018.
• Investments are needed to expand domestic
• Increasingly, FDI into Canada originates from value-added capacity in Canada.
Europe, growing by 18% over 2018
31The Canadian food service sector was adversely impacted by the pandemic
while food retailing performed well in 2020
Figure 12
Source: Statistics Canada
• Foodservice GDP declined 30% in 2020 as • However, as costs rose to lure grocery store workers,
the lockdowns forced restaurants to close cover the costs of extra Covid measures, margins
in-house dining. thinned and retailers boosted fees to suppliers
• Canadians turned to more grocery purchases • Strategies to introduce a retail code of conduct
while restaurants resorted to take-out, which was were discussed by industry and government
not enough to maintain sales.
32References
Aldaya, Maite M. 2017. “Eating Ourselves Dry”. Nature. Vol. 543.
Barrett, C.M. et. al. « Bundling Innovations to Transform Agri-food Systems.” Nature Sustainability. December
2020.
Beckman, J. et al. 2020. USDA- ERS. Economic and Food Security Impacts of Agricultural Input Reductions Under
the European Union Green Deal’s Farm to Fork and Biodiversity Strategy. USDA-ERS. November 2020.
Blandford, D. 2018. “Border and Related Measures in the Context of Adaptation and Mitigation to Climate
Change”. Background Paper to the State of Agricultural Commodity Markets (SOCO). Rome. FAO
Council for Agricultural Science and Technology. 2020. Agriculture and the Microbiome. Issue Paper No. 68.
August 2020.
Dean’s Council - Agriculture, Food and Veterinary Medicine, “Reinvigorating Canada’s Economy by Investing in
Agri-food and Animal Health Innovation”, 2021.
Fuchs, R. et al. 2020. “EU Green Deal Offshores Environmental Damage to Other Nations”. Nature. Vol. 586.
October 2020.
Fuchs, R. et al. “Why the US-China trade war spells disaster for the Amazon” Nature, March 28, 2019, https://www.
nature.com/articles/d41586-019-00896-2
Fuglie, K. 2018. “R&D Capital, R&D Spillovers and Productivity Growth in World Agriculture”. Applied Economic
Perspectives and Policy. Vol. 40. No. 3. 2018
OECD-FAO. Agricultural Outlook. 2020
Ortiz-Bobea, A. et al. 2021. “Anthropogenic Climate Change has Slowed Growth in Agricultural Productivity”.
Nature Climate Change. Vol 11, April 2021. Pp. 306-312.
National Academy of Sciences. 2020. Groundwater Scarcity. Available at: Groundwater Scarcity Implications for
US Agricultural Production and Global Food Security | National Academies
Searchinger, T. et al. 2020. “Revising Agricultural Support to Mitigate Climate Change”. World Bank. 2019.
Thompson, S. et al. 2020. “Canadian Agri-Food Processing Competitiveness, Quality Growth and Global
Opportunities: A Snapshot of Current Trends Key Findings”. Canadian Agrifood Policy Institute. March 2020.
Available at: 2020-03-09-CAPI-Food-Processing-Key-Findings-Paper.pdf (capi-icpa.ca)
Wackernagel, M. et al. 2021. “The Importance of Resource Security for Poverty Eradication.” Nature Sustainability.
World Economic Forum. 2021. Global Risks Report, 2021.
33You can also read