CPB - Streets That Fit Re-allocating Space for Better Cities
←
→
Page content transcription
If your browser does not render page correctly, please read the page content below
CPB
                  Corporate Partnership
                  Board

Streets That Fit
Re-allocating Space for
Better Cities                             Corporate Partnership Board
                                          Report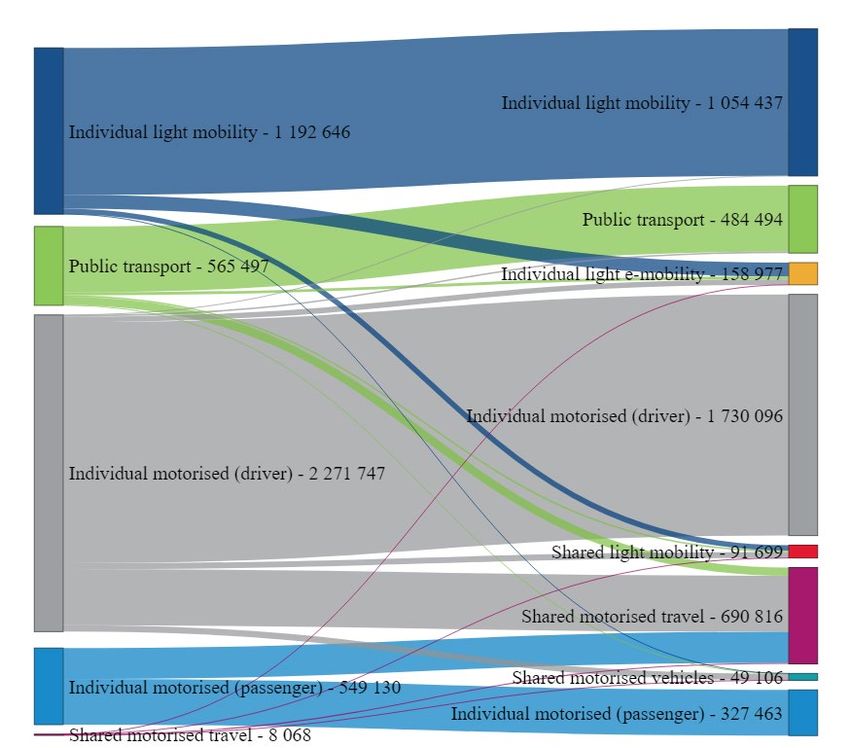
Streets That Fit
Re-allocating Space for
Better Cities             Corporate Partnership Board
                          Report
The International Transport Forum

The International Transport Forum is an intergovernmental organisation with 63 member countries. It acts
as a think tank for transport policy and organises the Annual Summit of transport ministers. ITF is the only
global body that covers all transport modes. The ITF is politically autonomous and administratively
integrated with the OECD.
The ITF works for transport policies that improve peoples’ lives. Our mission is to foster a deeper
understanding of the role of transport in economic growth, environmental sustainability and social
inclusion and to raise the public profile of transport policy.
The ITF organises global dialogue for better transport. We act as a platform for discussion and pre-
negotiation of policy issues across all transport modes. We analyse trends, share knowledge and promote
exchange among transport decision-makers and civil society. The ITF’s Annual Summit is the world’s largest
gathering of transport ministers and the leading global platform for dialogue on transport policy.
The Members of the Forum are: Albania, Armenia, Argentina, Australia, Austria, Azerbaijan, Belarus,
Belgium, Bosnia and Herzegovina, Bulgaria, Canada, Chile, China (People’s Republic of), Colombia, Croatia,
Czech Republic, Denmark, Estonia, Finland, France, Georgia, Germany, Greece, Hungary, Iceland, India,
Ireland, Israel, Italy, Japan, Kazakhstan, Korea, Latvia, Liechtenstein, Lithuania, Luxembourg, Malta,
Mexico, Republic of Moldova, Mongolia, Montenegro, Morocco, the Netherlands, New Zealand,
North Macedonia, Norway, Poland, Portugal, Romania, Russian Federation, Serbia, Slovak Republic,
Slovenia, Spain, Sweden, Switzerland, Tunisia, Turkey, Ukraine, the United Arab Emirates, the
United Kingdom, the United States, and Uzbekistan.

                   About the Corporate Partnership Board

The Corporate Partnership Board (CPB) is the International Transport Forum’s platform for engaging with
the private sector and enriching global transport policy discussion with a business perspective. The
members of the ITF Corporate Partnership Board are: AB InBev, Airbus, Allianz Partners, Alstom, Aramco,
Argo AI, Arrival, AutoCrypt, Bosch, CEiiA, Cruise, ExxonMobil, Iberdrola, Kakao Mobility, Michelin,
Mott MacDonald, NXP, PTV Group, RATP Group, Rolls Royce, Shell, Siemens, SPEA Engineering,
Tier Mobility, Total Energies, Toyota, Trucknet, Uber, Valeo, Voi, Volvo Cars and Volvo Group.

                                              Disclaimer

Funding for this work has been provided by the ITF Corporate Partnership Board. This report is published
under the responsibility of the Secretary-General of the ITF. It has not been subject to the scrutiny of ITF
or OECD member countries, and does not necessarily reflect their official views or those of the members
of the Corporate Partnership Board.
Cite this work as: ITF (2022), “Streets That Fit: Re-allocating Space for Better Cities”, International Transport
Forum Policy Papers, No. 100, OECD Publishing, Paris.
ACKNOWLEDGEMENTS

                                       Acknowledgements

This report was written by Philippe Crist, Luis Martinez and John P. Pritchard of the International Transport
Forum (ITF). Luis Martinez and John P. Pritchard carried out the modelling work in support of this report,
with input from Orla McCarthy.
This report was informed by a workshop with members of the ITF Corporate Partnership Board, including
Sven Lengsfeld (Bosch), Wolfgang Brückler (Kapsch TrafficCom), Laurent Tridemy (Michelin), Philippe
Ventejol (RATP Group), Christian Irmisch (Siemens), Maguelonne Chandesris (KISIO-SNCF), Allison Wylie
(Uber Technologies), Santosh Rao Danda (Uber Technologies) and Florence Prybyla (SNCF). Also
contributing to the workshop discussions were Carlos Felipe Pardo Velez (NUMO), Karen Vancluysen (Polis
Network), Vicente Torres Garibay (Grow), Urs Walter (Swiss Federal Department of the Environment),
Chris Bruntlett (Dutch Cycling Embassy), Marits Pieters (Municipality of Amsterdam), Danique Ton (TU
Delft), Shaleen Srivastava (Immense), Bernike Rijksen (Dat.Mobility) and Hans Huisman (Goudappel
Coffeng). Other CPB members of the project not present in Amsterdam include Laurence Wilse-Samson
(Bird), Louis Pappas (Bird), Ashwini Chhabra (Bird), Manon Lee (Bosch), Gilbert Konzett (Kapsch
TrafficCom), Felipe Garcia Castello (RATP), Maximilian Eichhorn (Siemens), Anka Schild (Siemens), Pierre
Messulam (SNCF) and Paul-Henri de Laboulaye (SNCF). Philippe Crist, Luis Martinez, Katja Schechtner and
Sharon Masterson all participated for ITF. The authors would also like to thank Barry Colleary, Head of
Transport Modelling at the National Transport Authority of Ireland, for providing transport data from
Dublin for the modelling.
The work for this report was carried out in the context of a project initiated and funded by the International
Transport Forum's Corporate Partnership Board (CPB). CPB projects are designed to enrich policy
discussion with a business perspective. They are launched in areas where CPB member companies identify
an emerging issue in transport policy or an innovation challenge to the transport system. Led by the ITF,
the project development is carried out in a collaborative fashion in working groups consisting of CPB
member companies, external experts and ITF staff.
The project was managed by Philippe Crist. Jari Kauppila, Sharon Masterson and Mary Crass (all ITF)
reviewed a draft version of the report. Suzanne Parandian (independent) edited the report and Hilary
Gaboriau (ITF) co-ordinated publication.

 STREETS THAT FIT: RE-ALLOCATING SPACE FOR BETTER CITIES © OECD/ITF 2022                                   3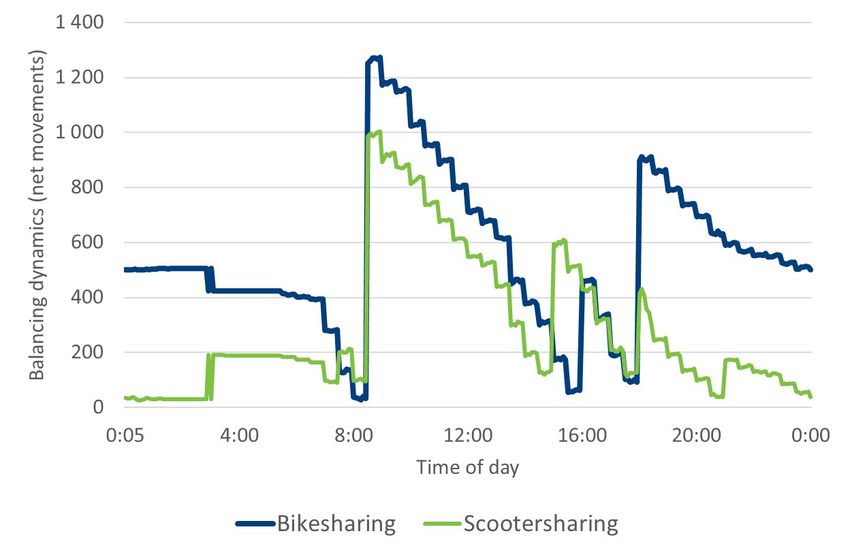
TABLE OF CONTENTS

                                                      Table of contents

    Executive summary ................................................................................................................................ 6
    Allocating street space: How and why?.................................................................................................. 9
       Tensions inherent in road space allocation ..................................................................................... 10
       How to measure space consumption .............................................................................................. 13
    New frameworks to characterise street space ..................................................................................... 22
    Modelling mobility and space consumption......................................................................................... 26
       Scenario definitions .......................................................................................................................... 28
       Modal alternatives ........................................................................................................................... 28
       Street space functions and configurations ...................................................................................... 30
       Assessment indicators of model outputs ........................................................................................ 33
    New mobility and dynamic street space allocation: The impact on space consumption ..................... 35
       Activity in the network and modal shift ........................................................................................... 37
       Space consumption .......................................................................................................................... 40
       Modal accessibility: What modes can be used to perform current trips? ...................................... 43
       Environmental considerations ......................................................................................................... 45
    Conclusions........................................................................................................................................... 50
    Notes .................................................................................................................................................... 52
    References ............................................................................................................................................ 53

                                                                      Figures

    Figure 1. A short history of street space development ........................................................................ 11
    Figure 2. Different standard parking space footprints in Europe and the United States ..................... 14
    Figure 3. Vehicle footprints of cars sold in Europe by model launch year, 1960-2019 ........................ 15
    Figure 4. Change in dimensions of selected vehicle models from launch year to present................... 16
    Figure 5. Space consumed per person per trip for different trip characteristics ................................. 21
    Figure 6. The Good Street vehicle families, classified by weight and dimension ................................. 23
    Figure 7. Indicative classification of various vehicles into six vehicle families ...................................... 24

4                                                                      STREETS THAT FIT: RE-ALLOCATING SPACE FOR BETTER CITIES © OECD/ITF 2022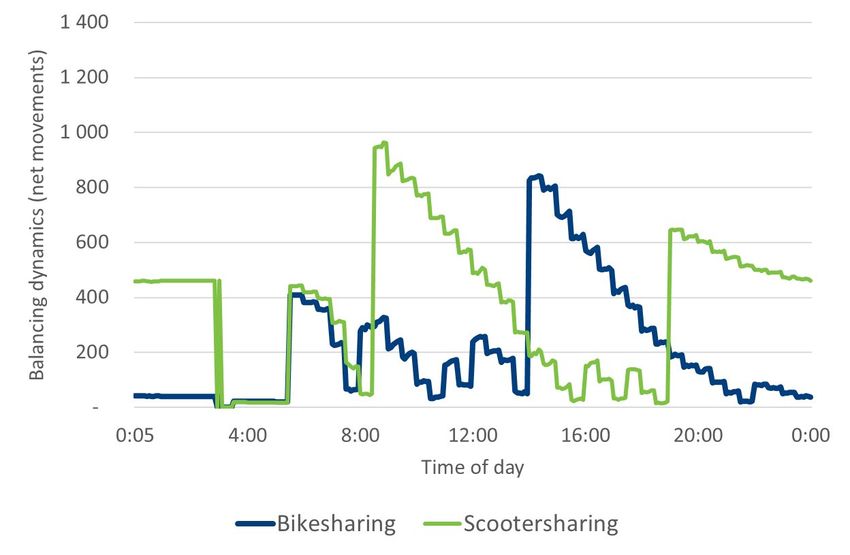
TABLE OF CONTENTS

 Figure 8. The Good Street archetypal urban traffic environments....................................................... 25
 Figure 9. Updated model framework to account for space allocation and use.................................... 27
 Figure 10. Dynamic reconfiguration of road space: Possible in-model conversion
 pathways of road classifications ........................................................................................................... 32
 Figure 11. Street performance compared to baseline over 24 hours .................................................. 36
 Figure 12. Street performance compared to baseline in the morning peak ........................................ 37
 Figure 13. Passenger-kilometres by mode ........................................................................................... 38
 Figure 14. Changes in activity between baseline and full implementation scenarios by mode ........... 39
 Figure 15. Modal switch (baseline vs. full implementation scenario) .................................................. 40
 Figure 16. Total and share of space consumed by mode per day ........................................................ 42
 Figure 17. Relative space consumption: Dynamic versus static space ................................................. 43
 Figure 18. Fleet relocation dynamics in a central urban area .............................................................. 47
 Figure 19. Fleet relocation dynamics in an outer urban area ............................................................... 48

                                                               Tables

 Table 1. Static space consumption per person by mode and configuration ........................................ 17
 Table 2. Maximum vehicle and person throughput by mode for different carriageways .................... 18
 Table 3. Description of modal alternatives included in the simulation exercise .................................. 29
 Table 4. Street space functions and configurations ............................................................................. 31
 Table 5. Space consumption by mode.................................................................................................. 41
 Table 6. Potential travel isochrone indicator: Modal shift with Full implementation scenario ........... 44
 Table 7. Traveller modal propensity indicator: Willingness to use different modes ............................ 44
 Table 8. Traveller modal propensity indicator: Willingness to use different modes (by location) ....... 45
 Table 9. Load factor by mode and use rate in full implementation scenario ....................................... 46
 Table 10. Environmental impacts and travel volumes by mode........................................................... 49

STREETS THAT FIT: RE-ALLOCATING SPACE FOR BETTER CITIES © OECD/ITF 2022                                                                            5
EXECUTIVE SUMMARY

                                  Executive summary

What we did

Street space in cities is a rare resource. Much of it is currently allocated to highly space-consuming
transport modes without taking into account that demands for that space vary over time. This report looks
at how street space has typically been allocated in the past, examines the rationale for street space
allocation and describes how to measure space consumption for mobility purposes. The study also
explores by way of a simulation how new mobility services and travel modes interact when a limited,
dynamic and demand-responsive re-allocation of street space is introduced in a mid-sized city. The
modelling framework put people first by framing the issue around how this space serves the population
and not on how the vehicles occupy the space.

What we found

The most visible infrastructure in cities is transport infrastructure. It is a necessary component of well-
functioning cities but also consumes a tremendous amount of scarce and therefore precious urban space.
The allocation of urban space is fraught with inherent tension. Space-related decisions are based on
improving the speed of cars and thus the travel times of their occupants to enable them to maximise what
is scarce to them, namely time. For communities, the impacts of speed are less clear-cut. It contributes to
improving access for those who are travelling fast but at the same time consumes a disproportionate
amount of space.
This tension is exacerbated by the fact that space allocation revolves around the question of how vehicles
use it and not on how well it serves people, despite the many potential and desired uses. Such an approach,
however, favours car users over those who travel by other means or would use that space for
other purposes.
There is an important distinction to be made between the use of street space versus the allocation of
street space. On the one hand, the actual use of street space is a representation of the demand for the
use of that space for travel. The demand and use vary by transport mode, by time of day and by urban
zone. The use of space relates to how much physical space people and vehicles actually consume as
they move.
On the other hand, the allocation of space represents the supply of street space made available for people
to move or linger and for vehicles to operate, park or otherwise idle. Currently, space allocation is largely
static over the course of the day. Such rigidity leads to street configurations that typically reflect the needs
of the most space-consuming modes and uses allowed there. It invariably results in inefficient use of space.
Moving away from the static allocation of street space towards flexible approaches poses challenges.
However, the temporary, reversible allocation of street space can make sense in specific contexts and
confer considerable benefits.

 6                                              STREETS THAT FIT: RE-ALLOCATING SPACE FOR BETTER CITIES © OECD/ITF 2022
EXECUTIVE SUMMARY

The tension around street space in cities also comes from a lack of universal and comparable metrics to
inform allocation choices. To serve that purpose, such metrics must incorporate both the dynamic aspect
of street space consumption as vehicles move and the static consumption of public space by parked or idle
vehicles. These two components can be captured in a composite indicator: square metre hours consumed
(m2.h) per traveller offers a good basis for discussing the relative space-consumption impacts of different
travel modes and trips.
Together, limited and dynamic re-allocation of street space plus additional free-floating mobility services
and other mobility options could significantly improve mobility outcomes. The simulations for this study
suggest a performance improvement of the urban transport network of approximately 12%, measured by
indicators for mobility, accessibility, environment, space efficiency and safety.
Without changes to the available mobility options and patterns, limited and dynamic space re-allocation
improves network performance by 9%. Including new modes without changing to a dynamic street
configuration generates only a 3% improvement.
The introduction of a wider range of generally more space-efficient modes and the limited, demand-
responsive, re-allocation of street space allocation leads to a 19% reduction in the overall space consumed
by all trips in the modelled city. These savings could create new opportunities for developing new uses for
public city space. These benefits are not evenly distributed geographically, however. They are
concentrated in the urban core, where competition for alternative uses of street space is greatest.
The combination of new mobility alternatives and limited, dynamic re-allocation of space also brings
significant environmental gains. Despite increasing the number of passenger-kilometres, overall transport
CO2 emissions fall by around 5%. Particulate matter emissions drop by 4% and could fall by 23% if the
shared vehicles are electric and powered using the current electricity mix.

What we recommend

Adopt meaningful indicators for how urban street space is used
No straightforward and comprehensive indicators are currently in use to assess space consumption.
Traditional capacity metrics such as speed-flow relationships or other throughput measures do not capture
the static and dynamic aspects of space consumed by travellers. Neither do the most common aggregate
measures of transport demand such as vehicle-kilometres or passenger-kilometres travelled. An indicator
that fills this gap is the square metre hour (m2.h) occupied by a vehicle- or person-trip. This composite
indicator includes the static consumption of space, i.e. the on-trip parking and idling of a vehicle, and the
dynamic use of space, namely the exclusive occupation of street space by the vehicle as it moves.

Re-allocate street space to account for diverse uses and users
Prevailing road classifications are largely designed to manage the use of road space by cars, vans and
trucks. Opening that space to other vehicles, users and uses – even non-transport uses – may bring benefits
in many contexts. More diversity and flexibility in street space allocation requires a shift in the practice of
allocating space, however. This includes aligning the legal speed of vehicle traffic with the characteristics
of the street space. Which vehicles can use what street should be defined by the infrastructure’s
characteristics. A vehicle could access those parts of the network whose design is adapted to the vehicle’s
mass and dimensions. Such an approach would enable a broader range of safe uses of public space
designated for mobility uses and help establish a wider variety of street uses.

 STREETS THAT FIT: RE-ALLOCATING SPACE FOR BETTER CITIES © OECD/ITF 2022                                    7
EXECUTIVE SUMMARY

Prioritise people over vehicles when allocating street space
Street space allocation should put people first. It must focus on how that space serves the population and
not how vehicles occupy that space. For that, it is critical to consider how the mobility needs of people can
be met and assess the access provided by the transport system. Decisions about street space allocation
should, therefore, always take as their starting point the space required per person, not per vehicle.

Explore the benefits of dynamically re-allocating certain street spaces
Moving from rigid towards demand-responsive street space allocation to make it available to a wider set
of users and uses can bring benefits. These accrue from a more space-efficient use of streets and the ability
for people to travel safely with a wider range of vehicles and modes. Limited and dynamic re-allocation of
street space also improves the resilience of the urban transport system through the ability to flexibly meet
changing demand.

Adopt Safe System principles to guide the re-allocation of street space
The re-allocation of urban street space must be carefully designed and implemented to avoid negative
impacts on traffic safety. Street space re-allocation should incorporate the principles of the Safe System:
that humans will make mistakes, that injuries result if the human body is exposed to known levels of kinetic
energy, and that all actors in a traffic system share responsibility for road safety of all, not only that of
motor vehicle occupants. In a Safe System, all elements of the road traffic system combine to prevent a
crash or at least prevent serious injury. Speed management and traffic separation, where necessary, are
two pillars of a Safe System. Integrating Safe System thinking into decisions on street-space allocation may
limit the range of potential reconfigurations achievable.

8                                             STREETS THAT FIT: RE-ALLOCATING SPACE FOR BETTER CITIES © OECD/ITF 2022
ALLOCATING STREET SPACE: HOW AND WHY?

                Allocating street space: How and why?

The most visible and omnipresent infrastructure in cities is related to transport – and road transport in
particular. Urban motorways, boulevards, streets, parking spaces, off-road or multistorey car parks,
intersections and interchanges all constitute the necessary foundation for the automotive age. However,
they also consume a tremendous amount of otherwise rare (and therefore precious) urban space.
Accessibility is broadly defined as the extent to which the land use and transport systems enable individuals
to reach activities or destinations (Geurs and van Wee, 2004). The spatial dimension of accessibility is
linked to the interplay between its three constitutive components: available activities/opportunities, their
location, and travel to them. The latter helps link the previous two – but so too does proximity. Increasing
proximity (and thus density) or increasing the speed of travel increases the number of opportunities and
activities that individuals can satisfy for a given period of time (Crozet, 2020).
From the perspective of travellers, increased speed is an acceptable substitute for physical proximity since
it delivers the same result in terms of linking people to destinations. For individual travellers, time is a
scarce resource. As such, speed delivers valuable time savings in getting from A to B, time which can be
used for other things. Aggregated together, cumulative time savings represent one indicator of collective
welfare and has served as the basis for measuring the impacts of transport investments and other policies
(Crozet, 2020). This indicator has dominated project and policy appraisal but has also been criticised for
poorly capturing certain important policy considerations and leading to unjust outcomes (Martens and
Ciommo, 2017).
For communities, the impacts of speed are slightly different since travel time savings contribute to overall
agglomeration benefits but consume a valuable and scarce public resource in communities – space.
Consequently, there is an inherent tension between the time savings that individuals wish to maximise by
their mobility behaviour and the efficient allocation and management of public space in urban areas. This
tension is further exacerbated by two factors: that urban space, even space predominantly allocated to
mobility, has multiple potential and desired uses, and secondly, that its allocation has largely concerned
how vehicles use that space versus how well that space serves people. These factors, although different,
favour the rights of those who use cars versus those who do not. The tension around urban mobility space
allocation is further complicated by the lack of a universal and comparable set of metrics that can help
inform choices on how this space should be allocated.
The discussion around the demand for and use of street space versus the allocation of street space should
not conflate the two concepts. In the first instance, the actual use or consumption of street space is a
representation of the demand for the mobility-related use of that space. This use/demand aspect is
variable by mode, time of day and zone, and represents how much physical space is actually consumed as
people and vehicles move.
The allocation of space represents the supply of urban road space made available for people and vehicles
to move and operate. The allocation of space is largely static over the course of the day and invariable over
time. It represents an investment in hard infrastructure (roadways, junctions, on- and off-street parking)

STREETS THAT FIT: RE-ALLOCATING SPACE FOR BETTER CITIES © OECD/ITF 2022                                   9
ALLOCATING STREET SPACE: HOW AND WHY? and is typically dimensioned for peak demand (for roads) and to allow for generous storage of personal vehicles in residential areas and in commercial or work destinations (for a discussion of parking supply see ITF, 2021a). Tensions inherent in road space allocation Despite periods of relative stability, road and urban public space allocation is often contested – especially in response to broader societal changes, local demands and external events. The global Covid-19 pandemic is one example of such an external stressor. Existing trends seeking to give more space to active mobility in many cities have questioned the basis for, and practice of, allocating most road space solely to motor vehicle traffic and storage. The tension around road space allocation is typically strongest where that space is rarest – in core urban areas. But it also emerges elsewhere when existing road space allocation practices exclude other desired uses of that space. The tensions inherent in road space allocation can broadly be categorised into four areas: liveability, capacity, spatiality, and network. Liveability relates to why and under what assumptions street space is allocated. Capacity relates to how and by whom road space is allocated. Network relates to where the space is being allocated. Spatiality relates to what is being allocated. Tensions around liveability At the heart of many of the tensions around the allocation of road space are the assumptions about who should use that space and for what purpose. Current practice regarding the allocation and supply of urban road space implicitly assumes that this space should be reserved exclusively for the movement and storage of vehicles. This stance stems from the actors and institutions that have over time defined how, by whom and to whom road space should be allocated. At its core is the shift from a broader iterative negotiation of how that space may be used, to a traffic engineering-led technical specification of how that space should be used by vehicles (Jones, 2014). Such a vehicle-oriented technical specification makes sense for major thoroughfares and urban motorways where mixing uses would prove dangerous and inefficient. However, for residential and many commercial streets, such exclusive allocation of road space is contested as there are other valuable (and valued by residents and shopkeepers) uses to which that space may be put, including children’s play, socialising, shopping and dining. These alternative uses gained attention during the Covid-19 pandemic, with the contestability of urban space sharpened in many areas around the world. Assumptions underpinning road space allocation have emerged largely in response to the large-scale deployment of motor vehicles whose speed and mass made them unsafe for mixed uses of that space and whose economic contribution to urban areas was prioritised over contributions stemming from other uses of that space. In addition, the technical characteristics of these vehicles – especially their speed – led to them occupying an increasing share of that scarce space. Thus road space allocation has prioritised motor vehicles under the understanding that this represents the best use of that limited space while at the same time, the amount of space allocated to motor vehicles has increased due to their technical characteristics. This development represents a break with historic trends in street space allocation (Figure 1). A second assumption is that the main metric for evaluating the allocation and supply of urban road space should be the space required by vehicles to operate safely. This is understandable since under-sized roads would lead to more inter-vehicle conflicts and increased congestion for a given level and mix of vehicular traffic. Nonetheless, the allocation of road space using vehicle space consumption requirements as its basis 10 STREETS THAT FIT: RE-ALLOCATING SPACE FOR BETTER CITIES © OECD/ITF 2022
ALLOCATING STREET SPACE: HOW AND WHY?

is highly problematic in urban areas where space is rare. It conflates social welfare outcomes with the
movement of vehicles and not with the movement of people. By doing so, it excludes (or minimises) the
spatial needs of people who are travelling using more space-efficient modes and favours the least spatially
efficient modes – especially single-occupancy car use. It leads to a biased and inequitable allocation of
space to the fastest and least space-efficient modes, contributing to overconsumption of scarce urban
space and reducing overall welfare outcomes. A better metric to guide the allocation of space from a
strategic perspective would relate to the amount of space required to move people, and not the vehicles
in which they travel.

                               Figure 1. A short history of street space development

                              Carriageway width

   = people

        Pre-1880                       1880-1920s                     1920s-Today                    Future?
 Pedestrian-dominated,          Pedestrian-dominated,            Motor vehicle-dominated,     Simultaneous
 narrow, windy roads,           roads widened, paved,            motorway infrastructure,     accomodation of multiple
 multiple uses of street        street grids introduced          pedestrians/cyclists/other   users, light modes given
 space                                                           uses pushed out of the       space, some streets
                                                                 street                       become narrower

Source: Based on Ward (2018).

Alternative assumptions around uses of road space and the prioritisation of space allocation have emerged
in different, largely local contexts. These assumptions give more consideration to alternative uses of road
space – even beyond vehicular movement and storage – and users of road space. One of the clearest
points of tension around discussions on road space allocation is the conflict between how local authorities
and citizens may wish to revisit road space allocation and the planning and engineering requirements that
underpin current practice (Jones, 2014; Halpern et al., 2020).

Tensions around capacity

Linked to discussions on why and to whom road space should be allocated is the question of who makes
those determinations and on what basis. As noted above, road space allocation decisions are largely
framed by traffic engineering considerations. Additionally, where economic appraisal is required or
incorporated, transport economists provide guidance. This should not be surprising as once the
assumption has been made that road space should be prioritised to the movement and storage of vehicles,

 STREETS THAT FIT: RE-ALLOCATING SPACE FOR BETTER CITIES © OECD/ITF 2022                                            11
ALLOCATING STREET SPACE: HOW AND WHY? it makes sense to involve traffic engineers. Given that road space is a scarce resource, it is also logical to involve economists and economic appraisal to help determine the most efficient and welfare-improving allocation of that resource. Nonetheless, because both traffic engineers and economists may work on the same set of assumptions outlined above, the outcome of their involvement may well ignore other valued uses of urban road space or exclude other, more space-efficient, uses of that space. A second issue to consider is how road space provision and allocation decisions are made. This issue is linked to how transport planning and provision is carried out and has, over time, shifted from ad-hoc decision making to a more formal, plan-based and model-supported decision framework. This framework has generally focused on planning and providing for motorised vehicle demand (both private and public transport-based) under the twin assumptions of the continuation of past growth trends into the future and a stability in the way in which exogenous factors impact transport demand. The main task for public authorities in that context was to predict future demand growth and then to accommodate that growth by re-allocating existing road space or building new infrastructure. This “predict and provide” approach has served well in periods characterised by stability in demand growth and the relative impact of exogenous factors – especially during the large-scale uptake of motorised vehicles in the last century. However, this approach has become increasingly problematic (ITF, 2021b). In many instances, future demand forecasts have failed to materialise. Where these forecasts have served as the basis for providing infrastructure, this has led to an over-allocation of space to accommodate projected growth which, paradoxically, then served to generate some of the very growth in demand it was meant to accommodate (ITF, 2021b). Thus, demand forecasts have become somewhat self-fulfilling, at least in their trajectories, if not in their levels. In addition, such “predict and provide” approaches favour existing uses of road space and are less well-suited to other users or for new, unanticipated but potentially valuable uses. Another issue is how well such aggregate projections are able to detect or accommodate more local uses of urban space and guide allocation decisions on a city or neighbourhood scale (ITF, 2021b). For these reasons, a renewed interest has emerged in the decision-making processes that recognise agency on the part of public authorities and are based on a strategic vision for future urban mobility. These “decide and provide” approaches make explicit a vision of what the future allocation of public space should look like and how that vision should guide decisions on allocation (ITF, 2021b). Tensions around networks Decisions regarding road space allocation differ according to where in the network they are required and on what types of roads and public spaces they should be implemented. In urban contexts, public authorities face pressure to do more with existing (or less) space. How they solve this challenge is guided by systems of hierarchical road classifications. Even when considering the allocation of road space principally for vehicular use, it became clear early on that not all roads serve or should serve the same function. This has led to the development of road hierarchies that stipulate what kind of functions and uses should characterise different types of roads. The conventional road classification hierarchy organises the road network based on the functional characteristics of each road class, ranked by a set of normative factors relating to safety, speed and traffic volume. Different road hierarchies have emerged but they largely differentiate road function between through use (e.g. motorways and arterials) and local access functions (e.g. local and collector roads) (Levinson and Zhu, 2012; Paraphantakul, 2014). Road hierarchies deliver several benefits from the perspective of managing motor traffic flows and access (Levinson and Zhu, 2012). By channelling the largest flows onto larger facilities, they allow economies of scale to be achieved in the construction of limited-access, regionally significant facilities. The hierarchy also avoids potentially dangerous conflicts among different road users and road uses. Designating and 12 STREETS THAT FIT: RE-ALLOCATING SPACE FOR BETTER CITIES © OECD/ITF 2022
ALLOCATING STREET SPACE: HOW AND WHY?

designing lower hierarchy links as local networks helps preserve neighbourhoods from the negative
impacts of high volumes of through-traffic. Nonetheless, especially for roads in dense urban areas, the
focus on functional hierarchies is problematic for several reasons.
From the moment they were originally conceived in the 1930s to the present, road classification
hierarchies view road space as movement space, moderating circulation on some roads and concentrating
it on others. They do not envisage non-movement uses of the space, rarely address non-motor-vehicle use
of the space and almost never account for dynamic and time-variable allocation of road space. Roads and
their uses are fixed and invariable and are, for all intents and purposes, set in stone. This does not reflect
the historical reality of road space allocation and usage — which has changed over time and according to
different technologies and prevailing uses — and prevents potential future uses of those spaces not
considered in current engineering and traffic planning guidance.

Tensions around infrastructure

Inherent tensions emerge when discussing the re-allocation of built assets such as roads and other forms
of mobility spaces. Roads and other forms of public space are infrastructure. They are tangible assets
comprised of surface and sub-surface materials. They have set widths, turning radii, junction treatments,
traffic signs and signals, on-road markings, curbs and other delimitations marking movement space and
access or transaction space. They are designed for specific uses and to ensure specific outcomes (e.g.
network function and safety). Decisions to re-allocate road space must necessarily contend with the
physicality of the space. They must also consider expectations regarding the use of that space by those to
whom it has been allocated. For this reason, discussions around the allocation of space, and especially the
re-allocation of space are fraught with controversy and involve technical challenges. This has not
prevented road space from being reimagined and re-allocated in specific instances or at a national scale
in certain countries, such as the Netherlands (Oldenziel, et al, 2016; Dekker, 2021). However, in general,
space re-allocation is a contested process that must overcome the inertia embedded in current practices
(Mattioli et al., 2020). For these reasons, efforts to redistribute urban road space have largely focused on
specific interventions or at a street level but rarely at the scale of the entire urban road network. This
makes it difficult to gauge what the impacts of such a redistribution might be if it were deployed in a
coherent, connected and cohesive manner at the urban scale.

How to measure space consumption

How much space does a person use when travelling? The answer to that question – differentiated by
mode, travel distance and speed – can provide a good basis for discussions around the efficient allocation
of urban road space. Though the tension between the consumption and allocation of space was noted
early in the deployment of cars in cities, relatively little effort has been made to develop and adopt suitable
metrics to measure the former compared to the latter. This is not for lack of a conceptual basis for
measuring the consumption of urban space by vehicles – the framework for which is described below.

An indicator for measuring space consumption: Square metre per hour

One of the difficulties in answering the space consumption question is that the amount of space consumed
by a person travelling has both static and dynamic elements. It is linked to the vehicle’s spatial footprint,
the number of people travelling in or on the vehicle, the amount of time the vehicle is stored during a
round or multi-legged trip, the trip distance and the vehicle’s travel speed. These components are not
captured in traditional capacity metrics such as speed-flow relationships or other throughput measures.

 STREETS THAT FIT: RE-ALLOCATING SPACE FOR BETTER CITIES © OECD/ITF 2022                                   13
ALLOCATING STREET SPACE: HOW AND WHY?

Similarly, they are not captured in the most common aggregate measures of transport demand such as
vehicle-kilometres or passenger-kilometres travelled. Furthermore, they require a composite indicator
that captures both the static (parking/vehicle storage) and dynamic (amount of space exclusively occupied
while in movement) elements of space consumption. In 1973, Louis Marchand, a senior engineer at Paris’s
public transport operator, the RATP, developed an indicator to address this gap: the square metre hour
occupied by a vehicle or person-trip (m2.h) (Héran and Ravalet, 2008). This indicator has two components:
the static consumption of space related to the on-trip storage of the vehicle and the dynamic consumption
of space related to the exclusive occupation of road space by the vehicle during the trip.

Static space consumption: Parking and vehicle storage space

Trips using private vehicles involve parking the vehicle at one or several locations. This temporary storage
of the vehicle requires space that may be located on the street or in off-street or multistorey car parks.
The space required is proportional to the vehicle footprint, but for practical purposes, the amount of space
consumed can be considered as the footprint of a standard parking space. The m2.h for parking and vehicle
storage is thus simply the amount of space consumed multiplied by the amount of time the space is
occupied. This is an invariable linear relationship, although the size of a standard parking space is variable
across different geographical contexts and has increased over time as vehicles have increased in size.
Vehicles are stored whenever they are not used – most typically at or near the owner’s residence. This
storage also consumes space but is not related to the vehicle trip, per se, but rather to the storage space
necessary to own a vehicle. For this reason, the rest of this report only focuses on trip-based parking space
consumption.

            Figure 2. Different standard parking space footprints in Europe and the United States

Source: Dimensions (n.d.), www.dimensions.com.

There is no single international parking space dimension. In many cases, the size of on- and off-street
parking spaces are set by traffic engineering or other bodies based on average vehicle sizes, which serve
as guidance rather than a requirement. Sometimes the guidance is set at the national level and at other
times by regional or local authorities. In practice, this means that these dimensions are variable across

14                                            STREETS THAT FIT: RE-ALLOCATING SPACE FOR BETTER CITIES © OECD/ITF 2022
ALLOCATING STREET SPACE: HOW AND WHY?
different cities, regions and countries with sometimes significant discrepancies. The most important of
these discrepancies emerges in North America, where average car footprints are larger than most other
regions, resulting in larger average parking space dimensions (Figure 2). The dominant share of sports
utility vehicles (SUVs) and pick-up trucks in the North American fleet, alongside a car fleet that is already
larger on average than other world regions, explains the shift towards larger parking space dimensions.
Figure 3. Vehicle footprints of cars sold in Europe by model launch year, 1960-2019
13
12
11
m2) m2 )
* length,
10
(W*L,
9
(width
Car footprint
8
Car footprint
7
6
5
4
1960 1970 1980 1990 2000 2010 2020
Source: Based on car dimension data from Teoalida (n.d.).
Over time, the growth in average vehicle size has also placed upward pressure on parking size dimensions.
Car footprint dimensions for new models sold in Europe (by launch year) have increased by approximately
18% from the 1960s to the 2010s (Figure 3). This increase has been even larger in North America due to
the rapid penetration of SUVs in the market (US EPA, 2019). Launch year dimension statistics hide growth
within each car model over its production lifetime. Here too, dimensions have increased over time,
reflecting the generalised trend in the growth of vehicle footprints (Figure 4). Parking space dimensions
include additional space for accessing the vehicle and manoeuvring in and out of the parking space. The
growth in vehicle size creates pressure to increase the storage space allocated to vehicles, just as
discussions are underway in many cities to re-allocate that space to other uses.
STREETS THAT FIT: RE-ALLOCATING SPACE FOR BETTER CITIES © OECD/ITF 2022 15ALLOCATING STREET SPACE: HOW AND WHY?
Figure 4. Change in dimensions of selected vehicle models from launch year to present
Toyota Corolla Volkswagen Golf BMW 3 series
1974 1974 1975
3.95 m 3.71 m 4.37 m
2019 2019 2019
4.63 m (+17%) 4.26 m (+14%) 4.71 m (+7%)
Source: Based on data and drawings from The Blueprints (n.d.).
The footprint of on-street parking varies according to its configuration. Parking parallel to the curb
consumes the least space but other on-street parking arrangements (e.g. angled parking) consumes more
space. Off-street parking consumes even more space as the auxiliary space required to access and
manoeuvre in standard or multistorey car parks must also be included. The differences are significant and
should be accounted for in space consumption calculations. In a comprehensive study looking at space
consumption in the Ile-de-France region of France, Frédéric Héran compiled a set of “standard” European
parking space use values based on an empirical review (Table 1). The values in this table serve as a good
starting point for calculating the static space required to store various vehicles. In other regions, and
particularly in North America, they should be adjusted to reflect prevailing dimensions. The values are
adjusted by typical load factors to give per-person static space consumption values.
The values for the static consumption of space by buses is based on observed values in bus depots in the
Ile-de-France region. This space is analogous to the space required for home parking by vehicles in
residential areas and as such, it is not clear whether this space should be considered trip-based parking
since buses do not park on-trip. Buses do, however, temporarily occupy space at bus stops —
approximately 24 linear metres for a 12-metre bus accounting for manoeuvring space (Héran and Ravalet,
2008). Because of its short-term nature, the exclusive use of space by buses can be subsumed into the
dynamic aspect of the m2.h indicator and is related to the bus’s average commercial speed. In practice,
because of the need to keep stops accessible to buses, space at bus stops is often exclusively allocated to
buses and is thus not available for other uses. So, while the bus’s consumption of space is limited, the
allocation of space to buses is more extensive.
16 STREETS THAT FIT: RE-ALLOCATING SPACE FOR BETTER CITIES © OECD/ITF 2022ALLOCATING STREET SPACE: HOW AND WHY?
Table 1. Static space consumption per person by mode and configuration
Mode and configuration Parking Ancillary and Space Average load Static space
space per manoeuvring consumption factor per vehicle consumption
vehicle (m2) space (m2) per vehicle (persons/vehicle) per person
(m2) (m2)
Car 10 10 1.3 7.7
(on-street, parallel)
Car 12 12 1.3 9.2
(on-street, angled)
Car (car park) 10 15 25 1.3 19.2
Car (multistorey car park) 15 10 25 1.3 19.2
Motorised two-wheeler (on-street) 1.5 1.5 1.05 1.4
Motorised two-wheeler (car park) 1.5 1.0 2.5 1.05 2.4
Bicycle (stand) 0.8 0.8 1 0.8
Bicycle (two-level rack) 0.4 0.2 0.6 1 0.6
Bus (12-metre)* 42 28 70 17 4.1
Bus (12-metre, peak period)* 42 28 70 50 1.4
(pedestrian) (0.25)
* For an 18-metre articulated bus, multiply by 1.5
Source: Héran (2012).
Dynamic space consumption: Movement space
The exclusive occupation of space by vehicles in movement is a function of vehicle size, inter-vehicle
spacing, the amount of lateral space consumed in normal operation and the amount of time the space is
occupied – itself a function of vehicle speed. Therefore, a large car travelling fast requires more space and
exclusively occupies a greater linear and lateral spatial footprint in traffic. However, because it travels
through that space at greater speed, it occupies that space for less time. A bicycle, on the other hand,
takes little space, has a smaller spatial footprint as it moves but occupies that space longer due to its lower
speed. Speed consumes space as it increases the vehicle’s dynamic spatial footprint, but speed also means
that vehicles occupy that space for less time. However, of the two effects, the speed effect is the greatest
– on balance, the faster a vehicle travels, the more space it consumes.
The relationship between space consumption and throughput is an inverse one. For any given width of
carriageway, the more space consumed by a vehicle, the less throughput is achieved. Table 2 shows
maximum vehicle and person throughput values for different modes and carriageway widths. For public
transport services, it accounts for standard service-related headways and peak hour load factors.
STREETS THAT FIT: RE-ALLOCATING SPACE FOR BETTER CITIES © OECD/ITF 2022 17ALLOCATING STREET SPACE: HOW AND WHY?
Table 2. Maximum vehicle and person throughput by mode for different carriageways
Mode Vehicles Inter-vehicle Average Hourly Width of Hourly
per hour headway for load factor throughput carriageway throughput per
and public transport (persons per of people metre of
direction (minutes) vehicle) per direction carriageway
width
Walking 9 000 3 3 000
Bicycle 9 000 1 5 000 3 1 667
Bus (12-metre in traffic) 20 3.0 70 1 400 3 467
Bus (18-metre, 25 2.4 100 2 500 3.5 714
dedicated lane)
Tramway 30 2.0 300 9 000 3 3 000
Subway 40 1.5 800 32 000 3.5 9 143
Commuter rail 20 3.0 1 000 20 000 4 5 000
High-speed commuter 30 2.0 2 000 60 000 4 15 000
rail
Car (motorway) 2 400 1.25 3 000 3.5 857
Car (urban street) 900 1.25 1 125 3 375
Source: Héran and Ravalet (2011).
Strictly from a throughput perspective, the potential for public transport and active mobility is orders of
magnitude greater than that of cars – these modes simply can convey more people per unit of space
available. However, they are unable to serve all parts of the urban region (for rail-based modes), nor can
they offer the same travel speeds (for active and bus-based modes) – though at peak hours, this differential
decreases significantly in urban centres. Further, the arrival of new modes such as electric kick scooters
and electric bicycles have increased achievable speeds and ranges for light mobility modes.
Throughput metrics only indirectly reflect dynamic space consumption. Marchand’s early work at the RATP
sought to capture this dimension more explicitly and accurately with the notion of the dynamic surface,
which captures the exclusive occupation of space by a vehicle as it travels.
The dynamic surface is calculated by multiplying the sum of the length of the vehicle (in metres) and the
inter-vehicle spacing (in metres) by the average lane width per direction of travel (also in metres). Because
vehicle size plays a minimal role in inter-vehicle distancing (this distance is a factor of vehicle mass and
speed) and because lateral width necessary for safe operation (allowing for natural weaving and sufficient
separation from other vehicles) is also a factor of vehicle speed, there is little difference in the dynamic
surface of small versus large vehicles operating at the same speed and what difference there is relates
more to the mass of the vehicle rather than their footprint (Héran and Ravalet, 2011).
Inter-vehicle spacing is a function of reaction time and stopping time – both, in turn, are a function of
speed. Reaction time for a normal driver is approximately one second – this must be multiplied by the
speed to obtain the reaction distance component of the dynamic surface. Stopping time is the amount of
time it takes from the moment the vehicle starts braking to the moment it stops moving. This time must
18 STREETS THAT FIT: RE-ALLOCATING SPACE FOR BETTER CITIES © OECD/ITF 2022ALLOCATING STREET SPACE: HOW AND WHY? also be multiplied by speed (and adjusted for the rate of deceleration for the vehicle’s mass and coefficients for surface friction and gravity) to obtain the stopping distance. However, (Héran and Ravalet, 2011) note that inter-vehicle distances are, in practice, much shorter than the theoretical function would predict and have decreased over time (with, for example, the introduction of ABS). For this reason, he suggests basing the inter-vehicle distance component of the dynamic surface equation on observed values on crowded urban roads (e.g. the Paris ring road). This results in the following function to calculate the inter-vehicle distance component of the dynamic surface (Héran and Ravalet, 2011): IVD= V+ 0.01371 V2 Where: IVD=Inter-vehicle distance in metres, and V=Speed in metres per second The lateral component of the dynamic surface calculation is comprised of the width of the vehicle, an additional width necessary for the safe operation of the vehicle in traffic (due to natural weaving and lateral separation from other vehicles) and an additional adjustment for the space required to operate the vehicle on a roadway (junctions, shoulders, etc.). The average space consumed per lane of travel can be simplified based on observed values (again from the Paris region) such as speed and the number of junctions. Thus the lateral component of the dynamic surface is represented in the following formula (Héran and Ravalet, 2011): ALSL= 2.2 + 0.0052 V2 Where: ALSL= Average Lateral Space consumption per lane in metres, and V= Speed, in metres per second The combination of the inter-vehicle and lateral components gives the dynamic surface function: DS = (L + IVD) * ALSL Where: DS = Dynamic Surface IVD = Inter-vehicle distance in metres V = Speed, in metres per second The dynamic surface increases with the square of speed which explains the preponderant weight of speed in the overall calculation of space consumption. However, as noted, speed also means that as a vehicle travels faster, it occupies that space for less time. Thus Marchand’s specification for the m2.h indicator also accounts for travel speeds and trip lengths. The resulting function for calculating m2.h/km is (Héran and Ravalet, 2011): DSC = DS * Tk Where: DSC = Dynamic space consumption per vehicle per kilometre travelled in m2.h DS = Dynamic Surface Tk = Time it takes to travel one kilometre Since Tk = 1/(3.6 V) and given that V is expressed in metres per second, the dynamic space consumption formula can be simplified as (Héran and Ravalet, 2011): DSC = SD / (3.6 V) STREETS THAT FIT: RE-ALLOCATING SPACE FOR BETTER CITIES © OECD/ITF 2022 19
ALLOCATING STREET SPACE: HOW AND WHY?

The above formula reflects a theoretical basis for approximating the consumption of space by mode. In
practice, it must be adjusted to reflect differences between modes. Héran and Ravalet (2011) note that
urban traffic speeds are highly variable and cars and other motorised vehicles may travel at anywhere
between 15 km/h (and slower) to 50 km/h (or faster) during the same trip. To account for this variability,
he recommends adjusting the dynamic space consumption resulting from average speeds upwards by
50%. The same adjustment should be applied to motorised two-wheelers who have limited opportunities
to bypass other vehicles in dense urban traffic. Pedestrians, cyclists and e-push scooters experience much
more even travel speeds – especially where dedicated infrastructure is available (pavements and light
mobility lanes).
Combining the dynamic and static space consumption functions outlined above and applying different
specific trip characteristics and speeds provides insight (and data) on the actual space consumed by
different transport modes per trip and, when trip distances and numbers are available, in aggregate.
Figure 5 shows the space consumed per person for two different trips. The first is comparable to a
shopping trip with a 6 km round-trip distance and a two-hour dwell time. The second is comparable to a
typical work trip with a 10 km round-trip distance and an eight-hour dwell time.
What these examples (and others based on the functions outlined here) show is that the consumption of
space varies by mode but that the most space-intensive by far is the car. It also shows the spatial efficacy
of public transport in comparison to all other modes (at sufficient load factors) and underscores the impact
that speed plays since the 5 km/h difference in speeds between motorised two-wheelers and cars is
sufficient to raise the dynamic space consumption of the former over the latter.
Figure 5 shows the impact that parking plays on space consumption, since as dwell time increases, so too
does the space exclusively occupied by vehicles. Finally, load factors play an important role in influencing
space consumption per person. Increasing the load factor of cars to three people per vehicle would almost
equalise the dynamic consumption of space between cars and bicycles. Likewise, decreasing the load
factor of buses to ten people per bus (not unusual in off-peak hours) would triple its dynamic spatial
footprint (although it would still consume less than half the space of a car occupant at typical load factors).
The m2.h indicator serves to better differentiate modes by their actual consumption of space. As noted
earlier, in urban areas, especially in core and other locally dense areas, this space is rare and so it makes
sense to prioritise the most space-efficient modes and uses. However, the optimisation of the use of space,
although important, is only one factor to consider when allocating space.
From a societal perspective, it makes sense to give space to active modes as these provide significant
health benefits on top of their mobility benefits (ITF, 2013). From a physical accessibility perspective, it
makes sense to give space for those who may require a car or another vehicle to get around due to their
mobility impairments. Finally, as noted earlier, individuals value the use of the car not only because it
allows them to access numerous destinations relatively quickly, but also because they derive other amenity
values such as carrying loads, giving others a ride and enjoying a private space in which to travel. In many
circumstances, some of these amenities could also be delivered by other modes (cargo bikes can carry
many typical carloads; cycling side-by-side on safe infrastructure provides an analogous level of privacy as
travelling within a car; travelling by public transport allows people to read or interact with internet-based
services and social media) but these practices have rarely been facilitated by the provision of car-based
infrastructure.

20                                             STREETS THAT FIT: RE-ALLOCATING SPACE FOR BETTER CITIES © OECD/ITF 2022
You can also read