Coupled Thermal-Electrical Modeling of Integrated Photovoltaic Systems - Timofey Golubev, Ph.D.
←
→
Page content transcription
If your browser does not render page correctly, please read the page content below
Coupled Thermal-
Electrical Modeling of Integrated
 Photovoltaic Systems
 Timofey Golubev, Ph.D.
 Research Scientist
Outline
• Introduction
• Methods
• Examples
 • Residential Rooftop PV
 • Evaluating the Energy Production of Vehicle-Integrated
 Photovoltaics (VIPVs)
 • Electric Vehicle Energy Consumption with On-board PVs

 2
Introduction

 3
PV Industry Background
• Solar power the fastest growing renewable energy source
• U.S. solar power capacity has experienced an average annual
 growth rate of 33% in the last decade [1]
• Global market of $160 billion in 2021 [2]

 4
 From IEA (2021) [1]
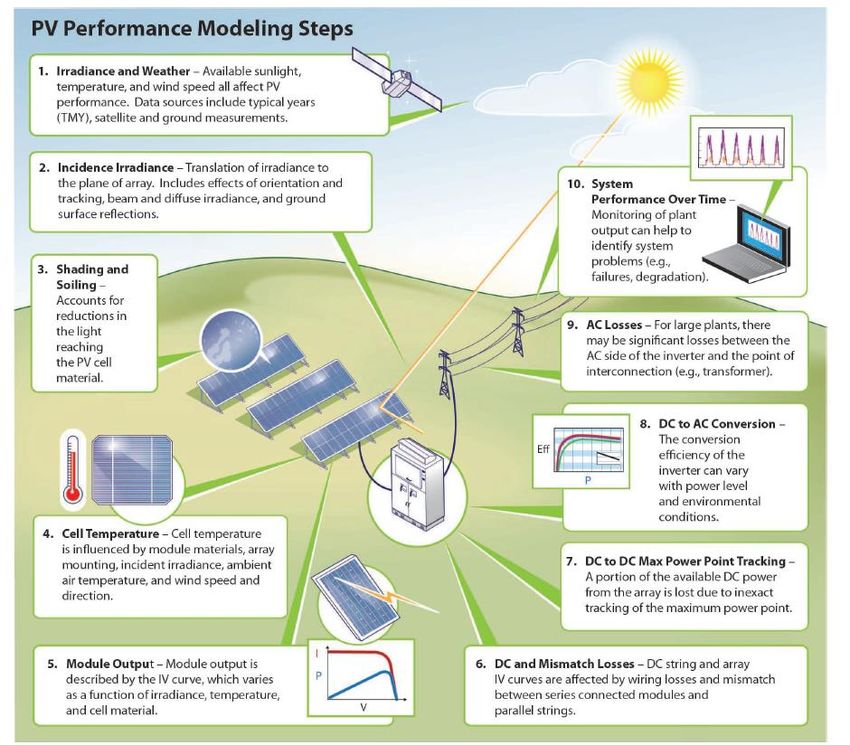
PV System Modeling

 5
 From Hansen and Martin. SAND2015-6700 Technical Report
Why Consider PV Temperatures?
• Solar cell efficiency typically
 decreases with increasing
 temperature

• Performance is often rated at 25 °C,
 while cells in operation reach
 significantly higher temperatures

• Therefore, cell T is needed for
 accurate energy production
 prediction
 6
Limitations of Empirical Cell
 Temperature Models
 • Many PV simulation libraries/software
 include empirical models for cell
 temperature

 • Often these are used with default
 coefficients which are provided by the
 library based on literature

 • Large disagreement between models

 7
[3]
Advantages of Heat-Transfer Solver
for PV Modeling
• Improved accuracy of temperature predictions for solar modules,
 especially if that are integrated into structures (e.g., vehicles and
 buildings)
• Analysis of the impact of PVs on the structures’ temperatures
 • E.g.: How could cabin T and occupant comfort change if PV films
 are integrated into building windows or vehicle sunroof?
• Design of PV cooling techniques

 8
PV Modeling with TAITherm

 9
Coupled Thermal-Electrical
 Model
 • PV electrical equations solved at
 end of each thermal simulation
 time-step
 • Model inputs use information
 available from manufacturer
 datasheets

 10
[3, 4]
TAITherm Transparent Materials
Modeling

• Specify transmittance and reflectance or each layer as band-averaged
 values or spectral curves in TAITherm
 • Curves will be band-averaged based on the solar spectrum

 11
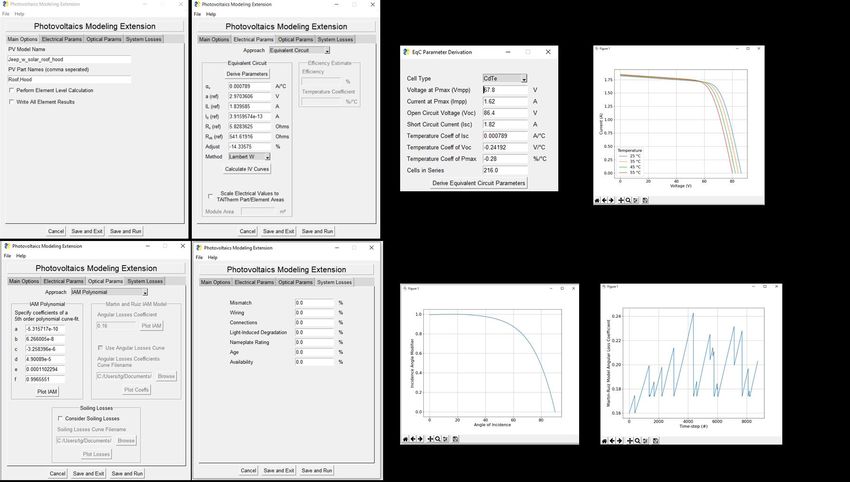
PV Modeling Extension Prototype
Demo

 12
Example Application: Residential
 Rooftop PVs

 13
[3]
Example Residential Rooftop PV
Model

 14
Residential Rooftop PV Model:
Considering Soiling Losses
• Soiling loss can be split into a transmission and angular loss
 contribution

 15
Residential Rooftop PV Model:
Considering Soiling Losses

 16
Example Application: Evaluating
the Energy Production of Vehicle-
Integrated Photovoltaics (VIPVs)

 17
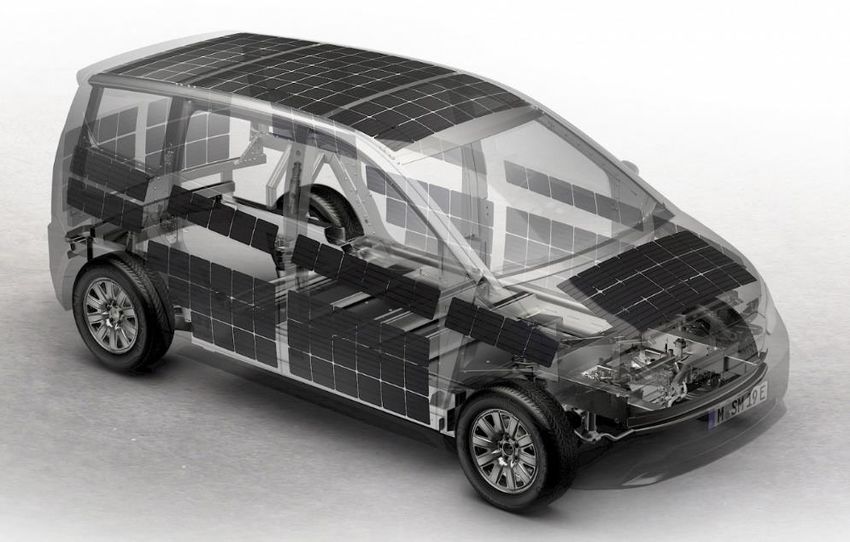
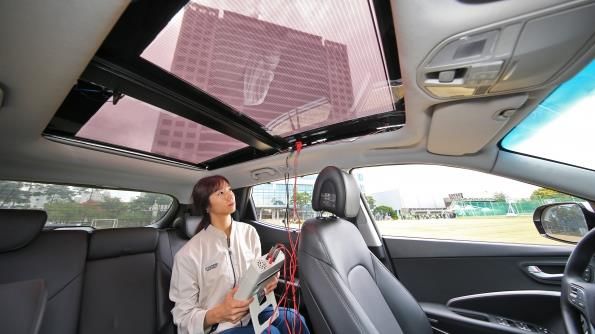
Vehicle-Integrated Solar Panels
• Extend the range of electric vehicles
• Power an auxiliary battery for secondary
 electronics systems in both internal
 combustion engine and electric vehicles
 Hyundai (2018). Translucent solar roof engineering.

 18
 Sono Motors. Up to 34 km/day. Expected 2022. €25,500 2020 Hyundai Sonata Hybrid
Vehicle-Integrated Solar Panels

 • Predicted 3.8 kWh of energy production per 8 hours in the sun
 in Phoenix, AZ in July
 • 3% angular losses and 13% thermal losses
 19
[3, 4]
Wavelength-Selective Transparent PVs
 • Absorb UV/IR wavelengths, while transmitting visible light

 Data from A. Antil et al. Appl. Energy, 2020 Data from Y. Ding et al. Sol. Energy Mater. Sol. Cells, 2015
Fig. from Traverse et al. Nature Energy, 2017

 20
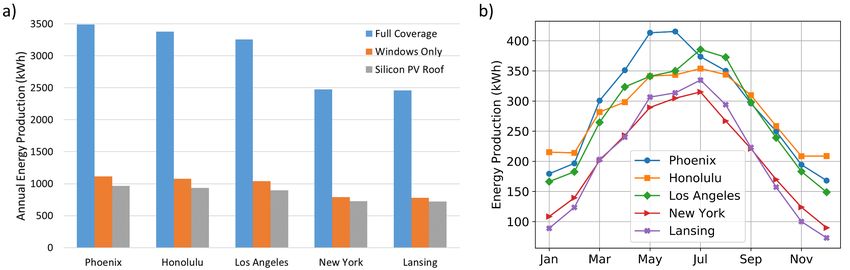
Potential of Vehicle-Integrated
 Transparent PVs
 • Comparison of energy production for different levels of PV
 coverage on vehicle and different locations
 • Realistic weather and irradiance for each location was taken
 from TMY data from NSRDB

 21
[3, 4]
VIPV Feasibility for HVAC
• Cooling energy needs of an HVAC system during moderate
 length trips could be entirely supplied by VIPV system

 Impact of Desired Vehicle Temperature on
 EV Energy Consumption Modeled Energy Production after 8 hours on a
 sunny summer day in Phoenix, AZ
 Outside Desired Energy Full TPV Coverage 13.8 kWh
 Temp Vehicle Temp Consumption
 Windows Only
 4.5 kWh
 110 °F 70 °F 1.5-2 kW TPVs
 Si PV Roof 3.8 kWh
 110 °F 77 °F 1 kW
 110 °F 84 °F 0.5 kW
 Data is for an electrically driven heat pump. From
 https://avt.inl.gov/sites/default/files/pdf/fsev/auxiliary.pdf

 22
Example Application:
 Electric Vehicle Energy
 Consumption with On-board PVs

 23
[5]
Approach Overview

 PV power

 24
TAITherm Vehicle Modeling Steps

 Assume vehicle starts in Transient restart into 40 min. Transient restart into 40
 thermal equilibrium with Transient restart into
 morning commute, adding the min. afternoon commute,
Find garage garage. Run SS on vehicle parked car model. Car is
 driver to the vehicle. HVAC is adding the driver to the
temperature at start in bounding box set to parked in an unshaded
 regulated based on driver’s vehicle. HVAC is regulated
of commute garage temperature to set area for ~8 hours.
 thermal comfort (PMV). based on driver’s thermal
 initial conditions. comfort.

 Time-series of HVAC power use and PV power generation

 25
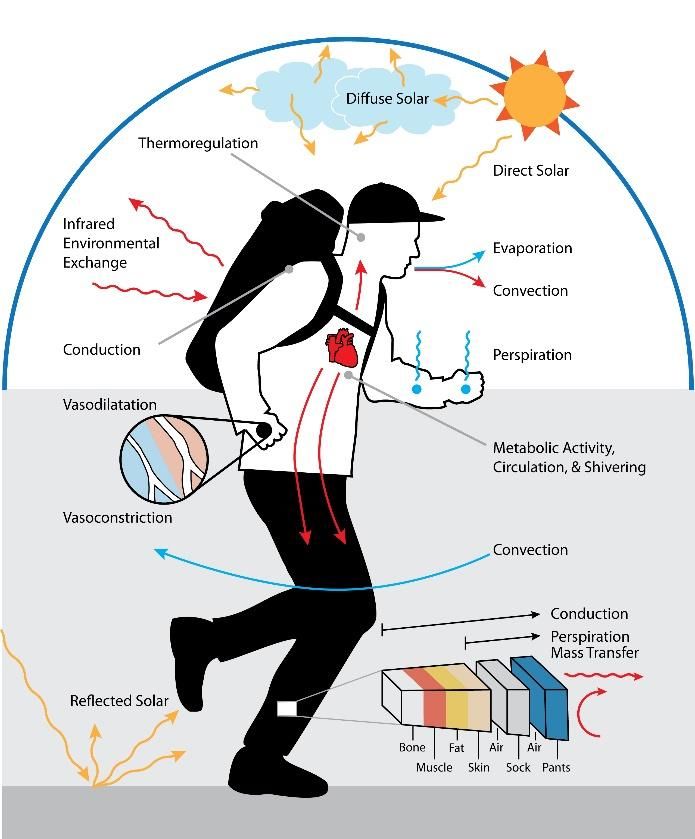
Predicted Mean Vote for HVAC Control
 • A comfort metric developed by Fanger (and standardized by
 ISO7730)
 • Predicts mean value of votes of large group of persons on a 7-
 point thermal sensation scale ranging from -3 (cold) to +3 (hot)
 • Considers activity level, clothing resistance, air temperature,
 mean radiant temperature, air velocity, and relative humidity
 • An output of the TAITherm Human Thermal Model

 26
[6]
TAITherm Human Thermal Model
• 20 body segments, with layers
 representing tissues

• Solves bio-heat transfer equation

• Predicts tissue, blood, and core
 temperatures under:
 • Varying environmental conditions
 • Varying activity levels
 • Adjustable clothing levels
 Mechanisms considered by TAITherm
 Human Thermal Model 27
Human Comfort for HVAC Power
Consumption
• HVAC control algorithm implemented in a User Routine
• = ( , ( )/ ), = ( , ( )/ )
 Comfort HVAC Air Temperature

 28
EV Power Model Inputs
• EV parameters
• Drive cycle (speed time-series)
• Weather
• HVAC load and PV power from TAITherm
 cabin model

 29
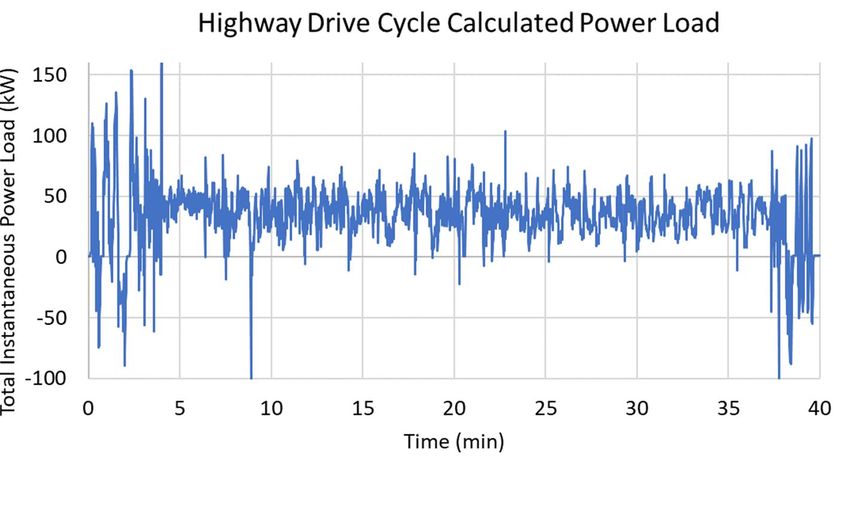
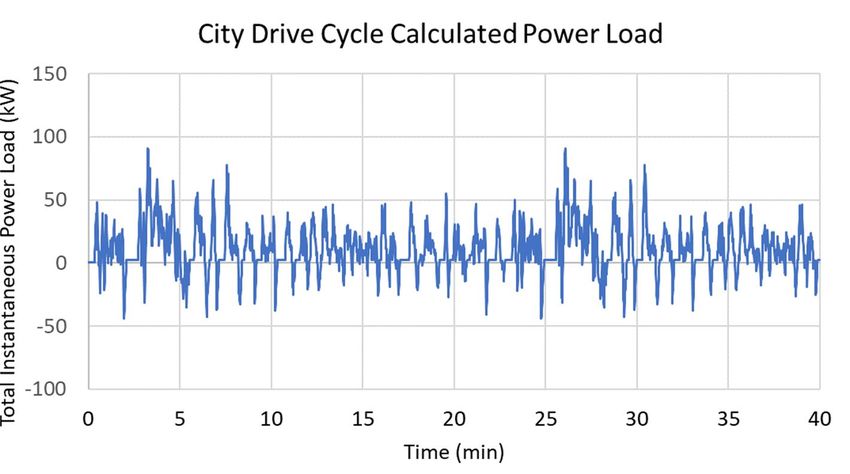
EV Power Model Outputs
• Total power load time-series
• Power loads and losses from individual components of EV

 30
Case Study
• Modeled EV energy balance over 1 day for 2 drive cycles in each
 of 4 seasons in Phoenix, Arizona and Detroit, Michigan
 • 40 min morning commute + 8 hours parked outside + 40 min
 afternoon commute

 Parked Parked

 31
Results: Phoenix, Arizona
• VIPVs generate 10-23% and 3-8% of consumption (or 4-11 km of
 range) of city and highway drive cycles, respectively

 32
Results: Detroit, Michigan
• VIPVs generate 5-19% and 2-7% of consumption (or 2-9 km of
 range) of city and highway drive cycles, respectively

 33
Results: Impact on HVAC Load
• HVAC load significantly
 reduced in cooldown
 scenarios due to VIPV’s
 converting some of solar
 radiation to electricity
 instead of heat

 34
Conclusions
• We demonstrated how TAITherm could be used for EV energy
 consumption with consideration of VIPVs and HVAC loads
• For a full size SUV, with non-optimized aerodynamics (0.371 drag coeff.),
 amount of range extension expected from integration of conventional
 solar cells into the roof and hood is 2-11 km per day
 • More aerodynamic or lighter weight vehicles would get more range
 from VIPVs
 • ~3x more energy could be gained by achieving full vehicle coverage

 35
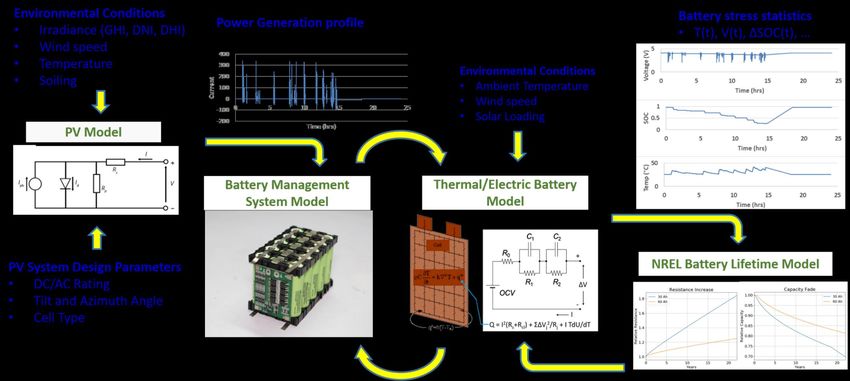
Future Work
• PV thermal-electrical model and EV energy model could be coupled with
 thermal-electrical battery performance and lifetime models for more
 detailed analysis.
 Potential Future Modeling Approach

 36
References
1. https://www.seia.org/solar-industry-research-data
2. Precedence Research, “Solar Photovoltaic Market Size to Worth Around US$250.6 BN
 by 2030”, 2022.
3. T. Golubev, “Multi-physics modeling and simulation of photovoltaic devices and
 systems”, PhD thesis, Michigan State University, 2020, https://d.lib.msu.edu/etd/49526
4. T. Golubev and R. R. Lunt, “Evaluating the Electricity Production of Electric Vehicle-
 Integrated Photovoltaics via a Coupled Modeling Approach”, 2021 IEEE 48th
 Photovoltaic Specialists Conference
5. T. Golubev et al., “Analyzing the Impact of On-Board Photovoltaics on Electric Vehicle
 Energy Consumption”, Accepted to 2022 IEEE Transportation Electrification
 Conference, Anaheim, CA, June 2022.
6. P. O. Fanger, “Thermal Comfort”, Danish Technical Press, Copenhagen, 1970.

 37
Thank you

US Location Timofey Golubev, Ph.D.
ThermoAnalytics HQ tg@thermoanalytics.com
23440 Airpark Blvd. www.thermoanalytics.com
Calumet, MI 49913

 38
You can also read


