Cost-Benefit Analysis and Emission Reduction of Energy Efficient Lighting at the Universiti Tenaga Nasional
←
→
Page content transcription
If your browser does not render page correctly, please read the page content below
Hindawi Publishing Corporation e Scientific World Journal Volume 2014, Article ID 745894, 11 pages http://dx.doi.org/10.1155/2014/745894 Research Article Cost-Benefit Analysis and Emission Reduction of Energy Efficient Lighting at the Universiti Tenaga Nasional G. S. B. Ganandran,1 T. M. I. Mahlia,1,2 Hwai Chyuan Ong,3 B. Rismanchi,3 and W. T. Chong3 1 Department of Mechanical Engineering, Universiti Tenaga National, 43000 Kajang, Selangor, Malaysia 2 Department of Mechanical Engineering, Syiah Kuala University, Banda Aceh 23111, Indonesia 3 Department of Mechanical Engineering, Faculty of Engineering, University of Malaya, 50603 Kuala Lumpur, Malaysia Correspondence should be addressed to Hwai Chyuan Ong; onghc@um.edu.my Received 22 April 2014; Accepted 15 June 2014; Published 15 July 2014 Academic Editor: Hua Bai Copyright © 2014 G. S. B. Ganandran et al. This is an open access article distributed under the Creative Commons Attribution License, which permits unrestricted use, distribution, and reproduction in any medium, provided the original work is properly cited. This paper reports the result of an investigation on the potential energy saving of the lighting systems at selected buildings of the Universiti Tenaga Nasional. The scope of this project includes evaluation of the lighting system in the Library, Admin Building, College of Engineering, College of Information Technology, Apartments, and COE Food court of the university. The main objectives of this project are to design the proper retrofit scenario and to calculate the potential electricity saving, the payback period, and the potential environmental benefits. In this survey the policy for retrofitting the old lighting system with the new energy saving LEDs starts with 10% for the first year and continues constantly for 10 years until all the lighting systems have been replaced. The result of the life cycle analysis reveals that after four years, the selected buildings will bring profit for the investment. 1. Introduction amount of energy could be saved [3]. The study by Trifunovic et al. [4] showed a potential energy saving of up to 27% in In order to ensure a comfort, safe, and productive environ- residential and 30% in the commercial sector. ment, the lighting system must provide suitable condition The process of replacing inefficient light systems with with desired illumination level. At the same time, lighting more advanced and high efficiency systems are called light- system needs to be designed in such a way that consumes ing retrofits. The success of a retrofit program depends the optimum amount of energy. In this modernized era, light on different parameters, such as policies and regulations, source can produce the equal light compared with the tradi- occupant’s expectation, building specification, and human tional lighting systems used 20 years ago, while consuming factors, which has the highest effect among other parameters half the energy input. Malaysia as a fast developing country [5]. These parameters are highly interdependent and could has to look forward to energy efficiency technologies due to have a significant impact on the design. several factors such as cost increment in building new power The increase in energy consumption contributes signifi- plants, continuing shortfall between electricity demand and cantly to the environment in consequences of the emission supply, and competing needs for investment capital. production. Almost 80% of the world electricity is produced Among all the electric consumers, lighting has one of from the combustion of fossil fuels. This eventually has the highest shares in the residential and commercial sector. changed the pattern of emission production. The gases that Lighting accounts for approximately 20% to 30% of the elec- are being produced by burning the fossil fuels are “green- tricity consumption worldwide [1, 2]. By switching towards house gases” which contributes to global warming, ozone more energy efficient lighting technologies, a considerable depletion, acid rain, and other negative impacts [3].
2 The Scientific World Journal

1.1. Incandescent Light Bulbs. Incandescent light bulbs have et al. [12] found that LED lamps are more expedient than
been the most commonly used light sources over the past conventional bulbs and also advance in terms of environment
one and a half decade also called the “Edison Bulb.” They friendly but economical wise LEDs have higher initial costs.
have a simple technology; when connected to a power supply, Chen and Chung [13] have studied retrofitting LEDs with
the electric current heated the wires and tungsten filament to T8 fluorescent tubes; they found that by replacing 36 W T8
4,000 degrees Fahrenheit and tungsten begins to evaporate. fluorescent lamp with 20 W LED, would have around $288
Without the inert gasses (argon and nitrogen), the tungsten saving in 5 year operation.
particles would collect on the inside of the glass, causing it Ryckaert et al. [14] conduct a research on the ups and
to darken. The gasses, however, collect the tungsten particles downs of retrofitting LED tubes with T8 FL lamps. They
and send them back to the filament. However, almost 90% of analyse twelve different LED tubes and the results show that
the energy generated by an incandescent bulb is released as a one-to-one lamp replacement could lead to an inadequate
heat, not light. quantity and quality of illumination of the work plane. In
 order to address this issue, additional LEDs are required
 which consequently would decrease the potential energy
1.2. Compact Fluorescent CFL. In the past few years, incan-
 savings. In another study, Stefano [11] identified three main
descent bulb starts to give way to more efficient fluorescent
 barriers to the cost effective installation of energy efficient
(FL), compact fluorescent (CFL), and light emitting diode
 lighting technologies in offices such as low lighting system
(LED) lighting systems. CFL bulbs are one of the most
 operating hours, low cost of electricity, and high initial
successful innovations in the lighting industry; the modern
 expense of energy efficient lighting components. Vahl et
CFL bulbs last 10 times longer than traditional incandescent
 al. [15] analyse the long term sustainability of retrofitting
bulbs. They consume far less energy to produce the same
 inefficient light bulbs with CFLs and LEDs. They found
amount of light. For instance, a 15-watt CFL lamp emits the
 that generally CFLs have the highest annual cost and toxic
same amount of light as 60-watt incandescent bulb. Despite
 waste; FL tubes are the most economical alternative, but
the great advantages of CFLs they have some limitations.
 if their lifespans shorten and LED prices drop or achieve
Some CFLs do not perform well in low temperatures; it is
 higher efficiency, LED becomes the most sustainable and
possible for a CFL to produce radio frequency interference
 economically alternative.
(RFI); they are not resistant to internal shock, and they
 Mahlia [16] shows the method to calculate the potential
have mercury within their glass cover. Many commercial and
 emission from the fuel mix used by Malaysia to generate
industrial facilities have old-fashioned inefficient FL lighting
 electricity. The author uses the polynomial equation to
systems such as T-12 FL [6].
 predict the energy consumption and the emission produced
 in the years 2002 to 2020. The data of per unit of CO2 , SO2 ,
1.3. LED. The LED is what is called a “solid-state lighting” NO , and CO emitted for electricity generation was obtained.
technology, or SSL. Basically, instead of emitting light from Another study shows the prediction in a reduction on the
a vacuum or a gas, a SSL emits light from a piece of amount of CO2 and SO2 emission in the years 2010, 2020, and
semiconductor made of a positively charged and a negatively 2050 by using biogas energy compared to traditional method
charged component. The light is emitted when electrons [17].
move around within the semiconductor structure from the In Malaysia, around 40% of greenhouse gases are con-
negative to the positive layer. In the early LED models, the tributed by residential buildings [18]. Therefore, it is neces-
structure of the LED causes some of that light to get trapped sary to reconstruct or retrofit the current buildings according
inside. Therefore, the old models are generally dimmer than to the green building valuation. In this project, the current
an incandescent bulb. However, this problem has been solved lighting systems used at the Universiti Tenaga Nasional have
in the new models and LED bulbs have brightened up. Many been considered in which most of the current lamps are
researches are in progress to optimize the performance and CFL two pin bulbs and fluorescence tubes. The current
light quality of the LED bulbs and at the same time reduce lighting system consumes considerable amount of energy to
their price [7–9]. There are basically 2 types of LEDs: the provide required light. The main objectives of this project are
5 mm LED chips and the high-output chip on board (COB). to design the proper retrofit and to calculate the potential
The 5 mm LED has low light output and lacks proper thermal electricity saving and the payback period for returning the
path that is essential for maintaining the LED’s junction investment. Also the potential environmental benefits have
temperature. Normally the luminous of the 5 mm LED would been analyzed as one of the key objectives of the project.
reduce to half of its original value after 6000 hours. The COB
is known as the current choice for lighting since it offers far
superior luminous output as well as having proper thermal
path for regulating the LED’s junction temperature. Figure 1 2. Methodology
shows the Incandescent, CFL, and LED light bulbs.
 Several studies have been conducted on the benefits of The scope of this project includes evaluation of the lighting
retrofitting conventional lighting systems with the new low system in the Library, Admin Building, College of Engineer-
energy ones [10, 11]. Light emitting diode (LED) lamps are ing, College of Information Technology, Apartments, and
more effective than incandescent and CFL bulbs and have COE Food court of the university. The calculation of the
a longer lifetime while providing similar luminous. Uddin energy consumption is based on the wattage input consumed
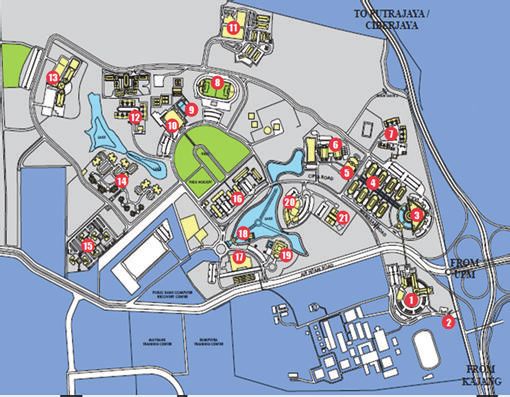
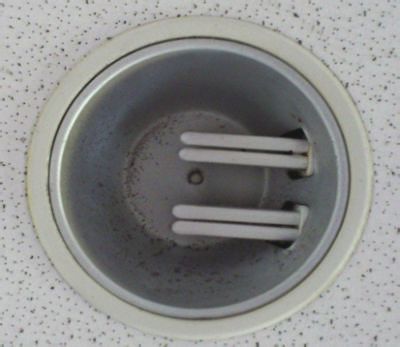
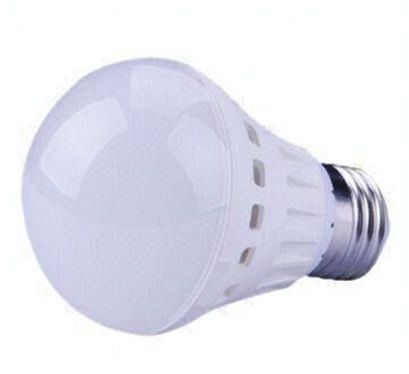
The Scientific World Journal 3

 Figure 1: Incandescent, CFL, and LED light bulbs.

 11

 13 8
 9
 12
 10
 7
 6
 5
 14 4
 16 20
 21 3
 18
 15
 17 19

 1
 2

Figure 2: Map of Universiti Tenaga Nasional. (1) Library, (2) Main Gate, (3) Administration Building, (4) Laboratory and Training Block, (5)
COE Food court, (6) College of Engineering, (7) Murni Apartment, (8) Mini Stadium, (9) Multipurpose Hall, (10) TNB Equestrian Centre,
(11) Cendekiawan Apartment, (12) College of Information Technology, (13) Staff Quarters, (14) Amanah Apartment, (15) Ilmu Apartment,
(16) Food court 1, (17) Lake Café, (18) Mosque, (19) Residence Hotel, and (20) Twin Tutorial Hall.

by light bulbs. Figure 2 shows the location of each building in 2 pin fitting G24, and Philips fluorescent tube 36 W for 4 feet
the compound. and 18 W for 2 feet. Some of light bulbs are shown in Figure 3.
 The number and type of lighting bulbs were counted The Philips liner fluorescent tubes consume 36 W for
manually during a walk-through audit; also the results were the 4 feet long linear tube. They have approximately 15000
double checked with the lighting layout to minimize the hours life time and produce 2250 lumens. The 18 W Philips
data gathering error. The lighting layout was obtained from fluorescent tube has lifetime of 15000 hours and produces
Facility Development & Management Department and it 1350 lumens. The Philips CFL 14 W bulb comes with E27
shows the location and type of light used in each building in fitting. This bulb produces approximately 800 lumens and
details. It has been identified that the most commonly used has life time of 8000 hours. This kind of bulb was used
light bulbs are; Philips compact fluorescent light (CFL) 14 W as down light where the light is concentrated in downward
fitting E27, Philips 36 W/4 Pin fitting 2G11, Philips PL-C 13 W direction. The Philips 36 W/4 pin with fitting 2G11 is made
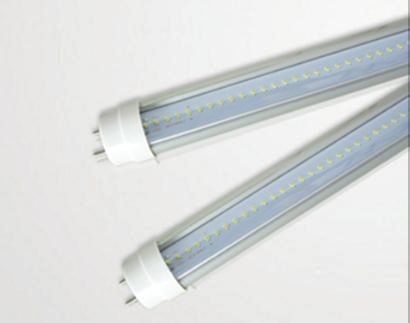
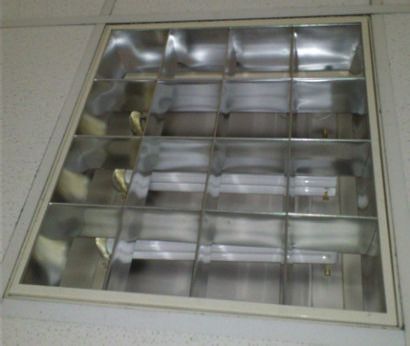
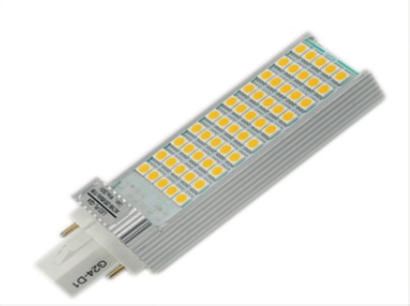
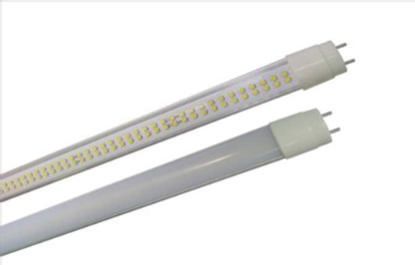
4 The Scientific World Journal

 (a) (b)

 (c) (d)

Figure 3: (a) Philips fluorescent tube 36 W 4 feet, (b) Philips compact fluorescent light (CFL) bulb 14 W fitting E27, (c) Philips 36 W/4 Pin
fitting 2G11, and (d) Philips PL-C 13 W 2 Pin fitting G24.

up of compact fluorescent tube. Around the campus this kind tubes to replace 36 W T8s varies according to manufacturers.
of tube is commonly used to light up the buildings. These The advantages of replacing LED tubes are that they are
kinds of bulbs can produce up to 2000 lumens and have a life designed to fit directly into current fluorescent fitting by
time up to 15,000 hours. The Philips PL-C 13 W 2 Pin fitting just removing and replacing the starter. LEDs cost higher
G24 produces up to 750 lumens and has life span hours up to than T8 to T5 converters but LED tubes have a significantly
10,000 hours. Use of this bulb is for down lights application. extensive lifespan of almost five times more dependent on
2 pin designed for easy setting up by just plug and pull. the quality. The types of light chosen to replace the current
 lighting system are shown in Figure 4. The light retrofitting
 has been recognized as one of the most effective methods
2.1. Ideal Lighting Technology. The fluorescent tube and CFL of reducing overall energy consumption as suggested in the
are the main lighting systems in the campus. However, ISO50001:2011 standard and recommended practice under
compared to the new technologies, they are not considered the ASEAN Energy Management Scheme (AEMAS). The
as energy efficient. The proper lighting technology that can light bulb selection in this study has been followed by the
be implemented is the LEDs. LEDs use 80% less energy above mentioned standards to ensure supplying required
than incandescent and 30% to 40% than most fluorescent lighting for staff and students in the selected buildings.
lamps. LEDs are environmental friendly where they are The 4 feet LED tube which consists of 192 LED produces
mercury free, but fluorescent and CFL contain mercury and 2100 ± 100 lumens with 50,000 hours lifetime. Efficiency
required special disposal or recycle method, which contribute can reach up to 90 lm/W. LED tube has an easy installing
to hazardous waste. LED sources have longer lifespans than method by just removing the current tube including the
traditional technologies which can save costs on replacement ballast and simple rewiring which is suggested to be done by
and maintenance. LEDs offer illumination without emitting qualified electrician. The 2 feet LED tube which is made of
harmful infrared or ultraviolet radiation. 108 LED creates 1150 ± 100 lumens with 50,000 hours life
 In current market variable LED tubes are available which span. The installation method is same as the 4 feet LED tube.
offer light output levels similar to 36 W fluorescent tubes. The 22 W/4 pin LED tube is made up of 48 pieces SMD5630
By substituting a 36 W T8 fluorescent tube by a 19 W LED LED and produces 1870 ± 100 lumens and also has 50,000
tube can save up to 48%. The wattage and cost of LED hours lifetime. This tube has a built in driver; therefore,
The Scientific World Journal 5

 (a) (b)

 (c) (d)

 (e)

Figure 4: (a) 20 W 4 feet LED tube replacing 36 W fluorescent tube, (b) 10 W 2 feet LED tube replacing 18 W fluorescent tube, (c) 22 W/4 pin
LED tube replacing Philips 36 W/4 Pin, (d) 8 W/2 pin LED replacing Philips PL-C 13 W/2 pin, and (e) 9 W LED bulb light replacing Philips
14 W (CFL) bulb.

the installation only require removing the electronic ballast of operation (OH), which is assumed 8 hours. The formula is
of the existing lighting system. The 8 W/2 pin LED is made of interpreted in the following equation [10]:
18 pieces SMD5630 LED and produces 650 ± 80 lumens. This
LED light has 50,000 hours lifespan and built in driver. Last (N × W × OH)
 EC = . (1)
but not least, the 9 W LED bulb gives an equivalent output of 1000
a 14 W CFL. The lumens output is 650 ± 70 lumens and has Total energy saving (ES) would be the difference between
30,000 hours lifespan. energy consumption of current system (ECCurrent ) and the
 retrofit lighting (ECRetrofiting ) system:

 ES = ECCurrent − ECRetrofiting . (2)
2.2. Potential Energy Saving. The total daily energy consump-
tion (EC) is calculated by multiplying the total number of Bill saving (BS) is calculated by the product of energy
lamps (N), power consumed by the lamp (W), and total hours saving (ES) with electricity tariff (ET). In this case study
6 The Scientific World Journal

Table 1: Emission factors (kg/kWh) used for estimating emission in was obtained from the predicted scenarios reported based
power plants. on local condition [16]. The scenarios are tools for ordering
 perceptions about alternative future environments, and the
 CO2 NO SO2 CO
Fuel type result might not be an accurate picture of tomorrow but
 Kg/kWh may give a better decision about the future for policy
Coal 1.18 0.0052 0.0139 0.0002 makers. Regardless of how things can actually be, both the
Natural gas 0.53 0.0009 0.0005 0.0005 analyst and the decision maker will have a scenario that
Fuel oil 0.85 0.0025 0.0164 0.0002 resembles a given future and will help researchers consider
Diesel 0.85 0.0025 0.0164 0.0002 both possibilities and consequences of the future [25, 26]. The
 result is presented in Table 2.
Table 2: The amount of CO2 , SO2 , NO , and CO emission
production per kWh of electricity generation.
 3. Results and Discussion
 Emission (kg/kWh)
Fuels 3.1. Lighting Audit. The result of the walk-through lighting
 CO2 SO2 NO CO
 audit in the above mentioned selected buildings is presented
Coal 1.1800 0.0139 0.0052 0.0002
 in Table 3. There are five common types of lighting system
Petroleum 0.8500 0.0164 0.0025 0.0002 used in the selected buildings, which are fluorescent tube
Gas 0.5300 0.0005 0.0009 0.0005 36 W and 18 W, Compact Fluorescent Light (CFL) 14 W,
 CFL 4 pin 36 W, and CFL 2 pin 13 W. The most commonly
 used bulb is the Philips 36 W/4 Pin with 2G11 fitting that
the electricity tariff is presumed to be increased about 2% makes the total number of 28431 bulbs. There are 8751 of
every year. Consider 36 W fluorescents 4 feet tube and 12674 of 18 W fluorescent
 2 feet tube. The quantity of Philips PL-C 13 W/2 Pin and
 BS = ES × ET. (3) Philips CFL bulb 14 W are 12719 and 109, respectively. The
 total number of lamp used in the selected buildings is
2.3. Payback Period and Life Cycle Cost Analysis. Payback 62684.
period (PAY) is the time taken to obtain return of the money The interview with the staff reveals that in the selected
that has been invested. In this calculation the present value buildings the normal working hours of the lighting system
money is not taken into account during the calculation. are 8 hours a day, 5 days a week. However, there are always
Consider some exceptions due to unscheduled working hours or safety
 issues.
 ΔPC
 PAY = − . (4)
 ΔOC
 3.2. Energy Consumption. Based on the latest electric tariff
Life cost analysis (LCC) is the total expenses involved during rate by the TNB, the national electricity provider, the tariff
its lifespan. A standard calculation method for LCC is by rate for the low voltage commercial building is RM0.393
summation of failure cost, maintenance cost which is known per kWh. It was assumed that the electric tariff will have
as the investment cost (PC), and the yearly operation cost around 2% increase each year [27]. In this survey the policy
(OC) as presented in the following: for retrofitting the old lighting system with the new energy
 saving LEDs starts with 10% for the first year and continues
 LCC = PC + (PWF) × (OC) . (5) constantly for 10 years until all the lighting systems have been
 replaced.
2.4. Decrement in Emission. Carbon and Hydrogen are con- The result for total energy consumption of the existing
sidered as the main constituent of most fuels, followed by a lighting system is presented in Table 4. The total electricity
small portion of sulphur. Combustion involves an oxidation consumption for the lighting application of the selected
reaction, in which the necessary oxygen is usually provided buildings is around 13,868.46 kWh per day. Meanwhile, the
by air, a mixture of oxygen, and nitrogen [19–21]. In Malaysia, total consumption of electricity per day for the LED light
natural gas is used as the main fuel for power generation would be around 8,239.8 kWh that shows the potential
[22]. The emission production (EM) is equal to emission 40.59% saving.
factor (EF) multiplied by the amount of fuel consumed (FC). Consequently around 1,463,450.56 kWh of energy and
Therefore, the emission ( ) due to using fuel ( ) in the year RM 517,622 of the bill can be saved each year, if all the
( ) can be calculated with the following [23]: existing lighting systems have been replaced with the energy
 saving LEDs. Table 5 presents the energy consumption of

 EM = EF × FC . (6) the proposed LED system in 10 years. It is shown that by
 increasing the percentage of the retrofitted lighting systems
The potential emission production of each fuel based on the overall energy consumption decreased. In 2024, when full
Malaysian condition is summarized in Table 1 [24]. retrofitting has been achieved the energy consumption will
 The predicted amount of emission produced in the remain constant if the duration of usage of light is supposed
process of generating electricity in the years 2014 to 2024 constant.
The Scientific World Journal 7

 Table 3: Number of light collected for each building.

 Types of light used
Buildings
 Fluorescent tube 36 W 4 feet CFL 14 W 13 W 2 pin 2 pin CFL 36 W Fluorescent tube 18 W 2 feet
BA Admin 396 0 2372 5136 93
BB 5 14 244 816 8
BC 2 10 404 888 4
BD 20 11 124 204 4
BE 46 18 296 924 4
BF 44 10 200 102 4
BG 2 12 336 1122 4
BH 10 10 248 288 4
BJ 18 12 270 924 4
BL 56 0 51 2154 36
BM 105 0 786 1929 38
BN 61 0 335 3609 27
BV 8 0 0 252 135
Food court 108 12 0 0 0
COIT BW 286 0 3212 4989 97
Amanah 1933 0 605 0 1824
Murni 1320 0 0 0 3698
Ilmu 1893 0 612 0 1812
Cendekiawan 1056 0 0 0 4752
Library 1382 0 2624 5094 126
Total 8751 109 12719 28431 12674

 Table 4: Energy consumption between present and alternative light per day.

Present Light Fluorescent tube CFL 14 W 13 W/2 pin CFL 36 W/4 pin Fluorescent tube Total (kWh)
 36 W 4 feet 18 W 2 feet
kWh 2,520.29 12.21 1,322.78 8,188.13 1,825.06 13,868.46
Alternative light 20 W-4 ft LED tube 9 W LED bulb 8 W/2 pin LED 22 W/4 pin LED tube 10 W-2 ft LED tube Total (kWh)
kWh 1,400.16 7.85 814.02 5,003.86 1,013.92 8,239.80

Table 5: Energy consumption between existing and alternative energy effective progress of LED illumination system which
fixtures. will be implemented. The complete LCC analysis calculation
Year LED energy consumption (kWh) for the 20 W LED tube replaced with the Philips 36 W
 fluorescent tube is presented in Table 6. The same method
2014 3,605,798.56
 have been used to analyze the LCC of 10 W LED tube replaced
2015 3,459,453.50
 with Philips 18 W fluorescent tube, 22 W/4 pin LED light
2016 3,313,108.45 replaced with the Philips 36 W/4 Pin, 8 W/2 pin LED bulb
2017 3,166,763.39 replaced with the Philips 13 W/2 pin CFL, and 9 W LED bulb
2018 3,020,418.34 replaced with the Philips 14 W CFL bulb.
2019 2,874,073.28 The payback period after complete retrofit for the 20 W
2020 2,727,728.22 LED is 4.01 years, 10 W LED tube is 3.86 years, 22 W/4 pin
2021 2,581,383.17 LED tube is 4.58 years, 8 W/2 pin LED is 3.48 years, and
2022 2,435,038.11 9 W LED is 4.27 years. Basically after four years the selected
2023 2,288,693.06 buildings will bring profit for the investment. The result of the
2024 2,142,348.00
 payback period analysis is shown in Figure 5.

 3.4. Emission Reduction. Analysis on emission reduction by
3.3. Life Cycle Analysis and Payback Period. To analyze life retrofitting energy saving LEDs is conducted by predicting
cycle cost of the lighting system, the total cost of installation, the future data of fuel mixing to generate electricity in
maintenance, and operation of its lifespan have been consid- Malaysia. However, the used data might have variance with
ered. In this project LCC is used to determine the cost of the real condition due to the uncountable reasons that are not
8 The Scientific World Journal

 Table 6: LCC analysis for the 20 W LED tube replacing Philips 36 W fluorescent tube.

Variables Value Unit
LED-wattage 20 Watts
LED-single unit cost RM60.00 Ringgit
Existing light-wattage 36 Watts
Existing light-single unit cost RM10.00 Ringgit
Number of lamps 8751 Lamp(s)
Running time per day 8 Hours
Operational days (per year) 260 Days
Cost of energy/kWh RM0.39 Ringgit
Calculations Existing system LED
Electrical costs
 Electrical load of lamp(s) 315036 175020
 Running time per year 2080 2080
 Energy consumed per year (kWh) 655274.88 364041.6
 Electrical demand saving (kWh) 0 291233.28
 Total cost of energy (per year) RM257,523.03 RM143,068.35
 Saving the electrical fees (per year) RM0.00 RM114,454.68
Capital requirements
 Purchase requirements Cost RM87,510.00 RM525,060.00
 Installation cost per unit RM2.00 RM1.00
 Installation costs RM17,502.00 RM8,751.00
 Total capital investment requirements RM105,012.00 RM533,811.00
 Net investment requirement RM0.00 RM428,799.00
Maintenance requirements
 Life time of lamp (operating hours) 15000 50000
 Replacements required (per year) 1213.47 364.04
 Replacement costs (per year) RM12,134.72 RM21,842.50
 Installation cost per new unit RM2.00 RM1.00
 Maintenance costs (per year) RM2,426.94 RM364.04
 Total maintenance costs (per year) RM14,561.66 RM22,206.54
 Saving maintenance (per year) RM0.00 −RM7,644.87
ROI results
 Total operating cost (per year) RM272,084.69 RM165,274.89
 Total savings first year RM0.00 RM106,809.81
 Saving the electrical fees + savings maintenance
 Payback period in years n/a 4.01
 Time to payback capital requirement cost
 LED return on investment (ROI) over 10 years RM0.00 RM534,287.05

predictable and is out of scope of this study. The predicted 23,473 kg of SO2 , 12,585 kg of NO , and 1,317 kg of CO after
fuel combination to generate electricity in Malaysia that is 100% retrofit. Graph of total reduction in gases emission of
used in this project is presented in Figure 6. As the graph CO2 , SO2 , NO , and CO by electricity generation from 0%
shows, Malaysia is also beginning to invest toward renewable to 100% retrofitting is presented in Figure 7, which shows the
energies. increment of reduction in emission every year.
 As a result of retrofitting, the overall amount of elec-
tricity consumption decreases and consequently would help 4. Conclusion
the environment by decreasing the harmful effect of the
greenhouse gases. The proposed model suggests overall emis- Day by day the usage of electricity increases globally due to
sion production reduction of around 3,746,433 kg of CO2 , the ever increasing demand in the developed and developing
The Scientific World Journal 9

 Life cycle cost and payback Life cycle cost and payback
 period for 20 W LED tube period for 10 W LED tube
 RM1,800 4.50 RM1,400 4.50
 Thousands

 Thousands
 RM1,600 4.00 RM1,200 4.00

 Payback period (years)

 Payback period (years)
 RM1,400 3.50 3.50
 Life cost cycle (RM)

 Life cost cycle (RM)
 RM1,000
 RM1,200 3.00 3.00
 RM1,000 2.50 RM800 2.50
 RM800 2.00 RM600 2.00
 RM600 1.50 1.50
 RM400
 RM400 1.00 1.00
 RM200 0.50
 RM200 0.50
 RM0 0.00 RM0 0.00
 2014 2016 2018 2020 2022 2024 2026 2014 2016 2018 2020 2022 2024 2026
 Year Year

 Life cycle cost and payback Life cycle cost and payback
 period for 22 W LED light period for 8 W/2 pin LED bulb
 RM3,000 5.00 RM1,200 4.00
 Thousands

 Thousands
 4.50 3.50
 RM2,500 Payback period (years) RM1,000

 Payback period (years)
 4.00
 Life cost cycle (RM)

 3.00
 RM2,000 3.50 Life cost cycle (RM) RM800
 2.50
 3.00
 RM1,500 2.50 RM600 2.00
 2.00 1.50
 RM1,000 1.50 RM400
 1.00
 RM500 1.00
 RM200
 0.50 0.50
 RM0 0.00 RM0 0.00
 2014 2016 2018 2020 2022 2024 2026 2014 2016 2018 2020 2022 2024 2026
 Year Year
 LCC LCC
 Pay Pay

 Figure 5: The payback period analysis.

 Forecasted percentage of fuel combination of countries. One of the fast options to save the energy is to use
 electricity generation in Malaysia energy efficient electrical appliances among which lighting
 100 system has a great potential on saving energy. The present
 90 project has focused on the selected buildings in the Universiti
 80 Tenaga Nasional campus with the objective of designing a
 70 proper retrofit scenario and calculates the potential electricity
 saving, the payback period, and the potential environmental
 Fuel mix (%)

 60
 benefits. In this project, the energy saving and emission
 50
 production reduction have been analyzed based on the
 40 comparison between the existing lighting system and the
 30 proposed LED retrofitting. In this survey the policy for
 20 retrofitting the old lighting system with the new energy
 10 saving LEDs starts with 10% for the first year and continues
 0 constantly for 10 years until all the lighting systems have been
 2014 2015 2016 2017 2018 2019 2020 2021 2022 2023 2024 replaced. The result of the life cycle analysis reveals that after
 Year four years, the selected buildings will bring profit for the
 investment. Further comparison has been done between T5
 Oil Coal electronic ballast and LED tube. Both T5 and LED are much
 Naturel gas Hydro more energy efficient compared to the existing CFL lighting
Figure 6: Forecasted percentage of fuel combination of electricity
 system. By retrofitting 100% of the existing lighting system
generation in Malaysia. with the LED lights, around 44% saving of energy can be
 saved with payback period of 4.01 year. However, by using
10 The Scientific World Journal

 2012 2014 2016 2018 2020 2022 2024 2026 Conversion and Management, vol. 41, no. 18, pp. 1999–2008,
CO, SO2 , NOx emission reduction (kg)

 0 0 2000.
 −5,000 −500,000 [7] D. Caicedo, A. Pandharipande, and G. Leus, “Occupancy-based

 CO2 , emission reduction (kg)
 −10,000 illumination control of LED lighting systems,” Lighting Research
 −1,000,000
 −15,000 and Technology, vol. 43, no. 2, pp. 217–234, 2011.
 −20,000 −1,500,000
 [8] S. Choi and T. Kim, “Symmetric current-balancing circuit for
 −25,000 −2,000,000 LED backlight with dimming,” IEEE Transactions on Industrial
 −30,000 −2,500,000 Electronics, vol. 59, no. 4, pp. 1698–1707, 2012.
 −35,000 [9] Y.-C. Li and C.-L. Chen, “A novel single-stage high-power-
 −3,000,000
 −40,000 factor AC-to-DC LED driving circuit with leakage inductance
 −45,000 −3,500,000 energy recycling,” IEEE Transactions on Industrial Electronics,
 −50,000 −4,000,000 vol. 59, no. 2, pp. 793–802, 2012.
 Year [10] T. M. I. Mahlia, H. A. Razak, and M. A. Nursahida, “Life
 cycle cost analysis and payback period of lighting retrofit at
 SO2 CO the University of Malaya,” Renewable and Sustainable Energy
 NOx CO2 Reviews, vol. 15, no. 2, pp. 1125–1132, 2011.
 [11] J. Di Stefano, “Energy efficiency and the environment: the
Figure 7: Pattern of emission reduction of CO2 , SO2 , NO , and CO potential for energy efficient lighting to save energy and reduce
by electricity generation from 0% to 100% retrofitting. carbon dioxide emissions at Melbourne University, Australia,”
 Energy, vol. 25, no. 9, pp. 823–839, 2000.
 [12] S. Uddin, H. Shareef, A. Mohamed, M. A. Hannan, and
T5 tube with electronic ballast the saving limits to 22% with K. Mohamed, “LEDs as energy efficient lighting systems: a
payback period of 3.8 years. Although, the initial cost of LED detail review,” in Proceedings of the IEEE Student Conference
lighting system is higher compared to T5 electronic ballast, it on Research and Development (SCOReD ’11), pp. 468–472,
would bring more saving in long term. December 2011.
 [13] N. Chen and H. S.-H. Chung, “A driving technology for retrofit
 LED lamp for fluorescent lighting fixtures with electronic
Conflict of Interests ballasts,” IEEE Transactions on Power Electronics, vol. 26, no. 2,
 pp. 588–601, 2011.
The authors declare that there is no conflict of interests [14] W. R. Ryckaert, K. A. G. Smet, I. A. A. Roelandts, M. van Gils,
regarding the publication of this paper. and P. Hanselaer, “Linear LED tubes versus fluorescent lamps:
 an evaluation,” Energy and Buildings, vol. 49, pp. 429–436, 2012.
Acknowledgments [15] F. P. Vahl, L. M. S. Campos, and N. Casarotto Filho, “Sustainabil-
 ity constraints in techno-economic analysis of general lighting
The authors would like to acknowledge the Ministry retrofits,” Energ Buildings, vol. 67, pp. 500–507, 2013.
of Higher Education of Malaysia and The University of [16] T. M. I. Mahlia, “Emissions from electricity generation in
Malaya, Kuala Lumpur, Malaysia, for the financial sup- Malaysia,” Renewable Energy, vol. 27, no. 2, pp. 293–300, 2002.
port under UM.C/HIR/MOHE/ENG/15 (D000015-16001) [17] Z. Pei-Dong, J. Guomei, and W. Gang, “Contribution to
and BKP (BK032-2013). emission reduction of CO2 and SO2 by household biogas
 construction in rural China,” Renewable and Sustainable Energy
 Reviews, vol. 11, no. 8, pp. 1903–1912, 2007.
References [18] E. Mahalingam, New Green Rating Tools to Boost Value of Old
 Buildings, The Star, Kuala Lumpur, Malaysia, 2010.
[1] S. Uddin, H. Shareef, and A. Mohamed, “Power quality perfor-
 [19] H. Heisler, Advanced Engine Technology, SAE International,
 mance of energy-efficient low-wattage LED lamps,” Measure-
 Warrendale, Pa, USA, 1995.
 ment, vol. 46, no. 10, pp. 3783–3795, 2013.
 [20] A. J. Johnson and G. H. Auth, Fuels and Combustion Handbook,
[2] P. K. Soori and M. Vishwas, “Lighting control strategy for energy McGraw-Hill, New York, NY, USA, 1st edition, 1951.
 efficient office lighting system design,” Energy and Buildings, vol.
 [21] F. J. Wallace and W. A. Linning, Basic Engineering Thermody-
 66, pp. 329–337, 2013.
 namics: S.I. Units, Pitman, London, UK, 1st edition, 1970.
[3] T. M. I. Mahlia, M. F. M. Said, H. H. Masjuki, and M. [22] A. Mazandarani, T. M. I. Mahlia, W. T. Chong, and M.
 R. Tamjis, “Cost-benefit analysis and emission reduction of Moghavvemi, “A review on the pattern of electricity generation
 lighting retrofits in residential sector,” Energy and Buildings, vol. and emission in Iran from 1967 to 2008,” Renewable and
 37, no. 6, pp. 573–578, 2005. Sustainable Energy Reviews, vol. 14, no. 7, pp. 1814–1829, 2010.
[4] J. Trifunovic, J. Mikulovic, Z. Djurisic, M. Djuric, and M. Kostic, [23] M. Shekarchian, M. Moghavvemi, B. Rismanchi, T. M. I.
 “Reductions in electricity consumption and power demand in Mahlia, and T. Olofsson, “The cost benefit analysis and poten-
 case of the mass use of compact fluorescent lamps,” Energy, vol. tial emission reduction evaluation of applying wall insulation
 34, no. 9, pp. 1355–1363, 2009. for buildings in Malaysia,” Renewable and Sustainable Energy
[5] Z. Ma, P. Cooper, D. Daly, and L. Ledo, “Existing building Reviews, vol. 16, no. 7, pp. 4708–4718, 2012.
 retrofits: methodology and state-of-the-art,” Energy and Build- [24] M. Shekarchian, M. Moghavvemi, T. M. I. Mahlia, and A.
 ings, vol. 55, pp. 889–902, 2012. Mazandarani, “A review on the pattern of electricity generation
[6] A. H. W. Lee, “Verification of electrical energy savings for light- and emission in Malaysia from 1976 to 2008,” Renewable &
 ing retrofits using short- and long-term monitoring,” Energy Sustainable Energy Reviews, vol. 15, no. 6, pp. 2629–2642, 2011.
The Scientific World Journal 11

[25] P S. The Art of the Long View: Planning in an Uncertain World,
 Doubleday, New York, NY, USA, 1996.
[26] A. Mazandarani, T. M. I. Mahlia, W. T. Chong, and M.
 Moghavvemi, “Fuel consumption and emission prediction by
 Iranian power plants until 2025,” Renewable and Sustainable
 Energy Reviews, vol. 15, no. 3, pp. 1575–1592, 2011.
[27] Tenaga Nasional Sdn Bhd, Increase in Electricity Tariff, 2013.
Minerva Access is the Institutional Repository of The University of Melbourne

Author/s:
Ganandran, GSB; Mahlia, TMI; Ong, HC; Rismanchi, B; Chong, WT

Title:
Cost-Benefit Analysis and Emission Reduction of Energy Efficient Lighting at the Universiti
Tenaga Nasional

Date:
2014-01-01

Citation:
Ganandran, GSB; Mahlia, TMI; Ong, HC; Rismanchi, B; Chong, WT, Cost-Benefit Analysis
and Emission Reduction of Energy Efficient Lighting at the Universiti Tenaga Nasional,
SCIENTIFIC WORLD JOURNAL, 2014

Persistent Link:
http://hdl.handle.net/11343/128520

File Description:
Published version
You can also read