Corporate Presentation - March 31, 2021 - Skyline Investments
←
→
Page content transcription
If your browser does not render page correctly, please read the page content below
Corporate      March 31, 2021
Presentation
Cautionary Statement
 General
 This presentation has been prepared by Skyline Investments Inc. (the "Company“ or “Skyline”) as a general presentation about the Company.

 This presentation is not intended to replace the need to review the formal reports published by the Company to the public on the Tel-Aviv Stock Exchange. This presentation is qualified in its entirety by
 reference to, and must be read in conjunction with, the information contained in the said reports. In the event of a conflict between this presentation and the contents of the reports of the Company as
 required by law, the provisions of said reports shall prevail. Additional information about the Company is available on SEDAR at www.sedar.com.

 The information included in this presentation does not constitute any advice, recommendation, opinion or suggestion about the Company and does not replace an independent examination and
 independent advice in light of the specific data of each reader.

 This presentation does not constitute or embody any offer or invitation to purchase securities of the Company and does not constitute or is a part of an invitation to receive such offers. This presentation is
 for information purposes only and shall not be construed as a prospectus, an offering memorandum, an advertisement, an offer, an invitation or a solicitation to enter into a transaction with the Company.

 Except for Company-owned trademarks, the trademarks mentioned in this presentation are the property of their owners and are solely used in this presentation in order to understand the context. Use of
 the trademarks should not be interpreted as an approval or corroboration in relation to the Company's programs, the Company's services or the Company’s securities.

 Forward-Looking Information
 This presentation may include forward-looking information within the meaning of applicable Canadian and Israeli securities legislation relating to the business of the Company, including forecasts,
 evaluations, estimates and other information regarding future events and issues. In some cases, forward-looking information can be identified by using terms such as “may”, “will”, “should”, “expect”,
 “plan”, “anticipate”, “believe”, “intend”, “estimate”, “predict”, “potential”, “continue” or other similar expressions concerning matters that are not historical facts.

 Forward-looking information in this presentation is based on current estimates and assumptions made by the Company's management, including, without limitation, a reasonably stable North American
 economy, the strength of the U.S. lodging industry, and the competitive ability of the Company. Although the forward-looking information contained in this presentation is based on what management
 believes to be reasonable assumptions, the Company cannot assure readers that actual results will be consistent with such information. Forward-looking information involves risks and uncertainties,
 including factors that are not within the Company’s control, each of which, or a combination of them, may materially affect the Company's operating results and cause the actual results to substantially
 differ from the forward-looking information.

 There can be no assurance that forward-looking statements will prove to be accurate as actual outcomes and results may differ materially from those expressed in the forward-looking statements.
 Further, all forward-looking information set forth herein reflects the Company’s expectations as at the date of this presentation, and, except as expressly required by applicable law, the Company
 undertakes no obligation to update any forward-looking or other statements herein whether as a result of new information, future events or otherwise.

 For greater certainty, the Company's strategy and plans contained in this presentation as of the date of publication may change depending on the resolutions of the Board of Directors of the Company, as
 may be held from time to time.

 Non-IFRS Measures
 In this presentation, the Company uses certain non-IFRS financial measures, which include net operating income (“NOI”), funds from operations (“FFO”), adjusted earnings before interest, taxes,
 depreciation and amortization (“Adjusted EBITDA”) and NOI (EBITDA) which are not measures recognized under International Financial Reporting Standards (“IFRS”) and do not have standardized
 meanings prescribed by IFRS, and should not be compared to or construed as alternatives to profit/loss, cash flow from operating activities or other measures of financial performance determined in
 accordance with IFRS. NOI, FFO, Adjusted EBITDA and NOI (EBITDA), as computed by the Company, may differ from similar measures as reported by other companies in similar or different industries.
 These measures should be considered as supplemental in nature and not as a substitute for related financial information prepared in accordance with IFRS. However, these non-IFRS measures are
 recognized supplemental measures of performance for real estate issuers widely used by the real estate industry, particularly by those publicly traded entities that own and operate income-producing
 properties, and the Company believes they provide useful supplemental information to both management and readers in measuring the financial performance of the Company. Further details on non-IFRS
 measures are set out in the Company’s Management's Discussion and Analysis for the period ended March 31, 2021 and available on the Company’s profile on SEDAR at www.sedar.com or MAGNA at
 www.magna.isa.gov.il

Note: All amounts are in thousands of Canadian Dollars as of March 31, 2021 unless otherwise indicated.
Exchange rate NIS/CAD (as at March 31, 2021): 0.378
                                                                                                                                                                                                                    2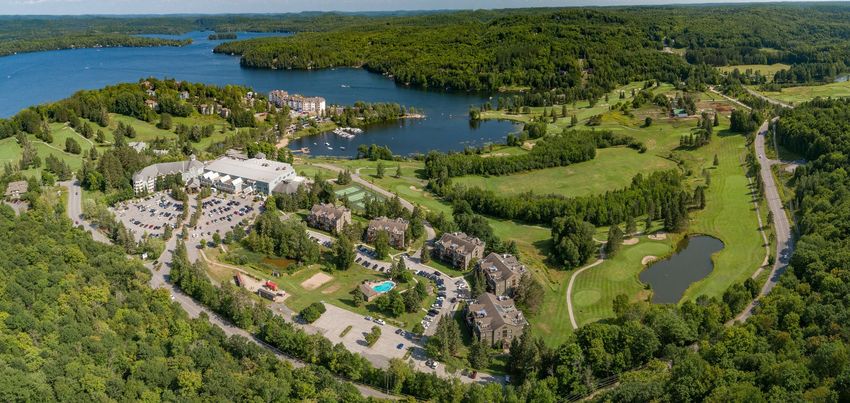
Skyline’s Vision & Mission

             We’re creating one of North America’s leading hospitality real estate
            investment companies, with a focus on income producing properties.

              Skyline seeks to create shareholder value and deliver superior risk
                adjusted returns through the acquisition of income producing
              properties and select development projects within the hospitality
               sector, with a focus on active asset management and creativity.

                                                                                     3
Corporate Profile

                                18
                     Income Producing Assets

                             3,279
                           Guestrooms

                      $630m/$255m
                        Total Assets/Equity

                               40%
                    Equity to Total Assets Ratio

                            Baa1.il
                          (Negative Outlook)
                           Bond Rating

                             2,315
                        Units Available for
                          Development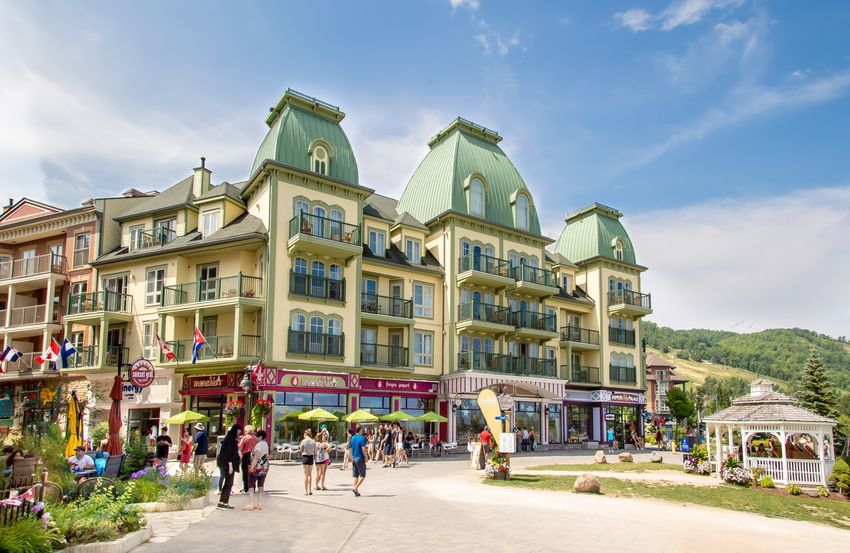
COVID-19 Recap and Update
In March 2020, the World Health Organization declared COVID-19 to be a pandemic. In an effort to contain and mitigate the spread of
COVID-19, many countries, including Canada and the United States, imposed unprecedented restrictions on travel, group gatherings and
non-essential activities, including orders and guidance issued by federal, state, provincial and local governmental authorities
As an immediate response to the changing environment caused by the COVID-19 pandemic, Skyline temporarily closed all 3 of its resorts in
March 2020. On June 12, Skyline’s Canadian resorts (Deerhurst and Horseshoe) reopened. Bear Valley was closed for the majority of the
year, and reopened in the second half of Q4 2020
In December 2020, the local jurisdictions where Horseshoe and Bear Valley are located re-implemented restrictions, causing the partial
closure of certain operations at the ski resorts. These restrictions were subsequently removed in February 2021 for the remainder of the ski
season. On April 3, Horseshoe temporarily closed operations due to the stay-at-home order issued for the Province of Ontario, and expects
to fully reopen for the summer season after the lifting of the current stay-at-home order. Deerhurst was not subject to these same
restrictions, and currently, both Deerhurst and Bear Valley are open and are operating in accordance with public health guidelines
All 15 hotels in the US never closed and remain open with significantly reduced staff and adjusted operating models
Skyline continues to focus on making all necessary adjustments to operations, while maintaining sufficient liquidity to successfully manage
the pandemic
In response to the COVID-19 crisis, the Canadian and US Governments unveiled multiple stimulus measures. During 2020, Skyline received
approximately CAD $15M in government financial support. These stimulus measures are expected to continue throughout 2021
In the US, over 36% of the population has been fully vaccinated1 and 70% of adult Americans are expected to receive at least one dose of
vaccine by the beginning of July, 20212. In Canada, over 2.6% of the population has been fully vaccinated and more than 33% has received at
least one dose3. The Canadian Government expects to complete its vaccination program by September 20214
With a growing number of Americans getting vaccinated, we are starting to see the most significant increase in travel demand since the
beginning of the pandemic. Our Courtyard Portfolio is leading the recovery with occupancy of 49% in March and 54% in April 2021. While
still lagging behind the US, Canada is also accelerating its vaccination campaign and is expected to provide vaccines to all Canadians 18 and
older who wish to receive one by the end of June. The majority of our properties are located in leisure and drive-to destinations and are
well-positioned to benefit from the recovery in travel demand
(1) https://covid.cdc.gov/covid-data-tracker/#vaccinations
(2) https://www.whitehouse.gov/briefing-room/speeches-remarks/2021/05/04/remarks-by-president-biden-on-the-covid-19-response-and-the-vaccination-program/
(3) https://health-infobase.canada.ca/covid-19/vaccination-coverage/
(4) https://www.canada.ca/en/public-health/services/diseases/2019-novel-coronavirus-infection/prevention-risks/covid-19-vaccine-treatment/vaccine-rollout.html
5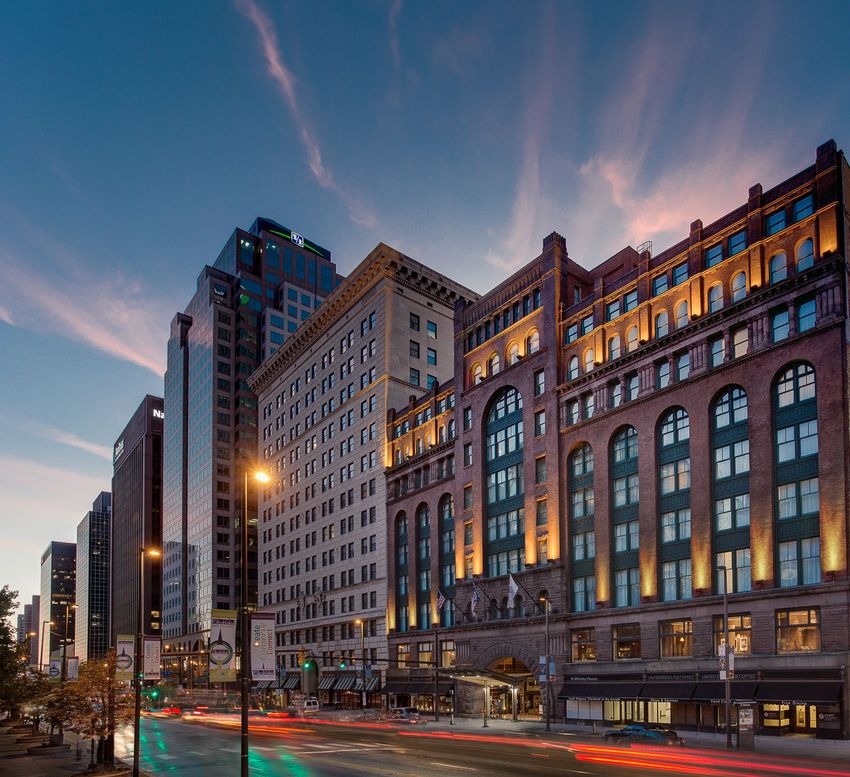
Q1 2021 Results

 NOI from hotels and resorts increased by 10% to        In April 2021, the U.S. hotel sector saw demand and
 CAD $8.3M compared to CAD $7.5M in Q1 2020             occupancy hit their highest levels since the start of
                                                        the pandemic. Our Courtyard portfolio experienced
 Revenue from hotels and resorts decreased by 32%       the most significant occupancy increase with 49%
 to CAD $28.2M compared to CAD $41.6M in Q1             occupancy in March and 54% in April
 2020, due to the impact of COVID-19
                                                        The Company pre-sold 55% of its new 66-unit Edge
 Operating expenses from hotels and resorts also        Condo development at Horseshoe during Q1 2021
 declined by 41% due to cost containment measures       and 73% as of report date
 taken by the Company and government subsidies
 received in response to the pandemic                   Skyline recently completed full interior renovations
                                                        of the Courtyard Tucson with minimal room
 Positive Q1 Adjusted EBITDA of CAD $6.7M was           displacement due to the COVID-19 pandemic
 achieved, compared to CAD $7.9M for the full year of
 2020

 FFO increased by 21% to CAD $3.3M over Q1 2020
 FFO of CAD $2.7M

 Cash and available lines of credit was CAD $29M,
 an increase of CAD $2M compared to December
 31, 2020

                                                                                                                6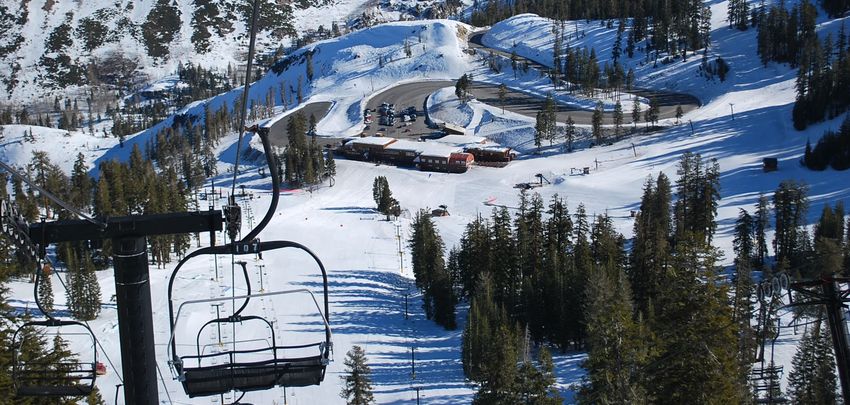
Occupancy Levels Before and During COVID-19
2021 may signal the start of hotel demand recovery
Canadian Resorts US Hotels
Deerhurst and Horseshoe Resorts Select-Service Courtyard 13 Portfolio
In late December 2020, local public health restrictions necessitated the Steady recovery in occupancy since April 2020 low due to increase in
closure of certain activities at Horseshoe, which fully reopened in mid- domestic leisure travel and rebound in air travel. In March and April 2021,
February 2021 to very strong demand. The negative impact on revenue the number of air travelers surpassed the totals from 2020, although
during the 1st half of the quarter was offset by expense reduction measures passenger numbers remain below 2019 levels
and government assistance received. As a result, Horseshoe achieved NOI
Full-Service Cleveland Hotels
growth of 19% in Q1 2021
Due to their reliance on group meetings and weddings, they show a slower
In April 2021, Horseshoe temporarily closed operations due to the province-
occupancy recovery than the Courtyard Portfolio
wide stay-at-home order and expects to fully reopen after the order is lifted
In February and March 2021, the Cleveland hotels achieved their highest
Deerhurst was not subject to the same restrictions. Due to expense
occupancy since the begging of the pandemic
reduction measures and government assistance, Deerhurst’s bottom-line
performance during Q1 2021 was in line with Q1 2020 As Cleveland was host to the NFL Draft and prepares for other large events
in 2021, we are cautiously optimistic about its recovery
As the vaccination roll out accelerates, we are cautiously optimistic about
strong demand during the summer months at both resorts
73% 76%
72%
67%
63% 61% 63% 61%
55% 55% 68%68% 53% 54%
62% 50% 49%
49% 50% 71% 45%
39% 41% 42%
49% 39%
52% 35% 35% 34% 34%
43% 47% 34% 32% 29% 43%
30% 40% 26% 39%
38% 37% 37% 26% 25% 27%
33% 34% 35%
31% 16%
16% 27%
26% 24% 10% 13% 22% 12% 23% 23%
20% 21% 20%
17%
18% 19% 17%18%
0% 0% 12%
6% 0% 6% 4% 8%
Jul-20
Jun-20
Nov-19
Nov-20
Apr-20
May-20
Apr-21
Dec-19
Aug-20
Dec-20
Mar-20
Sep-19
Sep-20
Feb-21
Mar-21
Jan-20
Feb-20
Jan-21
Oct-19
Oct-20
Jul-20
Jun-20
Nov-19
Nov-20
Apr-20
May-20
Apr-21
Dec-19
Aug-20
Dec-20
Sep-20
Jan-21
Feb-21
Mar-21
Sep-19
Jan-20
Feb-20
Mar-20
Oct-19
Oct-20
Horeshoe Resort Deerhurst Resort Courtyard 13 (Select Service) Cleveland Properties (Full Service)
7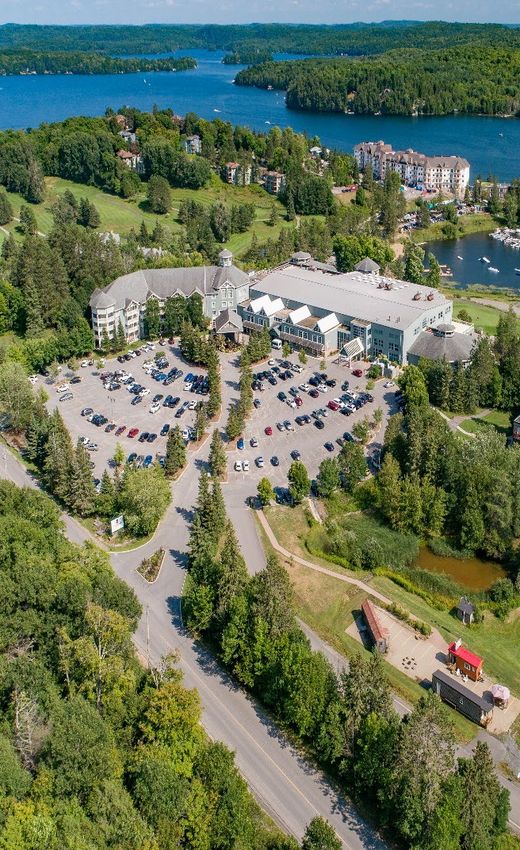
US and Canadian Government Stimulus Programs
Paycheque Protection Program (“PPP”)
CAD $9.3M (US $6.7M) in cash was received during Q2 2020, and a further CAD $7.0M (US $5.5M) was
received during Q1 2021, and CAD $2.5M (US $2.0M) was received on May 5, 2021. As part of this
program, the portion of any of these loans spent on payroll, utilities, interest and other specified costs may
be forgiven by the US Government under certain circumstances. Any unforgiven portion will have a
maturity of 5 years with annual fixed interest of 1%
US In Q1 2021, the Company recorded an offset to hotel operating expenses in the amount of CAD $0.8M to
account for this government assistance
Employee Retention Credit (“ERC”)
The Company believes that it qualifies for the ERC, which was enacted as part of the US Government’s
stimulus measures. In Q1 2020, the Company did not recognize any benefits related to the ERC
Canada Employment Wage Subsidy (“CEWS”) and Canada Emergency Rent Subsidy (“CERS”)
Depending on a company's decrease in revenues in a given month, CEWS covers up to 75% of the first CAD
$58.7K normally paid to eligible employees, representing a benefit of up to CAD $847 per week, per eligible
Canada employee, between March 15, 2020 and at least June 30, 2021, as well as the Canada Emergency Rent
Subsidy (“CERS”), which covers certain rental and building operating expenses
In Q1 2021, the Company recorded an offset to operating expenses from hotels and resorts in the amount
of CAD $2.3M and to administrative and general expenses of $0.3M related to CEWS and CERS
8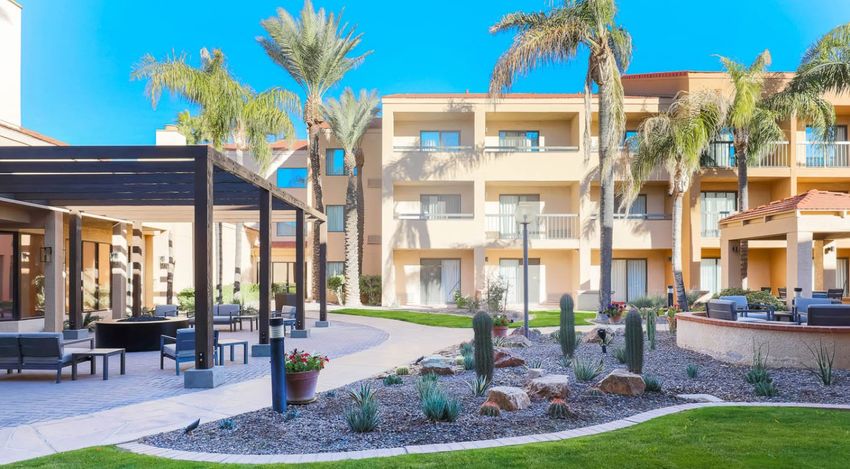
Debt Composition and Maturities
Bond A and B – Payments are current.
As of March 31, 2021 (CAD’000)
Bond A – Matures January 2023, can be repaid
through obtaining a new property level Weighted Average Term Maturity – 1.85 years 5%
3% 15%
mortgage or sale of the asset in advance of
5%
maturity; onside with all covenants, LTV Weighted Average Interest Rate – 4.46%
covenant 0.611 at March 31.
8%
Renaissance Loan – The Company reached an
extension agreement with its lender. The 16%
extension is effective until March 16, 2022.
9%
Hyatt Loan – Not due until Q1 2024.
Courtyard Portfolio Loan – Interest only. The
Company has agreed with its lender on the 2nd
extension option effective for one year until
December 9, 2021. The Company’s intention is
to exercise the 3rd extension option. 39%
Corporate Line of Credit – Perpetual loan with
annual renewals, current renewal process is
underway.
Year 1 Year 2 Year 3 Year 4 Year 5 and Total Deferred
Development loans – Multi-year revolvers tied Total Net
Gross Fin. Cost
to a project and classified as short-term because thereafter
Bond A 2,812 42,173 - - - 44,985 (470) 44,515
the development cycle is greater than 1 year.
Bond B(1) 3,828 3,828 3,828 37,954 - 49,438 (1,036) 48,402
Property level mortgage debt can be refinanced Courtyard 13 Loan - 119,306 - - - 119,306 (1,068) 118,238
or sold at maturity.
Renaissance Loan 26,617 - - - - 26,617 (47) 26,570
Hyatt Loan and TIF 1,106 1,213 20,775 - - 23,094 (473) 22,621
Corporate Line of Credit 16,040 - - - - 16,040 (64) 15,976
Development Loans 5,508 4,381 - - - 9,889 - 9,889
Cap. Leases, Gov. Loans 2,632 2,523 2,453 1,706 6,547 15,861 - 15,861
Total Gross 58,543 173,424 27,056 39,660 6,547 305,230 (3,158) 302,072
Deferred Fin. Costs (1,448) (1,124) (449) (137) - (3,158)
Total Net 57,095 172,300 26,607 39,523 6,547 302,072
(1) Bond B – As described in Section X “Liquidity and Financial Position” of MD&A, the Company did not meet the non-defaulting Operating EBITDA provision related to its Series B Bonds. This non-defaulting
event will result in a 0.25% adjustment to the interest rate paid on the Series B Bonds for the period in which the Company is not in compliance with said provision.
9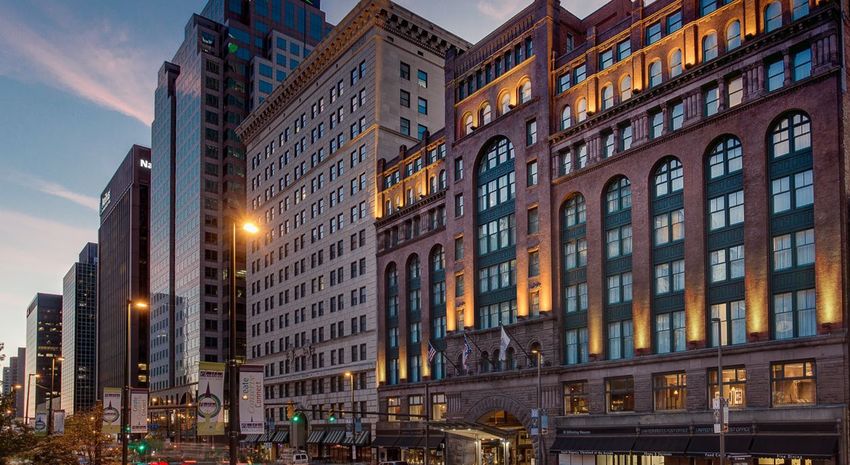
Expected Net Cash Flow from Vendor Take-Back Loans (VTB)

        VTB Loans (CAD’000)1                       Q2-Q4 2021                  2022                    2023                   2024                    Total
             Second Nature2                              491                    711                   11,978                     -                   13,180
         Blue Mountain Retail                              -                      -                       -                   3,800                   3,800
           Boathouses 3 & 43                           3,054                      -                       -                      -                    3,054
       Horseshoe Golf Course4                          1,496                      -                       -                      -                    1,496
                 Vetta Spa                                 -                      -                       -                    804                     804
                    Total                              5,041                    711                   11,978                  4,604                  22,334

  (1) With respect to the VTB on Port McNicoll, as at March 31, 2021, the purchaser is in default on the VTB. In the Company's estimation, this is due to a dispute
      between shareholders of the purchaser and it is not expected that the payment of the loan will not be completed. However, for the sake of caution, during
      2020, the Company initiated a power of sale process and is assessing its options with respect thereto, including re-acquiring or re-selling the lands. In view
      of the loan balance, the Company does not expect that the seller's loan will not be paid in full and it is expected to at least receive payment in the amount
      of the remaining debt. Refer to note 12 in the consolidated financial statements for the year ended December 31, 2020.
  (2) A portion of proceeds may be received earlier based on completion of construction. Net cash flows represent gross cash flows less costs to complete
      construction and debt repayments.
  (3) Payment of CAD $2.1 million received on April 30, 2021.
  (4) Payment received in full on May 7, 2021.

                                                                                                                                                                       10
Q1 2021 Cash Movement Summary
Q1 2021 Cash Movement Summary (CAD’000)
Opening Cash Balance 22,436
Operating Cash Flow 2,913
Capital Improvements (1,403)
Repayment of Bonds (3,240)
Proceeds from Long Term Loans, Net of Repayments 4,021
Other Movements Including FX (610)
Ending Cash Balance 24,117
CAD $24M in unrestricted cash as at March 31, 2021; CAD $12M in restricted FF&E and escrow reserves
Approximately CAD $5M of available lines of credit
11Share Price Discount to NAV
NAV was 35.51 NIS per share compared to its share price on March 31, 2021 of 14.49 NIS
Skyline's share price was trading at a 59% discount to its NAV as of March 31, 2021 (Skyline uses fair value
accounting, therefore its NAV is equal to its Book Value at March 31, 2021)
Share price discount to NAV
40.00 38.74
34.20 34.04 34.04 35.51
29%
59%
28.56
17.18
14.46 14.49
12.46
10.86
31-Dec-19 31-Mar-20 30-Jun-20 30-Sep-20 31-Dec-20 31-Mar-21
NAV per share (NIS) Price per share (NIS)
12Financial Strength and Flexibility
Total equity to total assets ratio of 40%
Net debt to Net CAP1 ratio of 52%
Cash balance of CAD $24M; approximately CAD $12M in additional restricted bank and other
deposits that can be accessed in certain circumstances
Additional cash flow of CAD $22M during the next 4 years from development projects
Low LTV (53% for hotels and resorts and 6% for lands)
Total value of unencumbered assets is approximately CAD $77M as at March 31, 2021
Weighted average loan term of 1.85 years, and a weighted average interest rate of 4.46%
(1) Net CAP is defined as the sum of total equity and net debt per the Company’s balance sheet.
13Business Strategy
Skyline’s Strategy Acquisition Targets
Acquisition of hospitality properties to Focus on the US and Canada
further decrease seasonality and diversify
our geographic presence Stabilized in-place income
Continued monetization of land assets to Strong potential growth
less than 10% of total assets
Strong demand generators
Active asset management and optimization
of cash flow from existing hotel assets: Limited new supply
Continual analysis of property
performance Low seasonality
Research of the operational markets
Implementation of property upgrades Acquisition cost below replacement cost
Intensive site visits
14Portfolio Map
18 INCOME PRODUCING ASSETS | 3,279 HOTEL ROOMS | 18 CITIES IN THE US AND CANADA
15Select Senior Management
Blake Lyon CA, CPA Robert Waxman
CEO CFO
Blake Lyon has extensive experience in Robert Waxman has over 20 years of
hotel and resort asset management in experience in accounting, finance, and
Canada and internationally. Before real estate. Prior to his appointment, Mr.
joining Skyline, Mr. Lyon served as the
Waxman led Deloitte’s Real Estate
CEO of some of the largest family offices
in Canada and was responsible for the Practice’s Finance Modernization &
management of real estate assets Effectiveness advisory group.
totaling CAD $9B, and was CFO at
Brookfield.
Ben Novo-Shalem Paul Mondell
VP, Asset Management & Senior VP Development
Investor Relations
In his previous position, Ben Novo- In the last 6 years Paul Mondell has
Shalem served as the head of the served as VP Business Development in
research department and was in charge two leading companies (Brookvalley
of the income-producing real estate Development and Management, and
sector at Epsilon Investment. Walton Development).
16Current Ownership Structure
49.37%
Alex
Shnaider 1.53%
27.66% Public
Blake Lyon 1.19%
20.25% ILDC
17Summary of Periodic Results
CAD ‘000 3M 2021 3M 2020 YE 2020
Income from Hotels and Resorts 28,191 41,567 91,484
Sale of Residential Real Estate 2,916 30,092 37,878
Total Revenue 31,107 71,659 129,362
NOI from Hotels and Resorts 8,254 7,507 11,359
Total Adjusted EBITDA 6,714 9,091 7,884
FFO 3,332 2,752 (3,761)
Same Asset Revenue 28,191 41,567 91,494
Same Asset NOI 8,254 7,507 11,342
18Balance Sheet Highlights
CAD ‘000, except where noted March 31, 2021 December 31, 2020
Total Assets 630,065 637,863
Gross Debt1 302,072 306,105
Cash and Equivalents 24,117 22,436
Net Debt 277,955 283,669
Shareholders’ Equity 224,767 226,044
Non-Controlling Interest 29,834 30,385
Total Equity 254,601 256,429
Shareholders’ Equity Per Share $13.42 $13.50
Net Debt to Net Assets Ratio2 46% 46%
Total Equity to Total Assets Ratio 40% 40%
(1) Gross debt is defined as total current and non-current loans payable and bonds, net of unamortized deferred financing costs as presented on the Company’s balance sheet.
(2) Net assets represents total assets per the Company’s balance sheet, less cash and cash equivalents.
19Net Asset Value (in 000’s CAD)
Loan Balance
Ownership BV NOI 2020 TTM Q1 2021 NOI LTV Equity
March 31, 2021
Hotels and Resorts
Deerhurst Resort (1) 100% 73,782 3,804 3,991 44,524 60% 29,258
Horseshoe Resort 100% 40,371 2,836 3,414 16,040 40% 24,331
Hyatt Regency Arcade 100% 62,643 (1,517) (559) 22,621 36% 40,022
Renaissance Hotel 50% 63,100 (1,895) (24) 26,569 42% 36,531
Courtyard Hotels 100% 171,304 3,985 1,666 118,237 69% 53,067
Bear Valley Resort 100% 19,095 2,545 2,780 - 0% 19,095
Total Hotels and Resorts 430,295 9,758 11,268 227,991 53% 202,304
Other (2) 1,501 1,601 832 10,645 (9,144)
Total Hotels and Resorts per Consolidated FS 431,796 11,359 12,100 238,636 55% 193,160
Average Interest Rate (3) 3.35%
Lands
Deerhurst Lands 100% 28,574 4,381 15% 24,193
Horseshoe Lands 100% 17,900 17,900
Blue Mountain Lands 60% 16,301 16,301
Port McNicoll 100% 5,460 5,460
Total Lands 68,235 4,381 6% 63,854
Projects Under Construction and Other 6,845 - 6,845
Total Real Estate 506,876 243,017 48% 263,859
Cash and Cash Equivalents 24,117
Vendor’s Take Back Against Port McNicoll Lands 31,208
Vendor's take back against others 31,378 5,508
Receivables & Other 36,486
Total Assets per Financial Statements 630,065 248,525
Debt (incl. Bonds) 297,061 Including Unsecured Series B Bonds 48,536
PPP loans 5,011 5,011
Payables & Other 41,345 5.65%
Deferred Tax 32,047
Total Liabilities 375,464
Non-Controlling Interest 29,834
Equity Attributable to Shareholders of the Company 224,767
Total Equity 254,601 Total Debt, incl. bonds 302,072 254,601
Number of Shares, 000 16,745 4.46%(3)
Equity per Share (CAD) 13.42
Equity per Share (NIS) 35.51
Exchange rate NIS/CAD (as of March 31, 2021) is 0.378
(1) Loan balance: Series A bonds .
(2) Debt consists of equipment lease obligations; book value and NOI relate to Skyline Utility Services.
(3) Average interest rate is calculated by multiplying the loan stated interest rate by loan balance and dividing by total loan balance.
20Appendix
Main Operating Assets in the United States

The Hyatt Regency Arcade,
Cleveland, OH
13 Courtyard by Marriott Hotels

Courtyard Birmingham Hoover,                                     Courtyard Manassas Battlefield Park
Hoover, AL                                                       Manassas, Virginia

 Courtyard Toledo Airport      Courtyard Fort Myers Cape Coral   Courtyard Deerfield
Arlington Heights
 Toledo, OH                    Fort Myers, FL                    Deerfield, IL
Courtyard by Marriott Hotels

                                                                                                                                Date of
  PROPERTIES                                Location                           Brand        Management      Service Level      Acquisition
  OVERVIEW
                                             9 States                       Courtyard by     Aimbridge,     Select Service     November
           (USD)                                                              Marriott          Urgo                           14th, 2017

     Number of                           Number of                          Acquisition      Price Per        Five Year       Capital Credit
      Hotels                              Rooms                                Price          Room            Mortgage            Line
               13                               1,913                       $135,000,000        $70,500      $89,500,000      $31,000,000

                                                                                                   2018   2019     2020

                                                                                  Revenue         50,628 52,098 22,347         HISTORICAL
                                                                                                                             PERFORMANCE
                                                                                  NOI             13,7441 14,085   3,052       (000’s USD)

                                                                                  NOI/Revenue      27%1    27%     14%
(1) Figure updated due to a transcription error in the 2018 presentation.

                                                                                                                                            24
Courtyard Tucson
Tucson Courtyard Renovations
Before Renovation
After Renovation
25Hyatt Regency Arcade
26Hyatt Regency Arcade
Improvements
Overview
Recently completed renovations of all rooms and meeting
The historical Cleveland Arcade was built by John D.
spaces. The renovation has improved the hotel’s
Rockefeller in 1890
competitive advantage
The hotel is an attractive event destination and hosts 60 The renovation was mostly funded by the property
to 80 weddings and other events a year renovation reserve1
Details Future Potential
Location | Cleveland, USA Increasing NOI as the USD $465M Cleveland Convention
Number of Rooms | 293 Center is expected to grow in popularity
Meeting Space | 7,000 Sf Continued rental of the commercial areas
Franchise | Hyatt Regency Expectation of growth in the Cleveland economy leading
to an increased number of visitors
Management Company | Hyatt
(1) Property renovation reserve: restricted cash reported separately from cash and cash equivalents balances
27Renaissance Cleveland Hotel
Renaissance Cleveland Hotel
Overview Improvements
Historical Heritage asset established in 1918 as The Cleveland Hotel Skyline completed the full HVAC replacement. This was the
top complaint from hotel guests and is also expected to
Notable visitors in the hotel’s history: Dwight D. Eisenhower, Gerald contribute to energy savings
Ford, Martin Luther King and The Beatles
The hotel is located in the City’s CBD near the main square Skyline is planning the next two phases of hotel
renovations which will include updates to the meeting
The city invested about USD $40M in the renovations of the public space and rooms
square as part of an urban renewal strategy
1st phase renovations were mostly financed by the in-place
USD $17M credit line
Details
Location | Cleveland, USA
Number of Rooms | 491 Future Potential
Meeting Space | 34 conference rooms, about 65,000 Sf Increasing NOI as the USD $465M Cleveland Convention
Center is expected to grow in popularity
Owned Parking Spaces | 300 Spaces
Franchise | Renaissance Continued rental of the commercial areas
Management Company | Aimbridge Expectation of growth in the Cleveland economy leading to
an increased number of visitors
Ownership | 50%
(1) Skyline owns 50% while financial information is representative of 100% of the asset.
29Bear Valley
30Bear Valley
Overview Improvements
A ski resort in Southern California, three and a half hours from Since the acquisition invested USD $3.2M in equipment
San Francisco and improvements
Acquired on December 2014 for US $3.7M from the Company’s In 2017 Skyline invested USD $5.5M on a new ski lift which
own resources
allowed the Company to increase day-use lift tickets from
USD $79 in 2017 to USD $99 at the end of 2018
Details
Location | 3.5 hours from San Francisco
Future Potential
Asset Type | Ski Resort
Continued growth of NOI by returning the number of
Numbers of Rooms | 52 visitors to historical levels
Land Area | Approx. 1700 Acres
Amenities | 75+ Ski Trails
31Main Operating Assets in Canada
Deerhurst

            33
Deerhurst
Future Potential
Overview
World-class four-season resort located in Muskoka near Increasing NOI by streamlining operations
Toronto, Canada
Sold all 150 units at Lakeside Lodge. 90 units have joined the
The new 150-room Lakeside Lodge was completed during hotel’s rental program2
2019
Improving occupancy during off-season by marketing to new
audiences
Details
In 2018 and early 2019, Skyline upgraded part of the
Location | Muskoka (2 Hours from Toronto)
Deerhurst meeting space to increase the amount of events
Number of Rooms | 377 (102 Owned / 275 Managed)1
Meeting Space | 40,000 Sf
Land Area | 790 Acres
Amenities | Golf Courses, 10 Event Halls, Spa,
5 Restaurant, Private Airport
(1) As at March 31, 2021
(2) As of report date 34Horseshoe Resort
35Horseshoe Resort
Overview Improvements
An all-season resort based around the Horseshoe Ski Mountain, Sold and delivered all 44 units at Slopeside Lodge
one of the closest ski resorts to Toronto, Canada During Q4 2020, the Company launched its new, 66-unit
Edge Condo development, and pre-sold 55% of the units
The Horseshoe Adventure Park and Horseshoe Lake are at the during Q1 2021. As of report date, the Company has pre-
center of summer activities sold 73% of the units
New Horseshoe Lake opened in August 2017, which
enhances summer activities and snow making capacity
Details
Location | Barrie (1.5 hours from Toronto)
Future Potential
Numbers of Rooms | 153 (101 Owned / 52 Managed)1
The lake alongside the new pipes and snow-making
Meeting Spaces | 14,500 Sf equipment increased snow production fourfold
Land Area | 220 Acres Continued sale and development of land within
Horseshoe
Amenities | 25 Ski Trails, 2 Golf Courses, Spa,
5 restaurants
(1) As at March 31, 2021
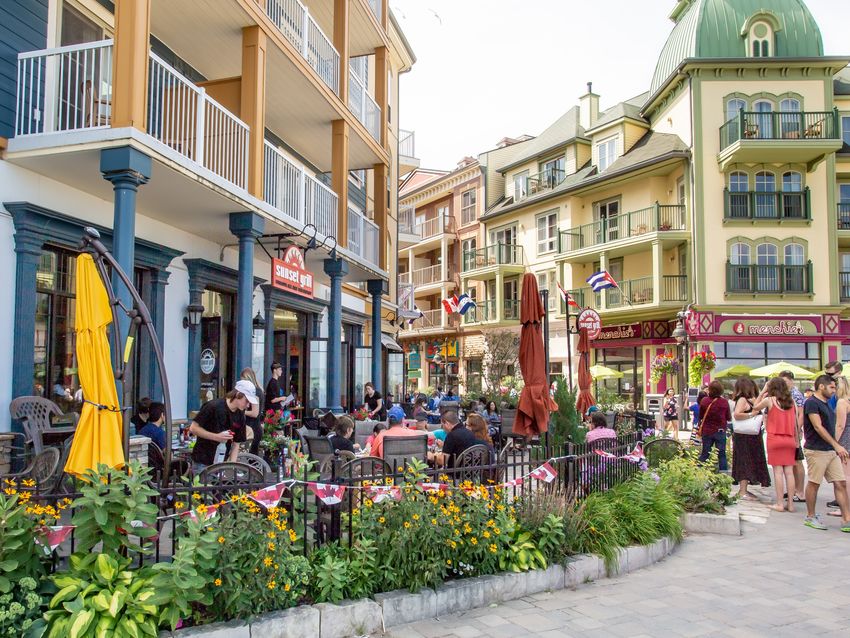
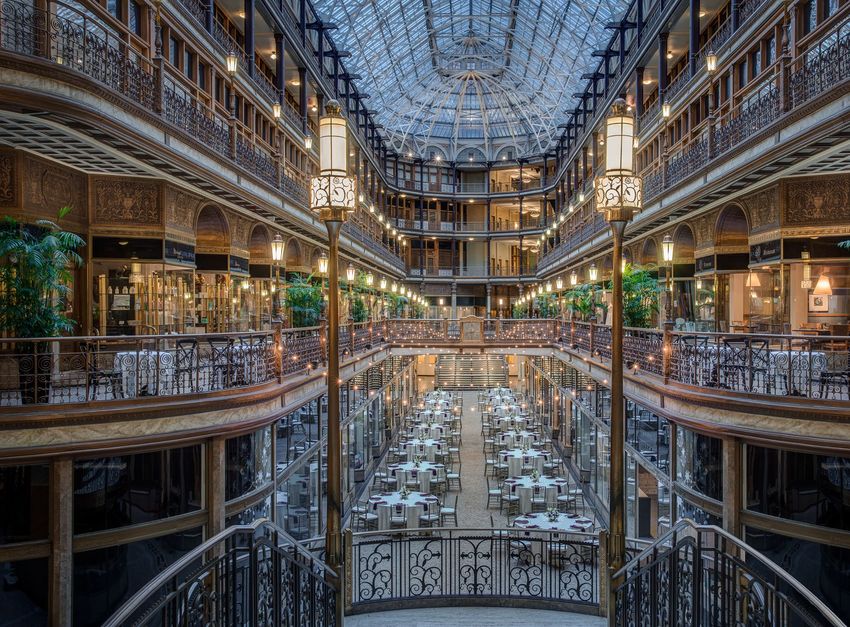
36Land Sales and Development Edge Condos
Lakeside Lodge

                 38
Slopeside Lodge
39Blue Mountain Development Lands
Second Nature
Phase 3/4
Second Nature
Phase 1 Snowbridge Townhomes
40Asset Ownership Breakdown
Property Property Owner Manager Brand/Franchise Leased
Deerhurst Skyline Skyline Independent None
Horseshoe Valley Skyline Skyline Independent None
Bear Valley Skyline Skyline Independent None
Hyatt Regency
Skyline Hyatt Hyatt Regency None
Cleveland
Marriott Renaissance
Skyline Aimbridge Marriott Renaissance None
Cleveland
Marriott Courtyard
Skyline Aimbridge, Urgo Courtyard by Marriott None
Hotels
Owned Managed Franchised Leased
Description Owned and operated by Owner of a hotel uses a Owned and operated by Owner-operator of a hotel
an owner who bears all third-party manager to an owner under a third- does not have outright
the costs associated operate the hotel on its party brand name, and ownership of the hotel
with the hotel but also behalf and pays the the owner pays a brand but pays rental fees to the
benefits from all of the manager management licensing fee to the ultimate owner of the
income fees brand owner property
Owner’s Income All revenues and profits Fee % of revenue plus Fee % of room revenue Rental Fee to Property
after management and success fee Owner
franchise fees
41Thank You! Questions? Please contact Rob Waxman | Chief Financial Officer 647-207-5312 | robw@skylineinvestments.com WWW.SKYLINEINVESTMENTS.COM
You can also read