Corporate Presentation - August 2011 - T4f
←
→
Page content transcription
If your browser does not render page correctly, please read the page content below
Corporate Presentation
August 2011
                         0
Disclaimer

The material that follows is a presentation of general background information about T4F Entretenimento S.A
(“T4F”) as of the date of the presentation. It is information in summary form and does not purport to be complete.
This material contains confidential information regarding and may not be reproduced or circulated, partially or
completely, without the prior written consent of the T4F.
Any statements, projections, expectations, estimates and plans contained in this document that do not describe
historical facts, and the factors or trends affecting financial condition, liquidity or results of operations, are
forward-looking statements and involve several risks and uncertainties. Such statements are based on
assumptions and analyses made by the Company based on its experience and the economic climate and on
market conditions and expected future events, many of which are beyond the Company’s control.
No investment decision should be based on validity, accuracy or completeness of the information or opinions
contained in this presentation. Under no circumstances, neither the Company nor its subsidiaries, directors,
officers, agents or employees be liable to third parties (including investors) for any investment decision based on
information and statements in this presentation, or for any damages resulting therefrom, corresponding or
specific.
This presentation does not constitute an offer, or invitation, or solicitation of an offer, to subscribe for or purchase
any securities. Neither this presentation nor anything contained herein shall form the basis of any contract or
commitment whatsoever.

                                                                                                                           1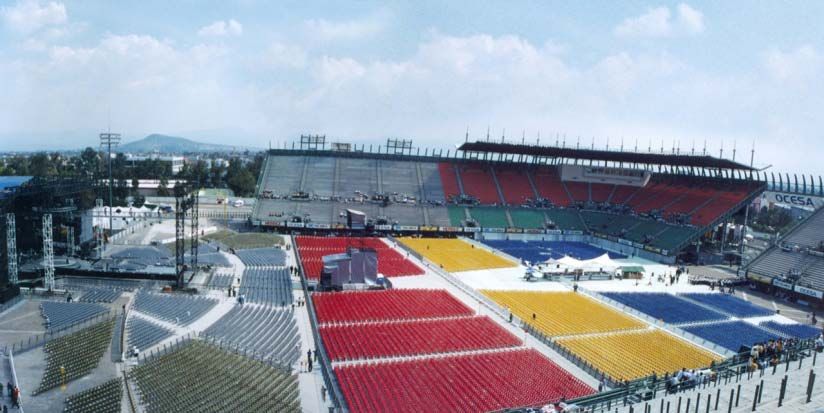
IPO Summary
Issuer T4F Entretenimento S.A.
Ticker Symbol SHOW3
Listing Date April 13th 2011
Total Offering Size R$503 million (US$310 million1)
# Shares Offered 31,441,396 ON shares with 100% tag along (Novo Mercado)
Price R$16.00
Offering Breakdown 37% primary / 63% secondary
Geographic Allocation 60% North America; 25% Europe; 15% Brazil
Use of Proceeds (i) Acquisition of companies and venues, (ii) construction of venues and (iii) geographic expansion
Bookrunners
1: Assuming the exchange rate of US$1 = R$1.6207 as of May 12th , according to Bacen.
2
Shareholding Structure

                                   Shareholding Structure

CIE International          Fernando Luiz Alterio             Gávea Investimentos     Free-Float

                                          85.0%                         12.8%      45.5%
                                                      8.0%

                15.0%
                              FA Comércio e
                              Participações

                              28.1%

                    5.6%

                            Shareholders                          Stake
                                                             Direct + Indirect

                            Fernando Luiz Alterio                  31.9%

                            CIE International                      9.8%

                            Gávea Investimentos                    12.8%

                            Shareholders’ Agreement               54.5%

                             Free Float                           45.5%
                                                                                                  3
1. Company Overview
                      4
Company Overview
T4F is the leading live / out-of-home entertainment promoter in South America with a diversified and
verticalized business model
Leading company High Growth and
Our Presence Unique Industry Diversified and
in live entertainment Strong Cash
(Net Revenue 2010) Knowledge Verticalized Model
in South America Generation
3rd largest player Brazil 66% 29 years of experience Net Operation Cash Promotion of multi-
worldwide Flow = 99% of content events
Pioneer in naming rights EBITDA ( ∑ 05-10)
Argentina 20% model in 1999
1.1 thousand shows Venues Operation
Net Revenues CAGR
promoted /2010 Pioneer in online 12% (07-10)
Chile 12% ticketing system in 2000 Food & Beverage and
with Ticketmaster EBITDA CAGR Merchandising
2.8 millions tickets sold / 22% (07-10)
2010 Peru 2% Promotion of the most
Ticketing Services
successful events in Sustainable margins
Brazil, Chile and going forward
Argentina
ONE AND ONLY INVESTMENT OPPORTUNITY IN THE ENTERTAINMENT INDUSTRY IN SOUTH AMERICA
5
Our Business

Live Music                        Sport Events                           Theatrical Production               Performing Arts

     U2           Madonna             Stock Car          Marcas                Cats       The Phantom               Stomp       Cirque Du Soleil
                                                                                          of the Opera

  Metallica       AC / DC           Copa Montana      Mini Challenge        Mamma Mia      Miss Saigon         Blue Man Group        Bodies

                                                             Verticalization

          VENUE OPERATIONS      FOOD & BEVERAGE MERCHANDISING                                      TICKETING SERVICES

                                                          Revenue Sources

                                                                                                 Food & Beverage,
                                                  Sponsorships and     Suites and Hospitality                                   Private
   Box Office          Ticketing Services                                                         Merchandising,
                                                   Naming Rights              Centers                                           Events
                                                                                                   and Parking
                                                                                                                                                   6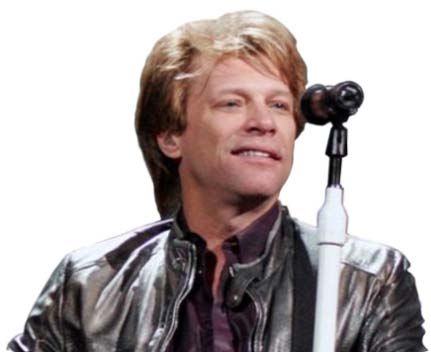
Leadership Position in Live Entertainment
                                 Industry

                               U2                         Bon Jovi
                      3 out of the 11 largest       Promoted the 2 largest
                    shows of 360º World Tour       shows of the 2010 world
                                                             tour

                              Coldplay                                              Madonna

                      Promoted the 1st and 5th                                 3 out of the 5 largest
                      largest shows of all tours                             shows of the tour in 2008

        AC/DC                                          Guns N’ Roses

     The largest                                   Promoted 7 out of the 10
show of the world tour in                          largest shows of the tour
         2009

                                                                                                         7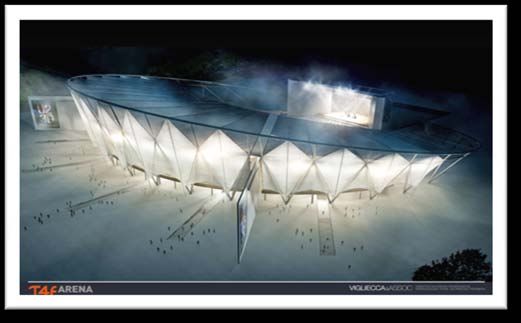
Leadership Position in Live Entertainment
             Industry
                                                   - Almost 1,000 events
                                2006               - 12 cities visited
Cirque du                                          - More than 1.8 million tickets sold
                                2007/8
  Soleil                                           - Performance was Cirque du Soleil’s
                                2009/10            biggest box office in Sao Paulo and 6th
                                                   biggest international box office in 2010

                                2011/13            - Starting in Sep/11 in Sao Paulo

                                                                     Les Misérables,
                 10 different contents
                                                                     Beauty and the Beast,
Theatrical       The only player that ever promoted                  Chicago, Mamma Mia,
                 authentic Broadway productions in the               Phantom of the Opera,
  Plays          region
                                                                     Miss Saigon, Cabaret,
                 More than 3.1 million tickets sold since            The Sound of Music,
                 1999                                                Sweet Charity, Cats.

                  12 races per season in 10 different cities

 Sports
                  Third largest touring car series worldwide
 Events
                  Broadcasted by TV Globo since 2000

                                                                                              8
Upcoming contents

Live Music

                                                   Roger Waters

Performing Arts &
 Theatrical Plays

                                              The Addams Family

         The Witches of
           Eastwick

                                                                  9
2. Investment Highlights
10Investment Case
Attractive Compelling business
Macroeconomic Live Entertainment model and Superior
Environment and Robust Industry Growth Management and
Consumption Growth Expertise
Massive increase in Live music: Superior business model:
disposable income and
Touring became higher return with lower risk
expansion of consumer
base essential for artists Credibility with international
Aggressive growth in and domestic agents and
Expenditure of
South America in terms privileged access to high
entertainment is extremely
of ticket sold and quality entertainment
correlated to consumer
average ticket price providers
spending
11Positive Trends for Expenditures with
Entertainment in Emerging Markets…
Expenditure with Entertainment as a % of the Disposable
2010E-2015E GDP Growth (1)
Income vs GDP per Capita
12.0%
China 75.0%
R2 = 0.66
India 61.8%
Expenditure with entertaiment as a % of disposable income
R2 (ex Argentina) = 0.81 UK
Cambodia 42.8% Japan
10.0%
Peru 40.8%
Singapore 33.8% Spain
Chile 32.9% Argentina USA
New Zeland
8.0%
Brazil 31.1% France
Mexico 30.8% Portugal
Colombia 28.0% Greece
6.0% Croatia Italy
Israel 24.0%
Israel
Argentina 20.0%
New Zeland 18.4%
4.0%
USA 17.0% 5 out of the 11 Brazil
UK 15.1%
largest growths Mexico
Croatia 15.6%
in GDP are in 2.0% Chile
Japan 12.1% China
France 12.1%
South America India
Colombia
Italy 7.8%
Venezuela
Peru
Spain 7.0% 0.0%
Portugal 6.0%
0 10,000 20,000 30,000 40,000 50,000
Venezuela 4.2% GDP per capita in 2009 (US$ '000)
Greece -0.1%
(1) In local currency real terms. Source: Euromonitor.
Source: IMF – World Economic Outlook.
Expenditures with entertainment are expected to significantly increase in emerging markets
12Boom of the Live Entertainment Industry
Live music has significantly increased importance in the music industry, with touring becoming
essential for artists, while recorded music revenues have been shrinking
Total Recorded Music Revenues vs. Total Revenues with
Tickets Sold in North America 2009 Top Music Acts – Sales Breakdown
(US$ billion) (US$ million)
U2 12% 88% 137
13.6
13.1
12.5
Bruce
11.0 5% 95% 105
Springsteen
9.0 Album sales
8.0 Britney Tour Gross
6% 94% 90
Spears
Total
AC/ DC 6% 94% 86
4.6
4.2
3.9
3.6
2.8 3.1
Jonas
9% 91% 79
Brothers
2004 2005 2006 2007 2008 2009
Source: Pollstar Source: Live Nation
13Superior Business Model
EBITDA Margin (2010)
Verticalization Diversification
16.7%
Ability to generate Multi-content platform High
revenues from multiple = reduced risk Margins 1
sources in each event 12.8%
6.5%
High • 42% ROIC and
Returns 32% ROE in 2010
• No revenue concentration
in specific content
Low Risk
• Increased control over the
entertainment value chain
Asset Light Strong Cash Flow
Maintenance capex = 1% Low capex and negative • 99% of EBITDA between
of net revenues; PP&E working capital Strong Cash 2005 and 2010 was
representSolid Sponsorship Revenues Flow
• Content sponsorship, priority benefit, naming rights
sold in our 5 venues North American Annual Growth in Advertisement, Sales
• Over 100 active clients, including major corporations Promotion and Sponsorship
• T4F’s contents attract strong media interest,
generating a significant amount of spontaneous media Advertsing
(about R$500 million per year)
Sales Promotion
11.5%
• Migration of funds from traditional media to Below the
11.4%
Sponsorship
Line – sponsorship is the largest category within
• Sponsorship corresponded to 21% of T4F’s Net 5.9%
Revenue in 2010 3.7% 3.9% 3.9%
3.0%
2.0% 2.0%
Largest Corporate Sponsors 0.6% 0.0%
-0.6%
-3.3%
-4.6%
-7.1%
2007 2008 2009 2010 2011E
Naming Rights Source: IEG.
15High Barriers of Entry
Agreement with Cirque du Soleil valid through 2013
Guaranteed access to
premium content
Exclusivity and non-compete agreement with Live Nation valid through August
2015
Family Entertainment: Disney, Andrew Lloyd Weber, Cameron Mackintosh and
Privileged access to high- the Blue Man Group
quality entertainment Sports: Stock Car, Fórmula Montana and Mini Challenge championship
providers Music Concerts: CAA, William Morris, ITB – International Talent Booking, The
Agency Group, among others
Potential Competitors
Long-term agreements Naming Rights: Citibank, Credicard, Abril and Caixa Econômica Federal
and solid relationships Sponsorships: Bradesco, Credicard, Mastercard, American Express, Citibank,
with corporate sponsors Quilmes, General Motors and Pepsi
Exclusive long-term
access to premium Controls 5 of the most important venues in South America
venues
Various business lines: Latin Music, Anglo Music, Performing Arts, Venues and
The only totally Ticketing
integrated business
Possibility to capture economies of scale on the acquisition of content, by
model operating in four countries
T4F is the most credible producer and promoter in South America, both in
Credibility execution capability and financial strength
163. Growth Strategy
17T4F’s History
Track record of success, growth and regional expansion
Foundation Expansion Consolidation of the Business Model New Expansion Cycle
Expansion to other cities
2008: in Brazil and countries in
Agreement the region
with Live Nation in
South America Construction of venues
1983: Acquisition of companies
Brazil – Opening of Palace(1) 2005:
2011:
(São Paulo) Argentina – Acquisition of Ticketek
Marcas – Brazilian
equivalent to WTCC
2006:
Brazil – Acquisition of
Vicar
Argentina –
2001: Acquisition of Pop Art
Brazil – Opening of Teatro Abril
venue (São Paulo)
1999: Brazil – Acquisition of Citibank Hall
Brazil – Opening of Rio de Janeiro
Credicard Hall (São Paulo)
First year of Broadway
promotion
2007:
Acquisition of control of T4F by Fernando
2000: Alterio and Gávea Investimentos
Brazil: Acquisition of T4F Argentina and T4F
Start of operations of Ticketmaster system Chile
Note(1): Currently, Citibank Hall São Paulo
18T4F’s Drivers for Growth
T4F is the natural consolidator of the South American live entertainment industry
Total potential amount of
approximately R$ 600mm
Strong Financial Profile
Acquisition of
Equipment, 5% Ticketing Service,
7%
Offering Proceeds
Acquisition
Opportunities,
45%
Strong Cash Generation
Construction of
Venues, 35%
Leverage Capacity
Geographic
Expansion, 8%
The IPO will further improve T4F leadership and capture the booming industry prospects
19T4F Outdoor Venue in São Paulo
T4F outdoor venue is expected to be a reference among renowned entertainment venues
Project overview
Designed to fill a gap in high-level entertainment venues
in the São Paulo metropolitan area
Naming rights revenues reaching up to R$ 8 million a
year
Flexible in terms of capacity: events from 15,000 to
60,000 people
Capex should reach R$100 million with expected IRR of
33%
Control of the agenda and integrated model translate
into a strong barrier of entry
Foro Sol – Mexico City, Mexico
20Geographic Expansion
80% of T4F’s revenues in Brazil come from SP and RJ which represent only 17% of Brazil’s GDP
Main Cities in Brazil Main Cities in South America
New / retrofitted Caracas
Colombia
Venezuela
venues to Guiana
Suriname
explore Bogota
French Guiana
Ecuador
Belém
Manaus Fortaleza
Natal Peru
Brazil Recife
Lima
Salvador Bolivia
Brasília
Belo Horizonte
Paraguay
Campinas
Rio de Janeiro
Chile
Sao Paulo Mendoza
Curitiba
Argentina
Porto Alegre Cordoba
Santiago Uruguay
Buenos Aires
680 presentations/year Potential of 400
and 1.5 mm tickets presentations/year and 300 presentations/year Potential of 200
840 thousand tickets and 1.0 mm tickets presentations/year and
sold/year in SP and RJ
sold/year in other cities sold/year in BA and 700 thousand tickets sold
Santiago in other cities
Indicates cities in which T4F is currenlty present.
Cities to which T4F plans to expand operations.
Still a relevant growth opportunity outside Brazil, representing 40% of South America’s GDP
21Selected Acquisition Targets
Fragmented market presents several consolidation opportunities and T4F has already screened
selected acquisition targets which are complementary and synergic.
Venues Festivals
+ 7 venues identified in 5 different states of Brazil + 7 festivals in 5 different cities in Brazil
Complementary in calendar (summer)
Average capacity: from 5,000 to 16,000 people
Well-established brands, mostly in NE region
Exposure to middle class
Promoters Marketing
Promotional Marketing: below the line and event
+ 8 companies operating in specific niches, such companies provides strong synergies with
as: classic music, regional music and dance production (team and equipments), food &
beverage and venues operations
+ 4 sport events companies acting in: car racing,
beach volley, beach soccer, tennis and 11 companies out of 92, aggregate sales of
basketball R$770 mm in 2009
224. Operational and Financial Highlights
23Solid Operational Performance
Net Revenues (R$ mm) and Gross Margin (%) EBITDA (R$ mm) and EBITDA Margin (%)
CAGR: 12% CAGR: 22%
16.8% 16.7%
28.2% 29.2% 12.9%
26.7% 10.6%
24.4% 100.4
95.1
596.6 569.2
404.2 434.6
52.1
46.1
2007 2008 2009 2010 2007 2008 2009 2010
Net Income (R$ mm) and Net Margin (%) Operational Cash Flow vs. EBITDA
CAGR: 15% 351.9
7.9%
6.5% 7.1% 347.7
246.5
214.5 256.8
188.7 99%
210.7
1.4%
46.9
40.3 105.6
26.3 110.3
36.4
58.1
6.0
5.3
2007 2008 2009 2010 2005 2006 2007 2008 2009 2010
EBITDA - Accumulated Cash Generation - Accumulated
Note: Summary of 2009 impacts
• Global crisis impact of R$16.8 mm
• Postponement impact of R$4.7 mm
• H1N1 flu impact of R$21.6 mm
24Historical Financial Information (cont’d)
ROIC, ROE and indebtness metrics
ROIC (1) ROE (2)
(%) (%)
42.0% 46.0%
38.3% 40.6%
31.7%
25.5% 25.0%
4.8%
2007 2008 2009 2010 2007 2008 2009 2010
Net Debt and Net Debt / EBITDA Net Debt Breakdown (as of Jun 2011)
(R$ million) (R$ million)
92
2.0x
29 254,7
0.3x Jun - 2011 112,5
2009 2010
37,7 Net Debt
(1.3x)
Short Term Debt Long Term Debt Cash and
Equivalents (104,5)
(104)
(1)ROIC calculated as NOPAT / (Net PP&E + current assets non cash)
(2)ROE calculated as Net Income/ Average Shareholders’ Equity.
.
25Why Invest in T4F?
One and only investment opportunity in the entertainment industry in South America, with
longstanding track-record and leadership
Strong conversion of EBITDA into cash flow
Asset light model, resulting in high returns and dividend payout capacity
Verticalization and diversification, resulting in high margins and low risk
Unique access to high-quality content
Multi-country operations, creating significant economies of scale and barriers of entry
26You can also read