COROWA SALEYARDS MASTER PLAN - FEDERATION COUNCIL NOVEMBER 2020 - NSW Government
←
→
Page content transcription
If your browser does not render page correctly, please read the page content below
COROWA SALEYARDS
MASTER PLAN
FEDERATION COUNCIL
NOVEMBER 2020
COROWA SALEYARDS MASTER PLAN

DOCUMENT CONTROL
Job ID:                    J001805

Job Name:                  Corowa Saleyards Master Plan

Client:                    Federation Council

Client Contact:            Angela Lawson

Project Manager:           Ashley Page

Email:                     ashley.page@aecgroupltd.com

Telephone:                 0427 022 896

Document Name:             Corowa Masterplan - FINAL

Last Saved:                23/11/2020 12:59 PM

 Version                             Date                  Reviewed               Approved
 Draft V1.0                  12 November 2020                  MD                    ARP
 FINAL                       23 November 2020                  MD                    ARP

Disclaimer:

Whilst all care and diligence have been exercised in the preparation of this report, AEC Group Pty Ltd does not warrant the
accuracy of the information contained within and accepts no liability for any loss or damage that may be suffered as a result of
reliance on this information, whether or not there has been any error, omission or negligence on the part of AEC Group Pty Ltd
or their employees. Any forecasts or projections used in the analysis can be affected by a number of unforeseen variables, and
as such no warranty is given that a particular set of results will in fact be achieved.

                                                                                                                               i
COROWA SALEYARDS MASTER PLAN

EXECUTIVE SUMMARY
BACKGROUND
The Corowa Saleyard is a wholly owned and managed commercial business unit of the Federation Council
(Council), which has been in operation for over sixty years. It consists of yards and associated infrastructure such
as loading ramps, truck wash, canteen, selling and holding pens. The site is:

•   Located on the north-east outskirts of town, at the junction of Honour Avenue and Federation Way

•   Situated on 7.38-hectares

•   The 5th largest in NSW in 2018-19 for sheep throughput

•   The 9th largest in Australia in 2018-19 for sheep throughput

•   Host to Monday sale days commencing at 10:00am

•   Capable of yarding over 800,000 sheep per annum (almost $120 million worth of sheep sales in 2018-19)

•   A key employer in the community, and supports direct employment of approximately 8.4 FTE people, including
    agents and Council staff to support and manage the facility.

CURRENT STATUS & FUTURE STRATEGY
The Saleyards are well regarded in a broad context, however, there is a risk of losing market share to increased
competition from regional saleyards, which have invested heavily in technology and facilities.

Strategic recommendations have been separated into two tranches of investment, including:

•   Essential Improvements: The purpose of the recommendations is to ensure the needs of the current facility
    and operations are met. These should be triggered as soon as is practical pending funding and planning
    requirements.

•   Optional Improvements: The medium to longer-term demand-based expansion recommendations will require
    Council to monitor and assess capacity and demand on an ongoing basis to trigger the optional improvements
    as required (between 5 and 20 years).

STAKEHOLDER ENGAGEMENT
A number of key stakeholders were engaged with throughout the review process. Stakeholders were engaged with
either directly (on site), or via phone interviews. Key stakeholders consulted with include:

•   Council Management and Saleyards staff
•   Canteen operators
•   Agents
•   Buyers
•   Vendors
•   Transporters
•   Councillors.

SALEYARD IMPROVEMENTS
Consistent with the strategic timeframes, investments into the Saleyards have been separated into Essential
Improvements shown in Table ES. 1 and Optional Improvements as shown in Table ES. 2.

                                                                                                                   ii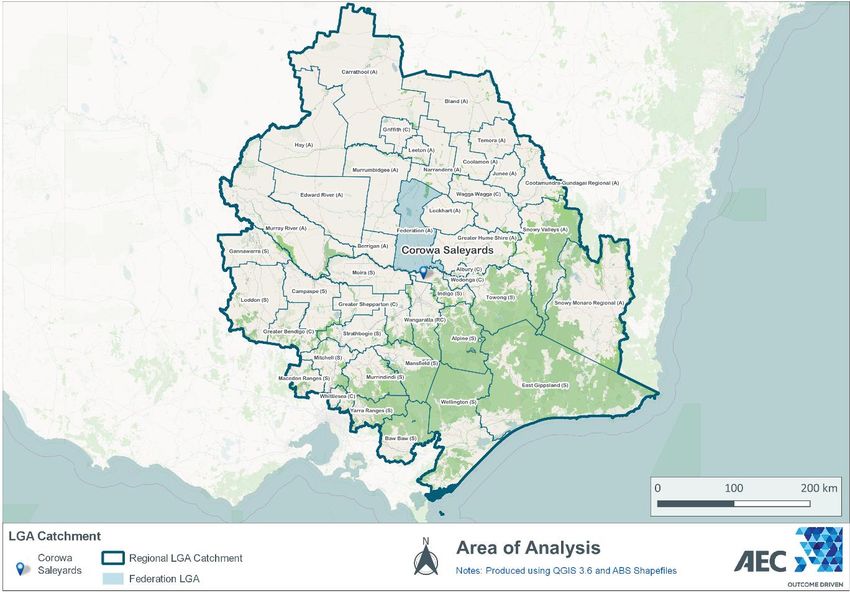
COROWA SALEYARDS MASTER PLAN

Table ES. 1. Essential Improvements
    Works Packages                              2021-22          2022-23
    Roof Over Yards (inc. Solar & Lighting)    $5,790,378       $3,860,252
    Saleyard Expansion                         $2,151,824       $1,434,550
    Admin/ TAFE Building                       $1,239,850       $826,566
    Effluent Management                        $1,077,000       $718,000
    Holding Pen Expansion                       $448,589        $299,059
    Circulating Road Reconfiguration            $367,594        $245,062
    Public Car Park                             $332,548        $221,698
    Stormwater Tanks                            $280,368        $186,912
    Holding Yard Relocation                     $179,903        $119,935
    Expansion to Stormwater Overflow Dam        $137,848         $91,898
    Fencing and Gates                           $119,156         $79,438
    Weighbridge                                 $116,820         $77,880
    Truck Wash Modification                     $87,226          $58,150
    CCTV                                        $70,092          $46,728
    Spelling Yard Grass Area                    $50,622          $33,748
    Demolition of Existing Yards                $26,479          $17,653
    Total Capital Expenditure                  $12,476,296      $8,317,530
Source: AEC, StruXi.

Table ES. 2. Optional Improvements
    Capital Item                                    $
    Solar Panels to All Saleyard Roof          $2,860,000
    Circulation Road (To End of Lot)           $1,101,000
    Circulation Road (Shorter Configuration)    $614,000
    Saleyard Washdown System                    $328,000
    North East Drafting Yard                    $268,000
    Truck Parking Ground                        $186,000
    Future Sheep Yard                           $112,000
    Modification of Existing Ramp               $39,000
    Total Optional Capital Expenditure         $5,508,000
Source: AEC, Struxi

FUTURE DEMAND GROWTH
Four alternative demand scenarios were identified:

•      Scenario 1 (Same as today): The Saleyard throughput remains at the 5-year average of 658,817 per annum.

•      Scenario 2 (Scenario 1 plus 30% increase in market share of surrounding saleyards): The Saleyard
       increases total throughput by 112,000 head over the course of 5 years due to closures at neighbouring
       saleyards, and then reverts to a historical growth rate of 1.6% (annual rate between 2014-15 and 2019-20).

•      Scenario 3 (Scenario 1 plus broader market growth): The Saleyard throughput grows from the 5-year
       average of 658,817 in line with the national forecast, at 4.3% per annum until 2023, and then reverts to a
       historical growth rate of 1.6% (annual rate between 2014-15 and 2019-20).

•      Scenario 4 (Scenario 2 plus Scenario 3): The Saleyard throughput grows from the 5-year average of 658,817
       in line with the national forecast, at 4.3% per annum until 2023, and increases total throughput by 112,000
       head over the course of 5 years, flat after that.

                                                                                                                iii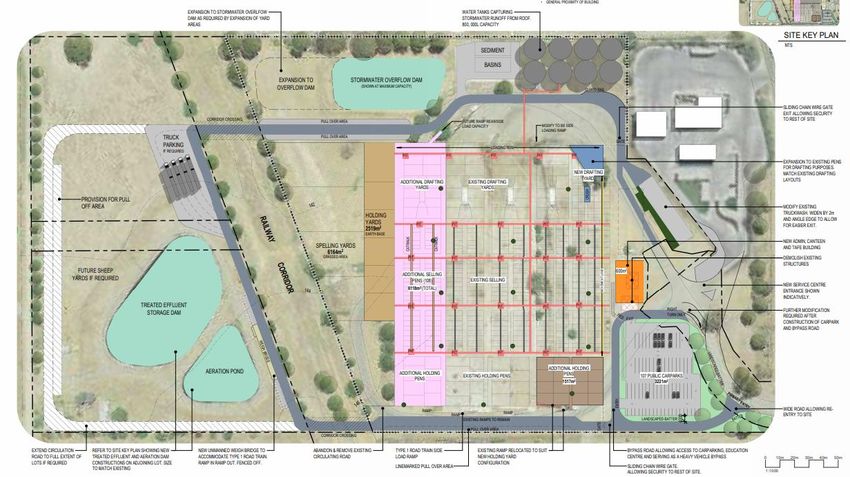
COROWA SALEYARDS MASTER PLAN

FINANCIAL PERFORMANCE
Based on the above Scenarios, the expected financial performance, represented by Net Present Value (NPV),
Internal Rate of Return (IRR) and Modified Internal Rate of Return (MIRR) over 20 years is shown in Table ES. 3.

Table ES. 3. Project Feasibility
                             NPV             IRR             MIRR
    Scenario 1              -$4.3m            NA            7.20%
    Scenario 2              -$2.0m          4.20%           7.69%
    Scenario 3              -$0.7m          6.88%           7.90%
    Scenario 4              $1.5m          10.41%           8.19%
Source: AEC

The analysis has identified that whilst Council is in a position to deliver the project due to the substantial grant
funding that will be available, the level of currently modelled revenues escalating at 2.0% per annum would cover
operational cost increases only and not the additional depreciation or borrowing costs.

To achieve a positive NPV for Option 3 would require an increase in fees of closer to 3.0% per annum (including
the 2.0% base escalation) over the life of the analysis, resulting in an NPV of $772,600 and an IRR of 9.18%. A
more aggressive approach in Years 1 to 5 would achieve the same result earlier, negating the need for longer term
consistently higher fees.

Higher price increases than this would be required to achieve a positive NPV should the actual growth be at the
levels forecast for both Options 1 and 2.

Further consideration of a structured price path is recommended to target the desired return from the asset by
Council.

FINANCIAL IMPLICATIONS TO COUNCIL
The essential improvements in the Master Plan will cost approximately $20.8 million to deliver. The Saleyards have
already been awarded $9.2 million in grant funding from the NSW Stimulus Program to carry out significant capital
works in 2021-22 and 2022-23. Further funding of $11.6 million will be required to complete essential improvements
in the Master Plan. This further funding will be sourced through either further grant funding or loans.

Key financial ratios need to be considered, as borrowing may impact ability to borrow for other council projects:

•     Under all scenarios, the Operating Surplus Ratio is marginally worsened from 2022-23, when compared to the
      current Long-Term Financial Plan (LTFP), with Scenario 4 presenting the best outcome (but still substantially
      below the current dividend produced from operations).

•     Under all scenarios the Net Financial Liabilities Ratio is worsened due to the additional borrowing that is utilised
      to fund the non-grant funded costs of the essential improvements.

•     While the overall position is worsened, the Net Financial Liabilities ratio still remains negative and is well below
      the maximum target of +60.0%.

                                                                                                                        iv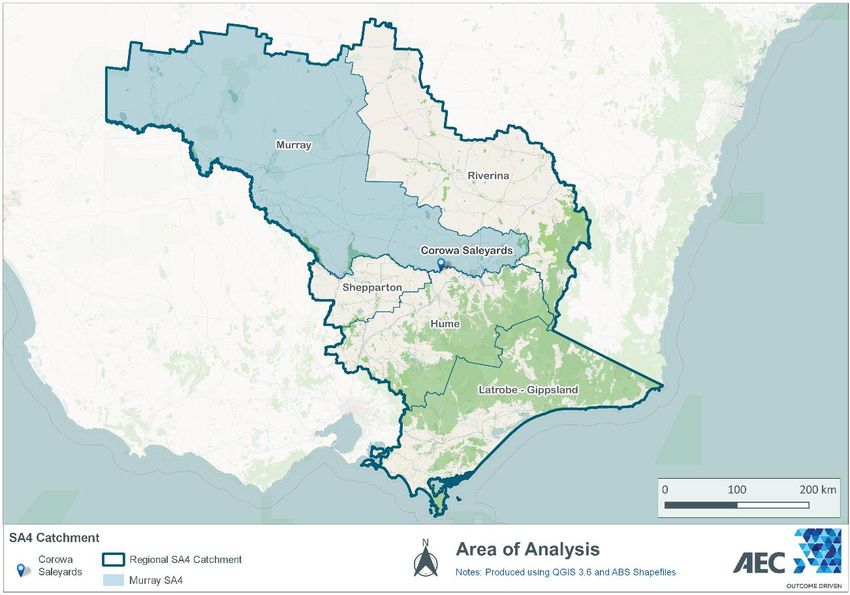
COROWA SALEYARDS MASTER PLAN

TABLE OF CONTENTS
DOCUMENT CONTROL .......................................................................................................................................... I

EXECUTIVE SUMMARY ........................................................................................................................................ II

TABLE OF CONTENTS .........................................................................................................................................V

       INTRODUCTION............................................................................................................................................ 1

1.1        BACKGROUND & PURPOSE ............................................................................................................................ 1

1.2        APPROACH .................................................................................................................................................. 1

       SIGNIFICANCE OF THE SALEYARDS ........................................................................................................ 2

2.1        LOCATION .................................................................................................................................................... 2

2.2        HISTORY...................................................................................................................................................... 2

       INFLUENCING FACTORS & TRENDS ......................................................................................................... 3

3.1        NATIONAL HERD ........................................................................................................................................... 3

3.2        KEY INDUSTRY TRENDS................................................................................................................................. 4

3.3        PRICES ........................................................................................................................................................ 4

3.4        INDUSTRY OUTLOOK ..................................................................................................................................... 5

3.5        SELLING TRENDS.......................................................................................................................................... 6

3.6        KEY FINDINGS .............................................................................................................................................. 7

       SALEYARDS SUPPLY CATCHMENT .......................................................................................................... 9

4.1        REGIONAL CATCHMENT ................................................................................................................................. 9

4.2        REGIONAL SALEYARD DISTRIBUTION ............................................................................................................ 11

       CURRENT & FUTURE DEMAND ................................................................................................................ 12

5.1        PRICING .................................................................................................................................................... 12

5.2        CURRENT DEMAND/ THROUGHPUT ............................................................................................................... 13

5.3        FUTURE DEMAND/ THROUGHPUT ................................................................................................................. 14

       SITE LAYOUT & FACILITIES ..................................................................................................................... 17

6.1        SITE POSITION ........................................................................................................................................... 17

6.2        CAPACITY .................................................................................................................................................. 18

6.3        KEY ISSUES ............................................................................................................................................... 18

       SITE DEVELOPMENT ................................................................................................................................. 23

7.1        PROPOSED SITE LAYOUT ............................................................................................................................ 23

7.2        CAPITAL COSTS .......................................................................................................................................... 24

       FINANCIAL ANALYSIS ............................................................................................................................... 25

8.1        KEY ASSUMPTIONS ..................................................................................................................................... 25

8.2        PROJECT OUTCOMES.................................................................................................................................. 27

8.3        FINANCIAL PERFORMANCE ........................................................................................................................... 28

8.4        IMPLICATIONS FOR LONG TERM FINANCIAL PLAN ........................................................................................... 29

                                                                                                                                                                          v
COROWA SALEYARDS MASTER PLAN

REFERENCES...................................................................................................................................................... 31

APPENDIX A: CONCEPT PLAN DETAIL ............................................................................................................ 33

APPENDIX B: ADMINISTRATION AND TRAINING BUILDING .......................................................................... 44

APPENDIX C: SALEYARD FINANCIAL MODEL REPORTS .............................................................................. 47

                                                                                                                                                                vi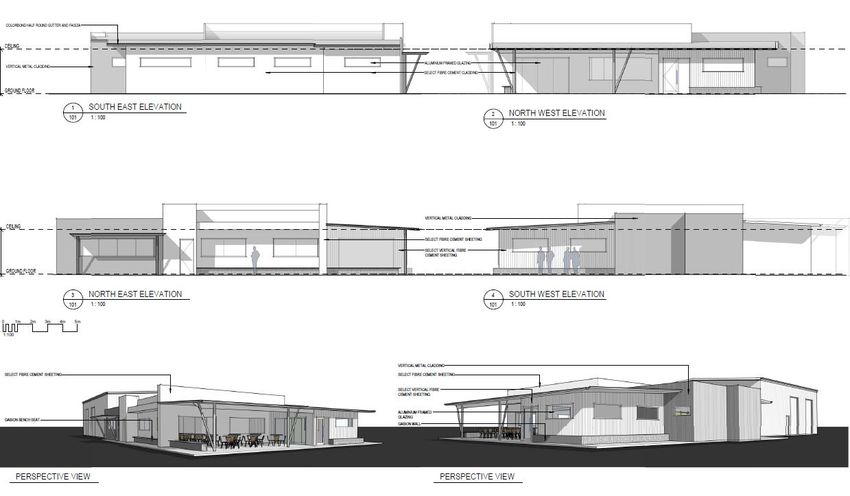
COROWA SALEYARDS MASTER PLAN

            INTRODUCTION
1.1         BACKGROUND & PURPOSE
The Corowa Saleyard is a wholly owned and managed commercial business unit of the Federation Council
(Council), which has been in operation for over sixty years. It consists of yards and associated infrastructure such
as loading ramps, truck wash, canteen, selling and holding pens.

The purpose of the Master Plan is to:

•     Ensure that the Saleyard can accommodate the future needs of the regional livestock selling sector and be
      best placed to take advantage of the changing industry and any opportunities that arise.

•     Provide clarity and demonstrate commitment to all stakeholders on the Saleyard’s vision and future direction,
      including infrastructure footprint, functionality, and funding requirements.

•     Clearly communicate to existing and potential users how the Saleyard intend to retain and grow its market
      position.

•     Clearly articulate and demonstrate the benefits and sustainability of the Saleyard to support funding
      applications for capital investment from other tiers of Government.

1.2         APPROACH
The methodology used in undertaking this review involved a number of key phases, with many of the aspects run
concurrently:

•     Situational Analysis: To understand the current and potential future operating environment of the facility and
      the broader market for livestock sales locally, nationally, and globally. Comparisons and benchmarks were
      developed and used where appropriate.

•     Site Inspection & Sale Observations: Site inspections of the facility were conducted, including observation
      of a sale day. This phase also included a workshop with the steering committee and key stakeholders (agents)
      to review and prioritise the key findings of the site inspection and sale day observations.

•     Consultation & Engagement: Face to face, phone, and workshop engagement with key stakeholders to
      clarify the critical strengths and limitations of the facility and ensure the Master Plan addressed key stakeholder
      needs moving forward. The key stakeholders consulted with included:

      o   Council Management and Saleyards staff
      o   Canteen operators
      o   Agents
      o   Buyers
      o   Vendors
      o   Transporters
      o   Councillors.

•     Facilities Requirements & Prioritisation: A list and description of the best practice response to facilities
      upgrade/ needs was developed to clarify preferred direction for the Master Plan.

•     Operational Review: This phase built on the review of the current operating structure of the yards and the
      financial implications of the Master Plan to ensure the proposed infrastructure upgrades were accounted for
      and to assess the impact on Council’s bottom line. This stage included a review of pricing and recommended
      price path(s) for the facility.

•     Master Plan Development (this document): A series of documents and Master Plan graphics/ layouts/
      images were developed to reinforce and communicate the findings of the research, a including a vision for the
      Saleyard and recommendations regarding the future development of the Saleyard.

                                                                                                                       1
COROWA SALEYARDS MASTER PLAN
SIGNIFICANCE OF THE SALEYARDS
2.1 LOCATION
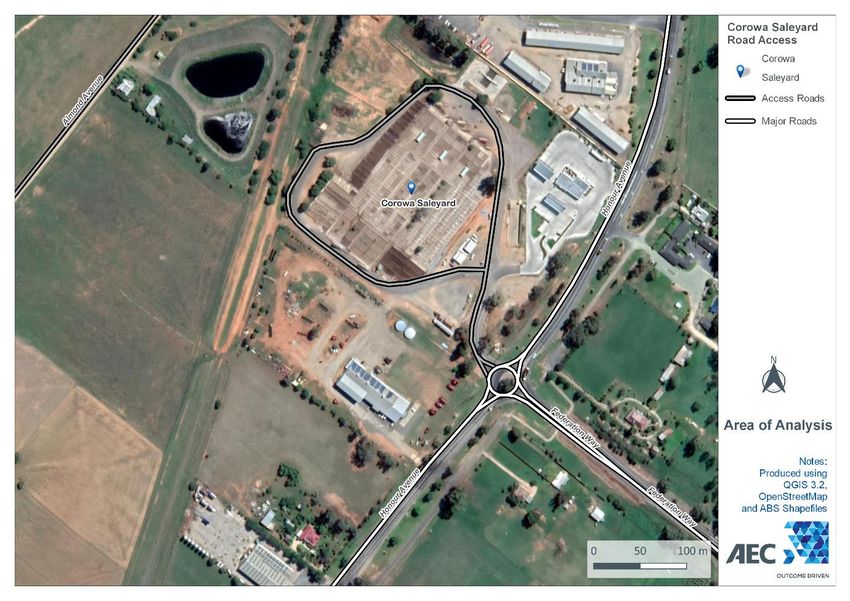
Corowa saleyard is located on the northeast outskirts of Corowa on Honour Ave.
Figure 2-1. Corowa Saleyards Site Location
Source: AEC.
2.2 HISTORY
The Corowa Saleyard is a wholly owned and managed commercial business unit of the Federation Council
(Council), which has been in operation for over sixty years. It consists of yards and associated infrastructure such
as loading ramps, truck wash, canteen, selling and holding pens. The site is:
• Located on the north-east outskirts of town, at the junction of Honour Avenue and Federation Way
• Situated on 7.38-hectares
• The 5th largest in NSW in 2018-19 for sheep throughput
• The 9th largest in Australia in 2018-19 for sheep throughput
• Host to Monday sale days commencing at 10:00am
• Capable of yarding over 800,000 sheep per annum (almost $120 million worth of sheep sales in 2018-19)
• A key employer in the community, and supports direct employment of approximately 8.4 people, including
agents and Council staff to support and manage the facility.
2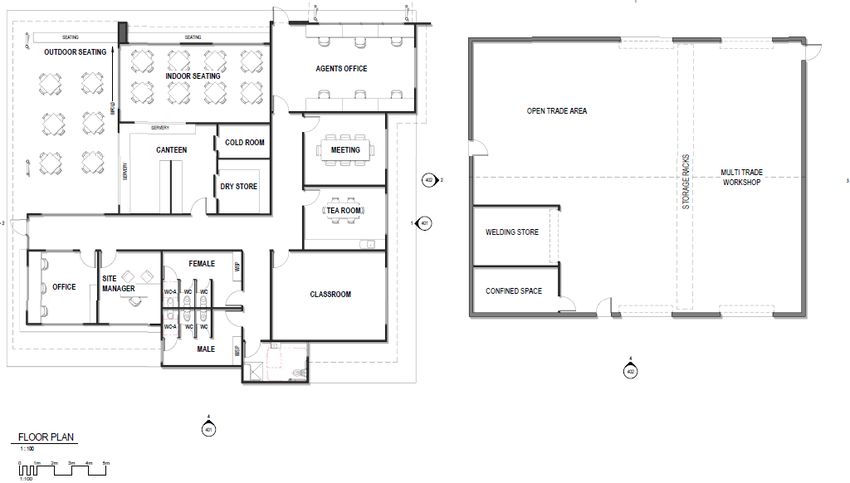
COROWA SALEYARDS MASTER PLAN

            INFLUENCING FACTORS & TRENDS
This section considers the key economic trends and drivers impacting on the sheep industry, the saleyards sector
and the implications for the Corowa Saleyards. Additional information and detail relating to the key influencing
factors and trends is included a separate Technical Appendix Corowa Saleyard Master Plan (CSMP) –
Business Review & Situational Analysis.

3.1         NATIONAL HERD
The Australian sheep and lamb flock, estimated at around 65.8 million in 2018-19, are largely concentrated in
Southern and Eastern States as shown in Figure 3-1 (ABS, 2020a). Over the past five years the national flock has
declined by 2.0% per annum, due largely to periods of significant drought and subsequently destocking.

Figure 3-1. Australian Sheep & Lamb Numbers by State (2018-19)

Source: ABS (2020).

Annually approximately 45% of the national flock is slaughtered per annum, with approximately 33% of the being
lamb slaughters and the remaining 12% being sheep, as shown in Figure 3-2.

                                                                                                              3
COROWA SALEYARDS MASTER PLAN
Figure 3-2. National Flock & Slaughter, Actual & Projected
80,000
70,000
60,000
50,000
40,000
30,000
20,000
10,000
-
2014 2015 2016 2017 2018 2019 2020 2021 2022
National Flock (Sheep & Lamb) Slaughterings - Sheep Slaughterings - Lamb
Source: AEC, MLA (2018).
3.2 KEY INDUSTRY TRENDS
In 2019, Australia was the world’s largest exporter of sheep meat and the second largest producer of lamb and
mutton (MLA 2019b). Wool production is the third largest contributor to the annual value of Australian agricultural
production in 2018-19, contributing $4.4 billion in gross value (ABS, 2020b). Additionally, sheep and lamb meat is
the fifth largest contributor, with a gross value of production totalling $4.2 billion over the same period (ABS, 2020b).
The Australian sheep and lamb industry has experienced periods of significant growth and endured some
challenging conditions including extreme drought and temporary bans on live exports to the market in the Middle
East. Some of the key positive and negative industry trends are presented in Table 3-1.
Table 3-1. Australian Industry Trends
Positive Impacts Negative Impacts
• Global consumption increasing • Severe long-term drought has reduced the
• Weaker Australian dollar potential pool livestock
• Increasing market access through Free Trade • Fires throughout Victoria and New South Wales
Agreements (FTA) have decreased vegetation and stock numbers
• Increase in prices • Community support to phase out live sheep exports
• Australia positioned as a cost-competitive producer • Temporary ban on lives sheep exports to the
Middle East in June – September 2019
• Decrease in sheep meat production in New
Zealand due to a shift to dairy in recent years • Ongoing US-China trade disputes
(MLA, 2020f) • Disruptions to supply and logistics (processing, sea
freight and air freight) due to the COVID-19
pandemic
Source: AEC.
3.3 PRICES
Over the past five years, trade lambs and merino lamb prices have increased year on year to reach an average of
849 c/kg carcase weight (cwt) and 810 c/kg cwt in 2020 respectively. Over the past five years, trade lambs have
increased on average 9.3% per annum while Merino Lambs have increase by 10.8% on average per annum.
Mutton prices have seen the largest increases over 2019 (up 17%) and 2020 (up 22%) to reach 631 c/kg cwt.
4COROWA SALEYARDS MASTER PLAN
Figure 3-3. Australian Sheep & Lamb Prices (Saleyard Indicators)
1000
900
800
700
600
C/kg cwt
500
400
300
200
100
0
2015 2016 2017 2018 2019 2020
Trade Lamb Merinio Lamb Restocker/feeder Lamb Mutton
Notes: Prices are representative of a calendar year. 2020 data available to the 26th May.
Source: MLA (2020).
3.4 INDUSTRY OUTLOOK
Overall, the market outlook for the Australian sheep and lamb industry is positive, however, it is subject to several
significant domestic and international uncertainties including rainfall levels, pest and disease outbreaks, and future
trade relations. The industry is highly sensitive to international market factors, with 66% of total lamb production
and 96% of total mutton production in Australia being exported in 2018-19 (MLA, 2019b). Irrespective of the final
destination (i.e. export or domestic consumption) market prices are impacted by global market factors.
A summary of the key drivers influencing the sheep and lamb industry outlook is provided in Table 3-2.
Table 3-2. Summary of Key Drivers and Outlook
Factor Outlook COVID-19 Impact
Global Factors
The current impacts of COVID-19 have seen
strong demand for red meats within
supermarkets, especially cheaper/ value
meat products (MLA, 2020c). The closure of
many restaurants and hotels have seen a
softening in the demand for higher end cuts
Global Meat
Growing global demand, led by China. of meat for the foodservice sectors (MLA,
Consumption
2020e).
Demand for sheep meat in the Middle East
and North African countries have softened
due to constrained consumer spending and
low oil prices (MLA, 2020g).
Australia and New Zealand account for over
70% of global exports and are two of the
most efficient and cost-competitive producers Supply chain challenges including port
Global Meat (MLA, 2020b). Decrease in sheep meat bottlenecks, refrigerated container (reefer)
Production production in New Zealand due to a shift to availability, disruptions to air freight (MLA,
dairy in recent years (MLA, 2020f). The 2020d).
longer-term outlook remains volatile due to
seasonal conditions.
5COROWA SALEYARDS MASTER PLAN
Factor Outlook COVID-19 Impact
Subject to ongoing negotiations and
commitment to freeing trade. Deteriorating
COVID-19 will have future impacts on trade
Trade trade relations between the US and China
relations, however at this point in time, the
Relations may impact the future growth of US beef
extent of these impacts are unknown.
exports, with flow on implications for
Australian export demand.
Uncertain as industry is subject to
international standards and regulations.
Pests/ Australia’s Foot and Mouth Disease (FMD)
Nil
Diseases free status is a significant trade advantage
over FMD endemic producers such as Brazil
and Argentina.
Depreciating against the USD to levels not
Softening due to Australia’s comparably low
Australian seen since the global financial crisis. Prices
interest rates and global uncertainty
Dollar for exports have become more globally
regarding US and Chinese trade relations.
competitive.
National Factors
Fuel prices are decreasing due to drop in
Input Prices
Subject to significant uncertainty, with demand from travel restrictions. However,
(Fuel, energy,
volatility in fuel and electricity prices. with travel restrictions beginning to ease, fuel
feedstock)
prices are likely to increase once again.
Implementation of JobKeeper payment will
Labour Costs Wage growth remains relatively flat. provide a wage floor for eligible employees
and businesses (RBA, 2020).
Uncertain subject to local/Australian
Pest/ Diseases Nil
standards and regulations.
Local/ Regional Factors
Rainfall/ Uncertain with increasing risk of variability,
Growing regional producers currently facing drought Nil
Conditions conditions (refer to Appendix B).
Uncertain subject to local/Australian
standards and regulations, with any national
Pest/ Diseases Nil
disease outbreak likely to impact the market
for local production.
Uncertainty around the impacts of COVID-19
Overall Market Strong subject to key production and market
and the timeframe for a return to ‘normal’
Outlook uncertainties.
patterns.
Source: AEC.
3.5 SELLING TRENDS
The last ten years have been a period of restructuring in the Australian saleyards sector with major rationalisation
of older, local government owned and operated facilities. The restructuring has been in response to several drivers
of change including those specific to the agricultural sector as well as broader macro trends in policy, market and
environmental factors, summarised in Table 3-3 with additional detail provided in the following sections.
Table 3-3. Summary of Selling Trends
Trend Description Implications
Policy Factors
Currently provided as guidelines and not
currently enforceable but are facing Pen sizes/ capacity, flow logic, designs to
Animal Welfare
increased consumer and industry demands minimise risk to livestock and people.
to be legislated.
Appropriate storm and wastewater
Increase in environmental legislation and
Environmental management systems and processes in
enforcement activity.
part through roofing and truck wash design.
6COROWA SALEYARDS MASTER PLAN
Trend Description Implications
Safety management systems and controls
Heavy Vehicle National Law (HVNL)
Chain of required to be in place, affecting business
changed to ensure all parties have a duty to
Responsibility practices, training procedures and review
ensure the safety of transport activities.
processes.
Environmental & Industry Structural Factors
Climatic Variations in rainfall conditions affecting Capacity to deal with large volumes of
Variation saleyard throughput. livestock due to de-stocking.
State of the art facilities to reduce stock
Technological Roofing, soft floors and modernised
processing times, minimise animal stress
Change drafting, weighing and transport facilities.
and improve buyer observation.
Enhanced markets, stronger throughout,
There are many instances of selling centres
efficient, more responsive prices and
Economies of expanding and effectively overtaking
greater market strength. Smaller yards
Scale smaller yards and operating as a regional
need to develop niche service, grow or risk
selling centre.
obsolescence.
Improvements in road infrastructure, vehicle
Increased competition between saleyards
technology and meat science which allows
Logistics Costs that are a significant distance apart and the
travel distance to be increased without
emergence of regional selling centres.
impacts on livestock.
Selling Methods
Have always taken place but increasing due
Over-the-Hooks Graziers selling directly to processors from to improved pricing. Market share is modest
(Direct) Selling the paddock. however compared to mainstream
auctioning methods.
Have a broad regional area to purchase
sheep and lamb and are susceptible to Having saleyard facilities of a high quality
Abattoirs
mergers/ acquisitions which could weaken and reputation attracting higher prices.
competition.
Sites such as www.auctionsplus.com.au Auctions Plus now has an established
Online Selling allow graziers to trade without the use of market share and may present a
saleyards. competitive challenge in the future.
The ACCC reported that saleyards have a Weak saleyard competition will have a
susceptibility to anti-competitive conduct broad impact on the industry making them
Conduct
and a high risk of conflicts of interests for less competitive against alternative selling
agents. methods.
Source: AEC.
3.6 KEY FINDINGS
Key findings of the review of the market and industry trends include:
• The broader regional catchment area (comprised of SA4’s) incorporates a sheep and lamb flock of
approximately 9.2 million head as of 2018-19.
• In 2019 Australia was the largest sheep meat exporter, exporting approximately $4.1 billion worth of sheep
meat (MLA, 2020f). New South Wales has the largest flock of sheep and lamb, followed by Western Australia
and Victoria.
• Over the years, the weaker Australian dollar, increasing market access through FTA and the removal of some
international tariffs under the agreements have provided favourable conditions for the industry. The industry
has endured some challenging operating conditions with severe weather conditions impacting production.
• The full impacts of COVID-19 are not yet fully realised, however there are a number of challenges/ implications
for the supply chain, especially on a global level.
7COROWA SALEYARDS MASTER PLAN
• The saleyards sector has experienced significant change and industry consolation over recent years. This has
been driven by a number of factors, including:
o The demand for saleyards has decreased over the years with online selling methods gaining significant
foothold in the market. Direct selling is also increasing, further increasing competition for traditional
saleyards.
o The saleyards sector is moving towards larger yards with increased economies of scale and capacity to
attract buyers. The upgrades of regional saleyards with greater technology allows for reduced stock
processing time, minimum stress to animals and greater opportunities for buyers to observe the stock.
8COROWA SALEYARDS MASTER PLAN
SALEYARDS SUPPLY CATCHMENT
The following sections review the location of the Corowa Saleyards and the regional catchment in which the
saleyard operates.
4.1 REGIONAL CATCHMENT
The Corowa Saleyards are located on Honour Ave, Corowa, NSW and had an estimated turnover of approximately
794,263 sheep in 2018-19 (MLA, 2019a).
For the purposes of this report, two catchment areas have been applied based on available data.
• A smaller more direct catchment, incorporating a series of Local Government Areas (LGAs) within a 250km
radius of Corowa Saleyards
• A broader regional catchment area incorporating the following Statistical Areas 4’s (SA4’s). The SA4 catchment
includes all of the LGA’s in the local catchment.
o Murray
o Riverina
o Shepparton
o Hume
o Latrobe – Gippsland.
4.1.1 Direct Catchments (LGAs)
The direct Corowa Saleyards catchment (compromised of LGA’s) area was estimated to host a flock of sheep and
lambs totalling 11.1 million head in 2015-16 (ABS, 2017).
Figure 4-1. Direct Catchment
Source: AEC.
9COROWA SALEYARDS MASTER PLAN
4.1.2 Broader Regional Catchment (SA4)
The broader regional catchment area (comprised of SA4’s) incorporates a sheep and lamb flock of approximately
9.2 million head as of 2018-19. Numbers have fluctuated over the past five years with a significant decline of 1.3
million in 2018-19. This decline is largely attributed to areas being affect by drought.
Figure 4-2. Broader Regional Catchment
Source: AEC.
Table 4-1. Total Number of Sheep & Lamb in Catchment SA4 Areas
12,000,000 15.0%
10,000,000 10.0%
8,000,000 5.0%
Total Sheep & Lambs No.
6,000,000 0.0%
4,000,000 -5.0%
2,000,000 -10.0%
0 -15.0%
2013-14 2014-15 2015-16 2016-17 2017-18 2018-19
Murray Riverina Shepparton
Hume Latrobe - Gippsland Total Annual Growth
Note: Total numbers includes breeding ewes.
Source: ABS (2015,2016,2017,2018,2019,2020).
10COROWA SALEYARDS MASTER PLAN
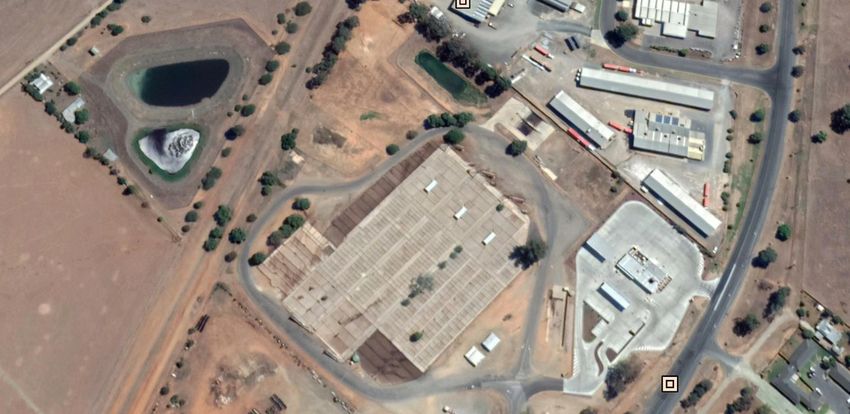
4.2 REGIONAL SALEYARD DISTRIBUTION
The regional sheep industry is serviced with a total of eight alternative sheep saleyards being situated within 250km
of Corowa Saleyards as seen in Figure 4-3.
The closest alternative sheep saleyard to the Corowa Saleyards is the Finley Saleyards (approximately 100km).
Figure 4-3. Saleyards within 250km of Corowa
Source: AEC.
The Corowa Saleyards is in a relatively strong market position, selling approximately 790,000 sheep in 2018-19.
Comparison of Corowa Saleyards with alternative regional selling facilities is presented in Table 4-2 below.
Table 4-2. Sheep Throughput at Saleyards in the Regional Catchment (~250km Radius)
Saleyard 2017-18 2018-19 State % of State % Change
Corowa Saleyards 625,000 794,268 NSW 9.30% 27.10%
Bendigo Livestock Exchange 1,375,326 1,553,494 VIC 30.40% 13.00%
Wagga Wagga Saleyards 1,815,559 1,753,571 NSW 20.50% -3.40%
South Eastern Livestock Exchange 802,779 860,150 NSW 10.10% 7.10%
Deniliquin Saleyards 215,690 215,948 NSW 2.50% 0.10%
Shepperton Saleyards 103,027 79,809 VIC 1.60% -22.50%
Finley Livestock Exchange 79,754 109,849 NSW 1.30% 37.70%
Cootamundra Saleyards 101,794 83,109 NSW 1.00% -18.40%
Hay Saleyards 53,340 37,163 NSW 0.40% -30.30%
Jerilderie Saleyards n.a. 20,728 NSW 0.20% n.a.
Narrandera Saleyards n.a. 7,650 NSW 0.10% n.a.
Temora Saleyards n.a. 3,685 NSW 0.00% n.a.
Source: MLA (2019).
11COROWA SALEYARDS MASTER PLAN
CURRENT & FUTURE DEMAND
5.1 PRICING
The comparison of fees and charges at the Corowa Saleyard are presented in Figure 5-1. The primary source of
revenue for the Saleyard is Agents Fee’s at $1.67. These fees are comparable to other benchmarked facilities:
• Bendigo Livestock Exchange’s sheep and lamb yard dues are $0.80 per head, with an additional $0.10 sheep
loading fee.
• Kyneton charges $1.35 per head yard dues, with an additional agent’s fees of 0.6% of the sale price. Assuming
$180 per head, this is an additional $1.08 per head.
• Yard dues at Shepparton are based on a standard fee of $1.05, with a $0.20 selling fee per head. In addition,
there are fixed agents’ fees which are annually charged, and excluded from this analysis.
• Wagga Wagga LMC per head charges vary with sale prices, ranging from $0.54 ($140) per
head. For comparison, a sale price of $180 has been assumed, therefore $1.54 per head. Further, there is an
agent’s fee of $0.19 per head.
Figure 5-1. Comparison of Yard Dues Per Head of Sheep & Lamb, 2019-2020
Source: City of Greater Bendigo (2019), Wagga Wagga City Council (2019), Federation Council (2019), Macedon Ranges Shire Council (2019).
Direct comparison of prices for livestock selling centres is challenging due to varying pricing methods and
agreements between operators, agents, and graziers. However, Table 5-1 attempts to provide a comparison where
possible.
Table 5-1. Comparison of Fees & Charges, 2019-20
Fee or Charge Corowa Wagga Shepparton Bendigo LX Kyneton
Sheep per head $1.67 $1.73 $1.25 $0.90 $2.43
Truck wash - per min $0.90 $0.81 $1.20 $1.35 $1.40
Truck wash - key acquisition $35.00 $42.00 - $37.15 $25.00
Dead stock removal - Calves/Sheep $200.00 $55.00 - $204.00 -
Source: City of Greater Bendigo (2019), Wagga Wagga City Council (2019), Federation Council (2019), Macedon Ranges Shire Council (2019),
AVDATA.
12COROWA SALEYARDS MASTER PLAN
Figure 5-2 contains the Corowa Saleyard prices relative to the average of other facilities for like services. This
shows Corowa is slightly more expensive on a per head basis, cheaper for truck wash use, and significantly more
expensive for dead stock removal of calves/ sheep relative to competitors.
Figure 5-2. Corowa Saleyard Prices relative to Average
60%
50%
40%
30%
20%
10%
0%
-10%
-20%
-30%
Sheep per head Truck wash - per min Truck wash - key Dead stock removal -
acquisition Calves/Sheep
Note: Bendigo Livestock Exchange charges for dead stock removal of calves/sheep is comparable to Corowa (see Table 5-1).
Source: AEC.
5.2 CURRENT DEMAND/ THROUGHPUT
Table 5-2 highlights sheep throughput over a three-year period, comparing benchmarked facilities against the
Corowa Saleyards. Corowa Saleyards is New South Wales’ 5th largest saleyard in terms of sheep throughput,
representing a significant 9.3% of the total reported throughput in the State in 2018-19. During 2018-19, the
saleyard recorded 794,263 head of sheep, increasing by 27.1% from the previous year.
Table 5-2. Sheep Throughput at Similar Saleyards
% of %
Saleyard 2016-17 2017-18 2018-19 State Change
18-19 18-19
Corowa Saleyards 616,971 619,889 794,268 9.3% 27.1%
South Eastern Livestock Exchange 693,594 802,779 860,150 10.1% 7.1%
Wagga Livestock Marketing Centre 1,658,162 1,815,559 1,753,571 20.5% -3.4%
Deniliquin Saleyards 167,119 215,690 215,948 2.5% 0.1%
Finley Livestock Exchange 89,687 79,754 109,849 1.3% 37.7%
Shepparton Regional Saleyard1 96,765 103,027 79,809 1.6% -22.5%
Bendigo Livestock Exchange1 877,445 1,024,000 1,154,017 22.6% 12.7%
Kyneton Saleyards1 n.a. 10,474 12,218 0.2% 16.7%
Note: 1 Saleyards listed in VIC
Source: MLA (2018,2019).
All of the saleyards listed in Table 5-2 above, with the exception of Corowa Saleyards, also sell significant numbers
of cattle in additional to conducting sheep sales. However, cattle are not the focus of this analysis and have
therefore been excluded.
13COROWA SALEYARDS MASTER PLAN
5.3 FUTURE DEMAND/ THROUGHPUT
Demand for the existing facility will be impacted both positively and negatively by several factors, including:
• The quality of the facility and services provided
• The availability of alternative facilities
• Overall market and industry growth (sheep production).
This section reviews some of these factors at a high level and provides an overview of the demand scenarios that
have been used to assess the prospects of the Saleyards.
5.3.1 Quality of the Facility & Services
Whilst there is currently strong demand and usage of the facility, it is clear that there are increasing capacity
constraints that are impacting on Councils’ ability to maintain and provide a facility of sufficient quality to sustain
and grow beyond the current level of demand. Many surrounding facilities are of a similar age and would also be
experiencing issues of declining quality without investment.
The opportunity therefore exists to upgrade and deliver a higher quality facility that will differentiate the saleyard,
improve the quality of services provided, and support consistent growth into the future.
5.3.2 Availablity of Alternatives
Table 5-3 below, shows the existing throughput of some neighbouring regional saleyards, and demonstrates the
level of potential increase Corowa Saleyards could achieve, should they secure between 20% to 40% of these
markets. On average these facilities could contribute over 100,000 head per annum to the Corowa Saleyards.
Table 5-3. Potential Short-Term Throughput
% Secured for
30%
Saleyard 2017-18 2018-19 Average Corowa
Throughput
(Range)
Shepparton 96,765 103,027 99,896 20-40% 29,969
Finley 89,687 79,754 84,721 20-40% 25,416
Deniliquin 167,119 215,690 191,405 20-40% 57,421
Total 353,571 398,471 376,021 20-40% 112,806
Source: MLA (2019), AEC.
5.3.3 Overall Market Growth
The Australian flock has declined significantly over the past 50 years and is approximately a third of what it was in
the 1970s, when it was approximately 180 million head (ABC, 2020). The decline in numbers has partially been
the result of transitioning from wool to meat as the primary product, combined with adverse weather and droughts.
However, from 2020 through 2023 the MLA is predicting a 13% increase in the national flock, to reach 71.4 million
head by 2023 (MLA, 2020h). Overall national sales of lamb and mutton is expected to increase by 12% and 20%
respectively between 2020 and 2023, an overall annual rate of growth of 4.3% per annum.
14COROWA SALEYARDS MASTER PLAN
Figure 5-3. National Slaughter (Throughput) Forecast
35,000,000
30,000,000
25,000,000
20,000,000
15,000,000
10,000,000
5,000,000
-
2015 2016 2017 2018 2019 2020 2021 2022 2023
Mutton Lamb
Source: MLA (2020h).
The Corowa Saleyards have consistently maintained their share of the total NSW, and Australian markets on an
annual basis, maintaining approximately 7.0% to 9.0% of the total NSW market, and 4.0% to 5.0% of the national
saleyard throughput.
Table 5-4. Corowa Market Position & Share
Corowa Saleyards 2015 2016 2017 2018 2019
Throughput
Corowa Saleyards 624,055 633,791 616,971 625,000 794,268
NSW Saleyards 7,813,257 8,150,906 8,383,486 9,029,766 8,556,753
Australian Saleyards 15,575,827 12,949,251 15,464,418 16,398,311 16,600,344
Australian Slaughters (OTH(a) & Saleyards) 31,451,135 29,900,546 29,963,230 32,204,782 30,972,465
Market Share
NSW 8.0% 7.8% 7.4% 6.9% 9.3%
Australian Saleyards 4.0% 4.9% 4.0% 3.8% 4.8%
Australian – OTH(a) & Saleyards 2.0% 2.1% 2.1% 1.9% 2.6%
Note: a) OTH = Over-the-hook.
Source: AEC, MLA (2015, 2016, 2017, 2018, 2019).
5.3.4 Demand Scenarios
Four possible future demand scenarios have been assessed as part of this review, and a summary of these is
included in Table 5-5.
Table 5-5. Demand Scenarios used in Financial Modelling
Scenario Assumption Description
Same as today The Saleyard throughput remains at the 5-year average throughput
1
of 658,817 in every year.
Scenario 1 The Saleyard increases total throughput by 112,000 head over the
plus 30% increase in course of 5 years due to closures at neighboring saleyards, and then
2
market share of reverts to a historical growth rate of 1.6% (annual rate between
surrounding saleyards 2014-15 and 2019-20).
15COROWA SALEYARDS MASTER PLAN
Scenario Assumption Description
The Saleyard throughput grows from the 5-year average of 658,817
Scenario 1
in line with the national forecast, at 4.3% per annum until 2023, and
3 plus broader market
then reverts to a historical growth rate of 1.6% (annual rate between
growth
2014-15 and 2019-20).
The Saleyard throughput grows from the 5 years average of 658,817
in line with the national forecast, at 4.3% per annum until 2023, and
Scenario 2
4 increases total throughput by 112,000 head over the course of 5
plus Scenario 3
years, and then reverts to a historical growth rate of 1.6% (annual
rate between 2014-15 and 2019-20).
Source: AEC
A further scenario was considered, based on the effects of the EPA capacity reduction, whereby the Saleyard is
forced to only operate every second week as it is unable to cope with the effluent capacity at the yards. The
assumption under this scenario would have seen a throughput of 75% of the 5-year average. This scenario,
however, was not considered further due to the commitment to develop the saleyard and resolve the EPA issues.
Figure 5-4 shows the annual throughput for the Saleyards under the demand scenarios described above.
Figure 5-4. Throughput Forecasts, Demand Scenarios
1,400,000
1,200,000
1,000,000
800,000
600,000
400,000
200,000
-
Flat Flat + Closures
Growth Growth + Closures
EPA Capacity Reduction
Source: AEC.
16COROWA SALEYARDS MASTER PLAN
SITE LAYOUT & FACILITIES
6.1 SITE POSITION
The Corowa saleyard is located on the north-east outskirts of the town of Corowa on Honour Avenue. The site is constrained to the north by industrial developments and
residential rural land uses to the south. The western boundary adjoins to a railway corridor, which separates it from more residential rural land uses. The eastern boundary is
shared with a service station and the two share a common road that services the two lots.
Figure 6-1. Corowa Saleyards Existing Site Layout & Facilities
Source: StruXi
17COROWA SALEYARDS MASTER PLAN
6.2 CAPACITY
Figure 6-2 shows weekly saleyard throughput, over the past three years (overlaid on top of each other). This sales
profile shows that while sales are volatile (peaks and troughs), with three weeks in 2018-19 exceeding the official
operating capacity of the existing facility (which is licenced for 25,000 head). Figure 6-2. Weekly Saleyard
Throughput (Head), July 2017 to June 2020
35,000
30,000
25,000
20,000
15,000
10,000
5,000
-
Week 1
Week 3
Week 5
Week 7
Week 9
Week 11
Week 13
Week 15
Week 17
Week 19
Week 21
Week 23
Week 25
Week 27
Week 29
Week 31
Week 33
Week 35
Week 37
Week 39
Week 41
Week 43
Week 45
Week 47
Week 49
Week 51
Week 53
2017-18 2018-19 2019-20
Source: MLA (Unpublished), AEC.
The normal volume in the past three years shows that only three sale days were over 25,000 head throughput. The
current facility operates efficiently and safely at approximately 15,000 head per sale day, however, if the saleyard
were to increase its throughput by up to 20%-25% with stock from surrounding areas, the existing facility, with the
throughput already being experienced, may not be large enough in the medium term.
Currently sale days in excess of 18,000 head are congested, and sheep are held wherever they can be.
Consultation and market analysis highlights a comfortable capacity of 20,000 head is desired. This is the target of
the facilities outlined in this masterplan.
6.3 KEY ISSUES
6.3.1 Saleyards, Stock Flow and User Access
Current Situation
• Existing ramps are in good condition and suitable for existing purpose.
• The configuration of pens and lanes is adequate, minimising the potential for conflict between pedestrians and
animals.
• Auctioneers’ walkways are adequate.
• Stock are unloaded and loaded from either the north east or south west end of the facility.
• Animals are held in holding pens to the south west corner and moved to the north east corner for drafting
purposes. During selling days the sheep are put into smaller selling pens in the middle of the site.
18COROWA SALEYARDS MASTER PLAN
• The movement of animals through the site is sufficient and does not require any significant changes or
modifications.
• There is no fencing to provide security at the facility.
Issues
• Ramps are currently a crush hazard with no barricade to prevent people or animals from going underneath the
ramps when in operation.
• There are no access restrictions to the site.
• The saleyard requires expanded capacity to accommodate current and future growth in throughput.
Master Plan Solution(s)
• Long term holding of stock in purpose-built holding yards with an earth base.
• Further spelling pens located next to the new holding yards to hold stock for long periods of time allowing stock
to spread out.
• Minimise pedestrian movement around the site by providing a designated pedestrian crossing. This pedestrian
crossing will be located so that no pedestrians/ heavy vehicles conflict is likely to take place.
• Securing the facility through perimeter fencing, CCTV and gated access will support the better management
of biosecurity, animal welfare and general theft and vandalism on the site.
• Entrance to the facility via an access data fob system and gates will restrict access to official vehicles only.
6.3.2 Roofing and Lighting
Current Situation
• There is currently no roof over the saleyard.
• Animals, workers, visitors, and agents are currently exposed to the extremes of weather events.
• The lighting at the yards is adequate but not ideal.
Issues
• Lack of shading of the saleyard is detrimental to animal, worker, and visitor welfare.
• Roofing over the saleyard would reduce animal stress ensuring ensure stock offered for sale are presented in
peak condition and are able to achieve optimal prices at sale.
• Stormwater that lands on the concrete yards enters the effluent management system causing a negative
impact on the system capacity.
Master Plan Solution(s)
• Roofing would decrease the likelihood of operational interruptions.
• A roof solution would limit stormwater pooling to concrete areas and elevated walkways.
• Under roof lighting will enable agents and buyers to identify sheep quality.
• Due to the yards becoming busier, loading will need to occur earlier in the mornings, and later at night, which
may increase the requirement for further lighting.
• Additional site efficiencies achieved in roofing the complex include:
o Water capture will reduce pressure on the effluent management system and improve overall capacity
o Water capture and storage to reduce mains water consumption for wash down and truck wash purposes
o Facilitates the installation of solar panels to reduce dependency on mains electricity consumption.
19COROWA SALEYARDS MASTER PLAN
6.3.3 Traffic Movement and Parking
Current Situation
• Formal entry exists to the site and internal vehicle movement areas are generally via unmarked and unsealed
gravel surfaces.
• There is no fencing to provide security at the facility.
Issues
• There are unloading traffic issues as drivers wait to use the specific race designated for the agent that they
are delivering to.
• Crossover of heavy and light vehicle traffic and associated pedestrian movement is currently an issue
throughout the site and there are no designated parking areas for either light or heavy vehicles.
• There are no designated parking areas for either light or heavy vehicles.
Master Plan Solution(s)
• Reconfiguration of the internal road system to facilitate heavy vehicle circulation of the facility in a clockwise
manner loading in and out as needed.
• Installation of an entry gate with electronic fob access.
• Provision of sufficient truck pullover areas to allow trucks to queue or pull over for longer periods of time.
• A formalised car parking area will hold the sale day visitors as well as body-trucks or utes that need parking
places throughout normal operations.
• Formalisation of car parking and a more defined entrance would allow better and safer site movements.
• Truck parking as an option to allow the provision of trucks to park for extended periods of time.
6.3.4 Truck Wash Down Facilities
Current Situation
• The existing truck wash is in good condition however it would ideally be wider.
• The truck wash is currently only open from Sunday to Wednesday due to the issue of managing on site effluent.
Issues
• Due to upgrades to the existing service station exit, the truck wash exit path has been substantially hindered.
• The washdown facility does not have a sufficient gradient, which results in the build-up of scum on the flooring.
• The failure of users to maintain the washdown facility in an acceptable manner is a concern.
Master Plan Solution(s)
• Widening and improvement of the truck wash will allow for easier and safer exit.
• The installation of CCTV cameras would enforce drivers to maintain the truck wash effectively.
• Increasing the gradient to improve runoff.
6.3.5 Weighbridge
Current Situation
• There are currently no weighing facilities at the saleyard.
20COROWA SALEYARDS MASTER PLAN
Issues
• Drivers are unable to check loads for compliance prior to exiting the facility.
Master Plan Solution(s)
• A suitable site for a weigh bridge considered multiple locations, all of which are off to the side of the circulating
road. These locations allow easy on and off use as well as integration into the existing flow of traffic.
6.3.6 Services
Current Situation
• The Saleyard is serviced and is wholly reliant on mains supplied water, electricity, telephone, and sewer.
• The effluent from the facility is treated through an onsite system before being used to irrigate a neighbouring
farm.
Issues
• Stormwater management is an issue as the existing effluent management system is not adequately sized to
accept and handle the volume of overflow water generated.
• Additional expansion to the facility is likely to exacerbate this problem further unless mitigated by the roof
installation and water tank storage, which would allow for more efficient capture and use of stormwater on site.
• Onsite effluent treatment system insufficient in treating nutrient levels, creating an issue with irrigation and
compliance EPA licence conditions.
Master Plan Solution(s)
• Expansion of the roof and water tank storage of the effluent treatment facilities to allow more efficient capture
and use of stormwater to site and additional holding capacity of effluent runoff.
• Upgrades and improvements to the current effluent management system are required to improve treatment
and compliance with EPA licence conditions
6.3.7 Surrounding Land Use
Current Situation
• Surrounding land uses are generally described as industrial/ rural although a service station development has
been constructed and shares the current road access with the facility.
Issues
• The current irrigation on the lot is at capacity in its north to south aspect but has potential for expansion to the
west via negotiations and subsequent lease/ crossing access to the railway corridor.
• Expansion into the neighbouring lots where the aeration and storage dams are currently located is also
available.
Master Plan Solution(s)
• Crossing of the railway corridor is dependent on obtaining approvals.
• The facility may be limited in its western expansion if the corridor is not available.
• Existing neighbouring land owned by Council can be used for extra effluent treatment ponds and aeration
ponds in a similar manner to that of the existing.
21COROWA SALEYARDS MASTER PLAN
6.3.8 Other Improvements
• Current visitors to the saleyard are often unclear about the how the saleyard works, and of the history of the
saleyard. The provision of Interpretive signage/ information boards will provide information for users and
visitors.
• Improved canteen, amenities, and trip facilities for users and drivers.
• A new multipurpose learning centre with training facilities and meeting rooms.
22COROWA SALEYARDS MASTER PLAN
SITE DEVELOPMENT
7.1 PROPOSED SITE LAYOUT
To address the issues identified earlier a site concept plan has been developed outlining the potential improvements to the Saleyard which is shown at Figure 7-1. Further detail
can be seen at Appendix A and Appendix B.
Figure 7-1. Saleyard Concept Plan
23COROWA SALEYARDS MASTER PLAN
7.2 CAPITAL COSTS
The Master Plan includes an initial package of works as well as a series of optional work packages that can be
deployed as demand/ need arises as outlined in the following table.
Table 7-1. Capital Works Plan Included in Master Plan
Works Packages 2021-22 2022-23
Roof Over Yards (inc. Solar & Lighting) $5,790,378 $3,860,252
Saleyard Expansion $2,151,824 $1,434,550
Admin/ TAFE Building $1,239,850 $826,566
Effluent Management $1,077,000 $718,000
Holding Pen Expansion $448,589 $299,059
Circulating Road Reconfiguration $367,594 $245,062
Public Car Park $332,548 $221,698
Stormwater Tanks $280,368 $186,912
Holding Yard Relocation $179,903 $119,935
Expansion to Stormwater Overflow Dam $137,848 $91,898
Fencing and Gates $119,156 $79,438
Weighbridge $116,820 $77,880
Truck Wash Modification $87,226 $58,150
CCTV $70,092 $46,728
Spelling Yard Grass Area $50,622 $33,748
Demolition of Existing Yards $26,479 $17,653
Total Capital Expenditure $12,476,296 $8,317,530
Source: AEC, StruXi.
All costs are based on 2020 prices and indexed and include design contingency (10%), professional fees (8%) and construction contingency
(10%).
In addition to the above works schedule, a further $5.508 million of optional works which is shown in Table 7-2
should further expansion be required.
Table 7-2. Optional Capital Works Included in Master Plan
Capital Item $
Solar Panels to All Saleyard Roof $2,860,000
Circulation Road (To End of Lot) $1,101,000
Circulation Road (Shorter Configuration) $614,000
Saleyard Washdown System $328,000
North East Drafting Yard $268,000
Truck Parking Ground $186,000
Future Sheep Yard $112,000
Modification of Existing Ramp $39,000
Total Optional Capital Expenditure $5,508,000
Source: AEC, StruXi.
Costs do not include any contingencies
24You can also read