Consistency of Type IIP supernova sibling distances
←
→
Page content transcription
If your browser does not render page correctly, please read the page content below
A&A 672, A129 (2023)
https://doi.org/10.1051/0004-6361/202245379                                                                                                                Astronomy
c The Authors 2023                                                                                                                                          &
                                                                                                                                                           Astrophysics

                Consistency of Type IIP supernova sibling distances
          G. Csörnyei1,2 , C. Vogl1,3 , S. Taubenberger1,2 , A. Flörs4 , S. Blondin5 , M. G. Cudmani1,6,7 , A. Holas8,9 ,
                                S. Kressierer6,7 , B. Leibundgut2,6 , and W. Hillebrandt1,2,3

      1
          Max-Planck-Institute für Astrophysik, Karl-Schwarzschild-Str. 1, 85748 Garching, Germany
          e-mail: csogeza@mpa-garching.mpg.de
      2
          Physics Department, Technische Universität München, James-Franck-Str. 1, 85748 Garching, Germany
      3
          Exzellenzcluster ORIGINS, Boltzmannstr. 2, 85748 Garching, Germany
      4
          GSI Helmholtzzentrum für Schwerionenforschung, Planckstraße 1, 64291 Darmstadt, Germany
      5
          Aix-Marseille Univ, CNRS, CNES, LAM, 13388 Marseille, France
      6
          European Southern Observatory, Karl-Schwarzschild-Str. 2, 85748 Garching, Germany
      7
          School of Natural Sciences, Technische Universität München, James-Franck-Str. 1., 85748 Garching, Germany
      8
          Zentrum für Astronomie der Universität Heidelberg, Institut für Theoretische Astrophysik, Philosophenweg 12, 69120 Heidelberg,
          Germany
      9
          Heidelberg Institute for Theoretical Studies, Schloss-Wolfsbrunnenweg 35, 69118 Heidelberg, Germany
      Received 4 November 2022 / Accepted 3 February 2023

                                                                                      ABSTRACT

      Context. Type II supernovae offer a direct way of estimating distances via the expanding photosphere method, which is independent
      of the cosmic distance ladder. A Gaussian process-based method was recently introduced, allowing for a fast and precise modelling
      of spectral time series and placing accurate and computationally cheap Type II-based absolute distance determinations within reach.
      Aims. The goal of this work is to assess the internal consistency of this new modelling technique coupled with the distance estimation
      in an empirical way, using the spectral time series of supernova siblings, that is, supernovae that exploded in the same host galaxy.
      Methods. We used a recently developed spectral emulator code, trained on Tardis radiative transfer models that is capable of a fast
      maximum-likelihood parameter estimation and spectral fitting. After calculating the relevant physical parameters of supernovae, we
      applied the expanding photosphere method to estimate their distances. Finally, we tested the consistency of the obtained values by
      applying the formalism of Bayes factors.
      Results. The distances to four different host galaxies were estimated based on two supernovae in each. The distance estimates are not
      only consistent within the errors for each of the supernova sibling pairs, but in the case of two hosts, they are precise to better than
      5%. The analysis also showed that the main limiting factor of this estimation is the number and quality of spectra available for the
      individual objects, rather than the physical differences of the siblings.
      Conclusions. Even though the literature data we used was not tailored to the requirements of our analysis, the agreement of the final
      estimates shows that the method is robust and is capable of inferring both precise and consistent distances. By using high-quality
      spectral time series, this method can provide precise distance estimates independent of the distance ladder, which are of high value
      for cosmology.
      Key words. radiative transfer – stars: distances – supernovae: general

1. Introduction                                                                                   contrast, here we perform the first dedicated distance consistency
                                                                                                  check for Type IIP supernova siblings.
Sibling supernovae are transients that exploded in the same                                           Type II supernovae (SNe II) correspond to the final gravita-
host galaxy. As they are located at essentially the same dis-                                     tional collapse of massive (≥8 M ), red or blue supergiant stars,
tance from us, they allow us to test distance estimation meth-                                    which is supported by pre-explosion images (Smartt 2009) and
ods and investigate their systematics empirically. Such consis-                                   theoretical models (Tinyanont et al. 2022). These supernovae are
tency checks were recently carried out in the literature for pairs                                historically subdivided into two main classes, Type IIP (plateau)
of Type Ia supernovae (see e.g. Burns et al. 2020; Scolnic et al.                                 and Type IIL (linear), based on their light curves (e.g. Patat et al.
2020) as well as for a pair of a Type Ia and a Type IIP super-                                    1994). However, there are several indications that these objects
nova (Graham et al. 2022), yielding good matches. However, no                                     can be rather explained as a continuous distribution, as opposed
similar tests have yet been conducted on Type II supernovae                                       to distinct classes (Anderson et al. 2014; Sanders et al. 2015;
specifically.                                                                                     Galbany et al. 2016; Morozova et al. 2017; Pessi et al. 2019).
    In the past, Type II supernova siblings have been analysed                                        Due to their high intrinsic luminosity and the fact that these
with different goals. For example, Poznanski et al. (2009) used                                   supernovae are the most frequent stellar explosions in the Uni-
such siblings to check the colour term in their standardizable                                    verse (Li et al. 2011), Type II SNe make for excellent distance
candle model under the assumption that they share the same dis-                                   indicators. To date, mainly two methods have been used to
tance. More recently, Vinkó et al. (2012) and Szalai et al. (2019)                                estimate the distances to Type II SNe: the expanding photo-
used a Type IIP-IIb and a IIP-IIP pair respectively to constrain                                  sphere method (EPM, Kirshner & Kwan 1974), which is a geo-
the distances to their hosts better than with a single transient. In                              metric technique relating the photospheric radius of the SN to

                                                                                                                                                                          A129, page 1 of 18
                 Open Access article, published by EDP Sciences, under the terms of the Creative Commons Attribution License (https://creativecommons.org/licenses/by/4.0),
                                  which permits unrestricted use, distribution, and reproduction in any medium, provided the original work is properly cited.
                             This article is published in open access under the Subscribe to Open model. Open access funding provided by Max Planck Society.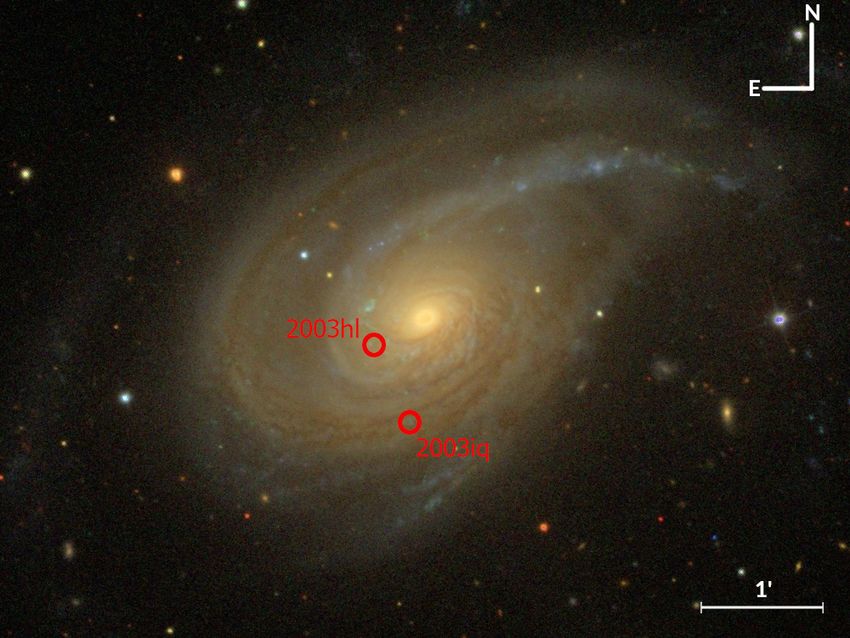
Csörnyei, G., et al.: A&A 672, A129 (2023)

its angular size, and the standardised candle method (SCM,             2. Data
Hamuy & Pinto 2002), which is based on an empirical relation
between the photospheric expansion velocity and the plateau            To obtain a set of objects compatible with the goals of this study,
luminosity of the supernovae. However, only the EPM provides           we filtered the catalogue of known supernovae through the Open
a distance estimation that does not require any external calibra-      Supernova Catalog1 (OSC, Guillochon et al. 2017). In addition
tion, as opposed to the SCM and other distance ladder formalism        to looking for supernovae that exploded in the same host, we set
methods. It is independent of any other distance measurements          further constraints on the individual objects to make sure that
and hence of the cosmic distance ladder. Owing to these advan-         our method could be applied to them: the objects should have
tages, it has already been applied to various sets of SNe to derive    at least one observation in their early photospheric phase (more
the Hubble constant (see e.g. Schmidt et al. 1992). The clas-          precisely, in the epoch range of 10 to 35 days with respect to
sical EPM analysis is, however, prone to several uncertainties         the time of explosion; see Sect. 3.2) to be compatible with our
as, for example, shown by Jones et al. (2009): the results can         radiative-transfer modelling, a well-covered light curve during
be subject to systematic differences depending on which atmo-          these epochs (optimally, in multiple bands for calibration pur-
spheric model – and thus, which dilution factors are assumed           poses; see Sect. 3.1), and a well-constrained time of explosion
(e.g. Eastman et al. 1996 or Dessart & Hillier 2005a) – or which       from either non-detections or from fitting of the rise of the light
photometric passband set is used for the photometry. To avoid          curve.
such issues, as pointed out by Dessart & Hillier (2005a), it is            By filtering the catalogue, we found that SN IIP pairs in four
necessary to carry out the EPM based on the radiative transfer-        host galaxies met all the conditions that we described above:
based modelling of the spectra and estimate the input param-           NGC 772, NGC 922, NGC 4303 (M 61), and NGC 6946 (Fig. 1).
eters through these models. We call this augmented version             To retrieve the data for the supernovae in these hosts, we made
the tailored-EPM analysis, which bears more similarities to the        use of the OSC and WISeREP2 (Yaron & Gal-Yam 2012). The
Spectral-fitting Expanding Atmosphere Method (SEAM) intro-             properties of the final dataset are summarised in Table 1.
duced by Baron et al. (2004). This step not only allows for a
more precise estimation of physical parameters but also avoids         3. Methods
the detour of choosing the dilution factors for the EPM.
     Although the number of available spectroscopic observa-           3.1. EPM and spectral modelling inputs
tions has grown significantly over the past years, the spectral        Before we could fit the spectral time series and perform the EPM
modelling remains a time-consuming and laborious process. To           analysis, we needed to obtain the necessary input data: an esti-
change this situation, Vogl et al. (2020) developed an emulator        mate of the time of explosion, t0 , photometry interpolated to the
based on spectra calculated with the Tardis radiative transfer         spectral epochs, and flux-calibrated spectra. We describe how
code (Kerzendorf & Sim 2014), which allows for a maximum               we inferred t0 from a parametric fit in Sect. 3.1.1. Section 3.1.2
likelihood parameter estimation and modelling of the spectral          explains the Gaussian process (GP) interpolation of the light
time series several orders of magnitude faster than the conven-        curves, and Sect. 3.1.3 details how we used the interpolated mag-
tional methods. To showcase the code, Vogl et al. (2020) per-          nitudes to recalibrate the spectra.
formed the tailored-EPM analysis for SNe 1999em and 2005cs,
showing that a few per cent precision in the derived distance can
be achieved.                                                           3.1.1. Time of explosion
     Here, we attempt to further test the method and investigate its
                                                                       The time of explosion is a crucial parameter in the EPM. It sets
internal consistency empirically by applying it to sibling super-
                                                                       the size of the photosphere and, thus, the model luminosity. Any
novae. In their case, the maximum possible separation between
                                                                       error in t0 causes an error in the distance. In cases where the
the siblings is set by the line-of-sight extension of the thick disk
                                                                       distance to a supernova is estimated using a single epoch, the
of their host galaxies. For face-on galaxies (such as all the hosts
                                                                       uncertainty in the time of the explosion, t0 , translates directly
in our sample), this is at most about 10 kpc (Gilmore & Reid
                                                                       into the distance uncertainty:
1983). At a distance of ∼6 Mpc, for the closest host galaxy in
our sample, this corresponds only to a maximum relative error
                                                                               s
                                                                                          !2          !2
of 0.2%. Hence, the EPM should yield the same distance for             ∆D           ∆t0        ∆(Θ/v)
                                                                            ≈                +           ,                            (1)
the sibling pairs within the uncertainties. As a result, siblings       D          t − t0       Θ/v
provide a simple empirical way to assess the consistency and
                                                                       based on linear relative error propagation, in accordance with the
robustness of the algorithm: they allow us to test whether we
                                                                       equations shown in Sect. 3.3. The parameters with the ∆ denote
find the same distances for the pairs even though the underlying
                                                                       the uncertainty of the given values. Assuming a 10% error on the
conditions vary (such as the metallicity, the mass of the progen-
                                                                       Θ/v measurement for a single spectrum at the epoch of 20 days,
itor, the amount of ejecta-CSM interaction, the reddening, etc.),
                                                                       a t0 uncertainty of ±2 days would yield ∼14% error on the final
as well as the overall data quality and the level of calibration.
                                                                       distance, which is too large for our purposes.
Such distance comparisons also allow us to assess whether the
                                                                           Analyzing multiple spectral epochs helps in limiting the final
inferred uncertainties are reasonable.
                                                                       uncertainties of the fit parameters, partially owing to the addi-
     The paper is structured as follows. In Sect. 2, we give a brief
                                                                       tional constraining effect exerted on t0 by the EPM regression.
overview of the data collected for this study. Section 3 describes
                                                                       For example, having four high-quality observations in the epoch
the calibration steps we applied to the data to achieve a similar
                                                                       range of 10 to 25 days, along with the above t0 uncertainty
level of calibration for all objects, then provides the background
                                                                       of 2 days, would yield an EPM distance error of about ∼11%.
of the emulator-based modelling and gives an outline of the dis-
                                                                       While the improvement in precision is significant compared to
tance estimation. Section 4 shows the results of the modelling for
                                                                       the above case, bringing it to the required levels would require a
the individual host galaxies, while Sect. 5 discusses these results
and details the consistency check of the method. In Sect. 6 we         1
                                                                           https://sne.space/
present our summary and conclusions.                                   2
                                                                           https://www.wiserep.org/

A129, page 2 of 18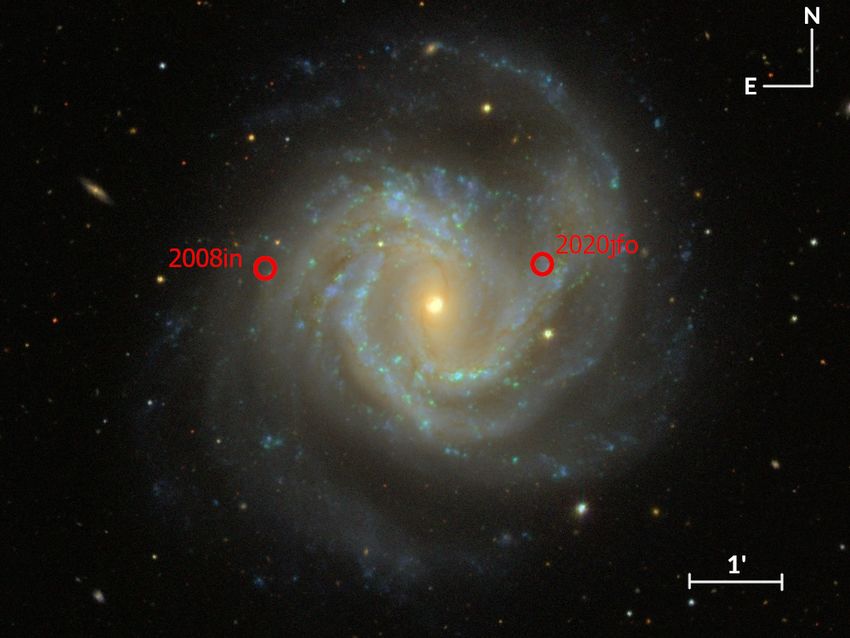
Csörnyei, G., et al.: A&A 672, A129 (2023)
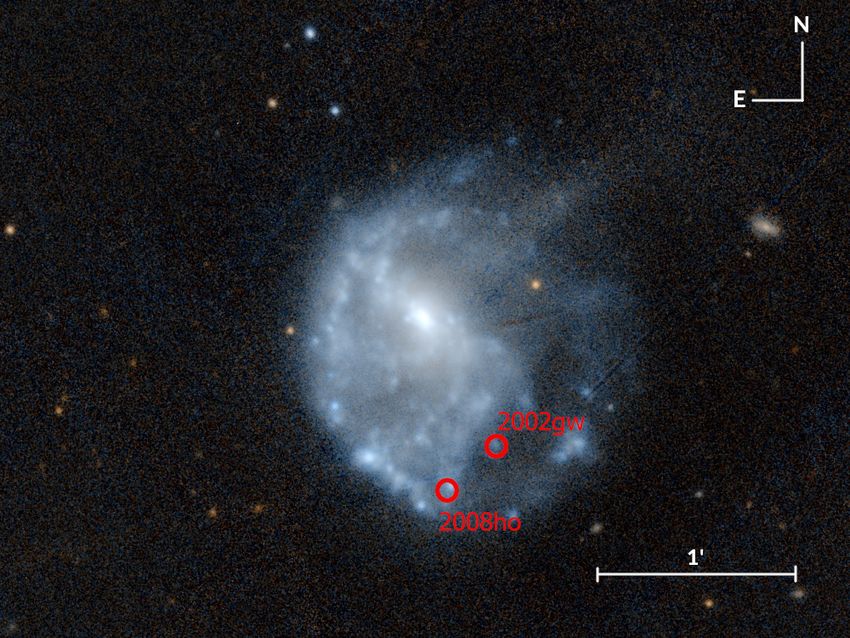
Fig. 1. Images of the sample host galaxies. Top left: SDSS DR9 (https://www.sdss3.org/index.php) image of M61, along with the positions
of SN 2008in and 2020jfo. Top right: SDSS DR9 image of NGC 772, along with the positions of 2003iq and 2003hl. Bottom left: PanSTARRS
DR1 (https://archive.eso.org/dss/dss) image of NGC 922, along with the positions of 2002gw and 2008ho. Bottom right: DSS (https:
//outerspace.stsci.edu/display/PANSTARRS/) image of NGC 6946, along with the positions of 2004et and 2017eaw.
Table 1. Summary table of the compiled SN sample, along with important properties of the host, namely, its heliocentric redshift (as adopted from
the OSC) and reddening caused by the dust in the Milky Way (Schlafly & Finkbeiner 2011).
Host zhelio E(B − V)MW SN Nspec Nphot (bands) References
M61 0.00522 0.0193 2008in 6 22 (BVRI) Nakano et al. (2008), de Jaeger et al. (2019)
2020jfo 7 21 (gri) Schulze et al. (2020), Sollerman et al. (2021)
NGC 772 0.00825 0.0623 2003hl 1 36 (BVRI) Moore et al. (2003), Faran et al. (2014)
2003iq 4 44 (BVRI) Llapasset et al. (2003), Faran et al. (2014)
NGC 922 0.01028 0.0163 2002gw 3 34 (BVI) Monard (2002), Galbany et al. (2016)
2008ho 2 11 (BV) Pignata et al. (2008); Anderson et al. (in prep.)
NGC 6946 0.00013 0.2967 2004et 6 40 (BVRI) Zwitter et al. (2004), Faran et al. (2014)
2017eaw 8 96 (BVRI) Wiggins (2017), Szalai et al. (2019)
Notes. References are provided for the discovery and photometry of the objects; for details on the spectroscopy, see Sect. 4.
factor of a few more spectral epochs, which is rarely available. explosion is known to a high level of precision (to an uncertainty
This demonstrates that even with a sufficiently large number of of less than a day ideally) and independently of the EPM analy-
observations, it is crucial to obtain a well-constrained prior esti- sis, even a single spectral epoch is enough to obtain a meaningful
mate on t0 for the distance determination. distance. Observationally, the common approach for estimating
We can use the constraints on t0 from the early light curve the time of explosion has been to take the midpoint between the
to significantly reduce these uncertainties. Also, if the time of first detection and last non-detection (e.g. Gutiérrez et al. 2017).
A129, page 3 of 18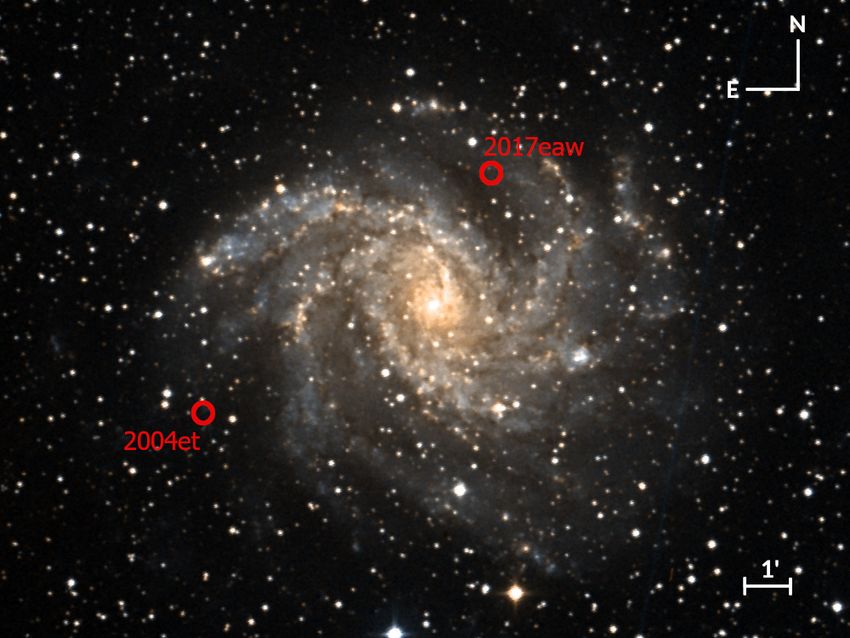
Csörnyei, G., et al.: A&A 672, A129 (2023)

This is not accurate enough for our analysis. The method                  curves by providing a non-parametric way of fitting, while tak-
does not take into account the depth of the non-detections in             ing into account the uncertainties of the datapoints. Follow-
comparison to the first detection; this can bias the estimated            ing several works that already used GPs for the modelling
time of explosion and, thus, the distance. Also, the approach             of supernova light curves (Inserra et al. 2018; Yao et al. 2020;
neglects the information from data on the rise of the light               Kangas et al. 2022), we adopted covariance functions from
curve.                                                                    the Matérn family for our calculations (Rasmussen & Williams
     To minimise these possible biases and improve the preci-             2006). We chose a smoothness parameter of 3/2 for our anal-
sion, we estimated the time of explosion for each SN through              ysis. We attempted to keep the length scale of the best-fit GP
the fitting of their early light curves (the initial plateau, i.e. the    curve high enough to retain its robustness against the scatter
first 10−40 days, depending on the individual SNe). Following             present in the datapoints. To achieve this, we omitted the rise
Ofek et al. (2014) and Rubin et al. (2016), we fit the flux f in          of the light curve and the drop from the plateau from the fits.
band W with the following:                                                Figure C.1 shows the interpolated light curves and Table C.1
               "                  !#                                      lists the magnitudes at the spectral epochs. The interpolated
                           t − t0
 fW (t) = fm,W 1 − exp −             ,                             (2)    magnitudes are direct inputs for the EPM, as described in
                            te,W                                          Sect. 3.3.
where t is the time, t0 is the time of explosion, fm,w is the
peak flux, and te,W is the characteristic rise time in the partic-        3.1.3. Flux-calibrated spectra
ular band. Whenever the data allowed, we carried out this fit-
ting for multiple photometric bands simultaneously to increase            A reliable flux calibration is crucial for the spectral mod-
the accuracy of the method. In this joint fit, each of the differ-        elling and the determination of the host extinction. We there-
ent bands had its own fm,W and te,W values, but the fits were             fore applied a linear flux correction to avoid possible biases
connected through the global t0 value, which was the same                 in the analysis. This correction was based on the photome-
for all bands. To improve the fitting, we introduced two addi-            try: for every epoch, we calculated a set of synthetic mag-
tional constraints: (i) we took the depth of the non-detections           nitudes using the transmission curves from Bessell & Murphy
into account by placing a constraint stating that the model               (2012, for BVRI magnitudes) or Dekany et al. (2020, in case
flux should not exceed the limiting flux (but the light curves            of ZTF photometry), and we then compared these values
were allowed to extend to times before the non-detection), and            to the corresponding interpolated magnitudes. The correction
(ii) we required that the characteristic time scale, te , for the         curve was then calculated by fitting the linear trend present
light curve rise increases with wavelength for a given super-             in the ratios of synthetic and interpolated fluxes against the
nova, as it was found previously (see, e.g. González-Gaitán et al.        effective wavelengths of the passbands. Finally, the spectra
2015). In this way, even the te values, which otherwise corre-            were multiplied with the obtained correction trends. In some
spond to their own band, were constrained globally in the joint           cases, additional more complex flux calibration steps were
fit.                                                                      required and these are described separately for each individual
     To fit the model to the set of light curves in different             supernovae.
bands simultaneously, we applied the UltraNest3 package
(Buchner 2021), which allows for Bayesian inference on com-               3.2. Spectral modelling
plex, arbitrarily defined likelihoods and derives the necessary
posterior probability distributions based on the nested sampling          To fit the individual spectra, we applied the methodology intro-
Monte Carlo algorithm MLFriends (Buchner 2016, 2019). We                  duced by Vogl et al. (2020). The fitting method is based on a
assumed a flat prior for each of the input parameters and used            spectral emulator that predicts synthetic spectra for a set of
a Gaussian likelihood for the parameter inference. To account             supernova parameters. The training set of synthetic spectra was
for a possible underestimation of the photometric errors, which           calculated with a modified version of the Monte Carlo radia-
can influence the inferred parameters, we extended the likeli-            tive transfer code Tardis (Kerzendorf & Sim 2014; Vogl et al.
hood with an additional term corresponding to the error infla-            2019), which is described in detail in Vogl et al. (2020). To
tion as described in Hogg et al. (2010). Using this procedure,            allow for a fast and reliable interpolation of model spectra for
we obtained a t0 posterior distribution for each supernova. We            a given set of physical parameters, along with correct abso-
then used the maximum of this distribution as our single “best            lute magnitudes, an emulator was built on this training set with
estimate” value for t0 to set the phase of the spectral observa-          the following procedure. First, the dimensionality of the spectra
tions for the fitting. The full distribution is used as a prior for the   was greatly reduced by the use of principal component analysis
EPM analysis, as described in Sect. 3.3. This unique approach             (PCA) then GPs were trained on the physical input parameters
for obtaining t0 in parallel to the EPM significantly enhances            (photospheric temperature and velocity, T ph and vph , metallicity
the precision of the distance measurements, as will be shown in           Z, time since explosion texp , and the exponent of the density pro-
Sect. 4.                                                                  file n = −d ln ρ/d ln r) to interpolate spectra and to predict abso-
                                                                          lute magnitudes. As described in Vogl et al. (2020), the emulator
                                                                          predicts spectra that in almost all cases match the simulations
3.1.2. Interpolated photometry                                            with a precision of better than 99%, as measured by the mean
The epochs of spectral observations are not necessarily cov-              fractional error. The original version of the emulator covered the
ered by individual photometric datapoints. To obtain photom-              early photospheric phase, from 6.5 to 22.5 days after the explo-
etry at all phases, we fit the light curves using GPs by apply-           sion (Vogl et al. 2020). This was extended towards later epochs
ing the george4 python package (Ambikasaran et al. 2015).                 up until 38 days, and additional high-temperature models with an
In brief, GPs present a useful way to interpolate the light               NLTE (non-local thermal equilibrium) treatment of He were also
                                                                          added (Vogl 2020, and in prep.; Vasylyev et al. 2022). The 38-
3
    https://johannesbuchner.github.io/UltraNest/                          day upper end is set by the modelling limitations, since after this
4
    https://george.readthedocs.io/en/latest/                              epoch, time-dependent effects in the excitation and ionization

A129, page 4 of 18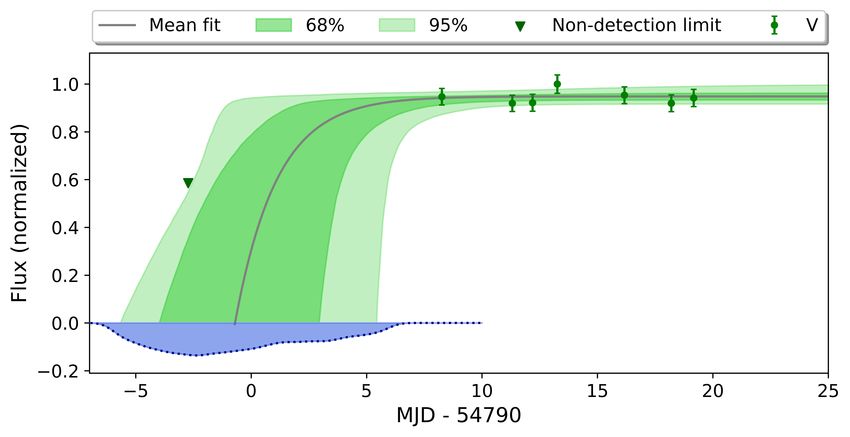
Csörnyei, G., et al.: A&A 672, A129 (2023)

Table 2. Parameter range covered by the extended spectral emulator.                  E(B V)Gal.
                                                                                    4
                                                                                                                                                         Example Kernel
             vph [km s−1 ]   T ph [K]   Z [Z ]    texp [days]   n    NLTE                                                                                Silverman Kernel
                                                                                    3                                                                    2017eaw best fit values
                             texp < 16 days                          H   He                                                                              KDE distribution
      Min        4500          7200       0.1         6.0        9   3   3
      Max       12000         16 000      3.0        16.0       26
                             texp > 16 days                          H   He
                                                                                    2
      Min        3600         5800        0.1         6.5        6   3   7
      Max       10700        10 000       3.0        40.0       16
                                                                                    1
Notes. Depending on the spectral epoch, one of these two simulation
sets was chosen for building the emulator.
                                                                                    0
                                              5                                         0.30 0.31 0.32 0.33 0.34 0.35 0.36 0.37 0.38 0.39 0.40 0.41 0.42 0.43 0.44 0.45 0.46 0.47 0.48
balance tend to become important . The physical range covered                                                                 E(B V) [mag]
by the emulator is summarised in Table 2.
    To infer the physical parameters, we used a Gaussian likeli-                    Fig. 2. Distribution of best-fitting reddening estimates for all the
hood:                                                                               epochs of SN 2017eaw (blue bars) and the constructed KDE distri-
                                                                                    bution (background shape). Dashed grey line at E(B − V) = 0.3
                                                                                    mag denotes the Galactic reddening towards NGC 6946 based on the
                                1                                                   Schlafly & Finkbeiner (2011) dust map, which sets the lower limit for
ln p( fλobs |θSN , E(B − V)) = − (RTC −1 R + ln detC + N ln 2π), (3)
                                2                                                   the KDE. The green and grey curves show the Gaussian kernels for a
where,                                                                              single observation obtained by our setting and Silverman’s rule, respec-
                                                                                    tively. A normalisation procedure was applied to the KDE histogram
R = fλobs − fλ (θSN , E(B − V)),                                              (4)   to obtain a better comparison. For more details on this supernova, see
                                                                                    Sect. 4.4.
where θSN = (vph , T ph , Z, texp , n) denotes the set of physical
parameters, fλobs and fλ denote the observed and the reddened
emulated spectra, respectively, N is the number of spectral bins                    3.3. Distance determination
and C is the bin-to-bin covariance matrix (see e.g. Czekala et al.
2015). The matrix C is important for the inference. It should                       To infer the distances, D, for the supernovae, we used a variant of
account for uncertainties in the data and the model, and cap-                       the tailored-EPM method (Dessart & Hillier 2006; Dessart et al.
ture the correlations of these uncertainties across wavelength;                     2008; Vogl et al. 2020). As a first step, the photospheric angular
otherwise, we would significantly underestimate the parameter                       diameter of the supernova (Θ = Rph /D, where Rph denotes the
uncertainties (see, Czekala et al. 2015). Constructing a matrix                     radius of the photosphere) had to be inferred for each of the spec-
with these properties is a challenging, unsolved problem.                           tral epochs. The predicted apparent magnitude for a passband S
     We thus used a simple diagonal matrix with constant values                     depends on Θ as follows:
as in Vogl et al. (2020). Since we cannot infer reasonable uncer-                                  ph
                                                                                    mS = MS (Σ∗ ) − 5 log(Θ) + AS
tainties under these circumstances, we performed only maxi-
mum likelihood estimation for the parameters. Throughout the                         ph               Rph                                                                            (5)
                                                                                    MS = MS + 5 log       .
fitting, the t epoch of each spectrum was fixed. We treated the                                      10pc
reddening towards the supernova separately from the other phys-
ical parameters: instead of directly including it in the likelihood                 Here, Σ∗ denotes the set of physical parameters corresponding
                                                                                                       ph
function, we set up a grid of reddened spectra corresponding to                     to the best fit, MS is the absolute magnitude predicted by the
various E(B − V) values and then evaluated the likelihood for                       radiative transfer model at the position of the photosphere, and
each separately. Apart from reducing computational time, this                       AS denotes the broadband dust extinction in the bandpass; MS
allowed us to quantify the uncertainties caused by the redden-                      denotes the absolute magnitude as defined by the distance mod-
ing using the treatment described below. We applied the red-                        ulus formula. The absolute magnitudes are transformed with
dening correction according to the Cardelli et al. (1989) law                       above formula so that the variations in the size will have no
with RV = 3.1. For the lower limit of the E(B − V) grid, we                         effect. With this definition, we determined the best-fitting angu-
always assumed the Galactic colour excess towards the super-                        lar diameter Θ∗ by minimising the square difference between the
nova, which was determined based on the Schlafly & Finkbeiner                       observed mobs
                                                                                                S and model magnitudes:
(2011) dust maps. The best-fit E(B − V) was chosen as the aver-
age of the E(B − V) values that resulted in the lowest χ2 for the
                                                                                                   X             2
                                                                                    Θ∗ = arg min        mS − mobs
                                                                                                               S     .                             (6)
individual spectra.                                                                                 Θ
                                                                                                           S
     Apart from calculating the best-fit physical parameters, we
also evaluated the angular diameter values for every E(B − V)                           Finally, assuming homologous expansion Rph = vph t (which
gridpoint to allow for the distance uncertainties resulting from                    is well motivated by observations and models for normal SNe
the unknown amount of host reddening to be quantified, as                           IIP; see e.g. Woosley 1988; Dessart & Hillier 2005b), we deter-
described in the next section.                                                      mined the distance to the supernova and its time of explosion
5                                                                                   through a Bayesian linear fit to the ratios of the angular diameters
   The choice of 38 days is arbitrary to a certain degree and arguments
can be made for lower and higher values for the cutoff: time-dependent
                                                                                    and the photospheric velocities (Θ/vph ) against time, t. In the fit,
effects already play a minor role at earlier epochs, while single snap-             we assumed Gaussian uncertainties for Θ/vph of 10% of the mea-
shot models are probably still accurate enough for slightly later epochs.           sured values for a given colour excess, as in Dessart & Hillier
Modelling such late epochs is more complex and time intensive, hence-               (2006), Dessart et al. (2008), Vogl et al. (2020). We used a flat
forth the emulator is limited to earlier times, where models can be cal-            prior for the distance, whereas for the time of explosion, we used
culated in single snapshot simulations.                                             a normalised histogram of the t0 posterior from the early light
                                                                                                                                                              A129, page 5 of 18
Csörnyei, G., et al.: A&A 672, A129 (2023)
Mean fit 95% Non-detection limit 1.4 g r
Mean fit 68% 95% Non-detection limit V 68%
1.0 1.50
0.8 1.25
Flux (normalized)
Flux (normalized)
0.6 1.00
0.4 0.75
0.2 0.50
0.25
0.0
0.00
0.2
0 5 10 15 20 5 0 5 10 15 20 25
MJD - 54823.95 MJD - 58975
Fig. 3. Exponential fit on the ROTSE light curve of SN 2008in (left) and the ZTF early light curves of SN 2020jfo (right). The blue shaded areas
shows the obtained t0 posteriors. The black curves show the mean fit, namely, the fit that results by taking the mean of the posterior distributions.
In case of SN 2020jfo, the g-band light curve was further rescaled after the normalization to improve clarity on the figure. The shaded regions
denote the 68% and 95% confidence intervals.
curve fit as the prior. However, instead of applying the standard UltraNest: at each step, the sampler drew an assumed dis-
χ2 -based likelihood, we used a different approach to account for tance and time of explosion value, for which the model (Θ/vph )∗
the correlated errors caused by the reddening. were calculated and then the log probability density function was
This is important since the reddening can affect the final evaluated. As a result, we obtained a posterior distribution for
EPM distance, as E(B − V) influences the Θ measurements the distance that includes the correlated error introduced by the
through the de-reddening of the observed magnitudes and uncertainty in the reddening.
changes in the best-fit parameters, such as the photospheric tem-
perature. Hence, the uncertainty of the reddening introduces a
correlated error to the final Θ/vph measurements, which transi- 4. Results
tions over to the distance obtained from the EPM fit. Depending
on the exact model, higher extinction usually leads to shorter In this section, we present the distances obtained for the individ-
inferred distances. To take this into account, we extended the ual host galaxies based on their two sibling supernovae.
likelihood with the uncertainty of the reddening by applying ker-
nel density estimation. 4.1. M61
Kernel density estimation (KDE) is an effective tool for
approximating the underlying probability density distribution The spiral galaxy M61 (NGC 4303, Fig. 1) hosted two Type II
of an observable using only a number of realizations. We use supernovae, SN 2008in and 2020jfo. This pair of transients has
the scipy KDE implementation assuming Gaussian kernels not been investigated together in the literature yet, since the sec-
(Virtanen et al. 2020) to estimate an underlying distribution for ond supernova occurred only recently.
the reddening values obtained from the individual spectral fits. The first supernova, SN 2008in was discovered on JD
The distributions calculated by KDE depend on the bandwidth 2454827.29 by Nakano et al. (2008). As M61 was monitored
of the individual Gaussian kernels. We set the bandwidth to a by the Robotic Optical Transient Search Experiment (ROTSE)
constant value of 0.025. This choice was based on empirical starting from the week before the discovery (Roy et al. 2011),
comparison with Silverman’s rule (Silverman 1986), which is the fitting of the early light curve allowed for the estimation of
regularly used for KDE: for multiple epochs, the bandwidth esti- the time of explosion independent of the EPM, from which we
mate obtained using Silverman’s rule is in agreement with our obtained t0 = JD 2454824.51+0.19−0.14 (Fig. 3). This supernova was
preset value, thus, the resulting distributions match in the two found to belong to the peculiar, subluminous group of SNe IIP
cases. However, Silverman’s rule cannot be used for a single (Roy et al. 2011). The spectral sequence for our analysis con-
epoch or when a sole value of E(B − V) is favoured by all fits; in sisted of spectra obtained by Roy et al. (2011) complemented
these cases, our bandwidth choice still provided a realistic KDE. with more recently published spectra from Hicken et al. (2017).
Finally, we set the lower limit of the estimated distribution to the SN 2020jfo was discovered on JD 2458975.70 by the Zwicky
Galactic reddening based on the Schlafly & Finkbeiner (2011) Transient Facility (ZTF, Schulze et al. 2020). Owing to the rela-
map, to exclude non-physical cases. One of the obtained KDE tively short cadence of observations of ZTF (Bellm et al. 2019),
distributions can be seen in Fig. 2. the time of explosion, t0 , is not only constrained by a non-
To incorporate the correlated uncertainty in the fit, we first detection 4 days pre-discovery, but the supernova was discov-
drew a large number of reddening samples using the obtained ered on the rise; hence, it was possible to estimate t0 precisely
KDE. Then, a respective sample of Θ/vph values was gener- by the fitting of the early light curve (Fig. 3). We obtained a
ated based on the Θ/vph − E(B − V) linear interpolation and time of explosion of t0 = JD2458975.37+0.10 −0.10 . The spectral time
by adding a random offset to each value assuming 10% uncer- series of this object was presented by Sollerman et al. (2021) and
tainty. This sample not only contained the Θ/vph values for the Teja et al. (2022). For our study, we used seven early time spec-
relevant reddening values only, but it also carried information tra (t < 20 days).
about the correlated errors present in them. To represent these The spectral time series and the emulator fits are shown in
distributions and set up the final EPM regression, we applied a Fig. 4. For the calculation of the best-fitting models the telluric
multi-dimensional Gaussian KDE on the set of Θ/vph values and regions (as marked on the figure) were masked. After fitting,
then used the corresponding probability density function as the we performed the EPM analysis on both supernovae (Fig. 5).
likelihood for the fitting. We then evaluated this likelihood using The light curve fits used for the flux calibration of the spectra
A129, page 6 of 18Csörnyei, G., et al.: A&A 672, A129 (2023)
SN 2008in SN 2020jfo Observed
1 Emulator fit
7.6 d
0 7.1 d
8.5 d
1 9.5 d 9.4 d
F (normalized)
2 11.4 d
14.0 d
12.0 d
3
16.3 d
14.0 d
4
15.0 d
5
29.3 d
19.4 d
6
4000 5000 6000 7000 8000 9000 4000 5000 6000 7000 8000 9000
[Å] [Å]
Fig. 4. Spectral time series of SNe 2008in (Roy et al. 2011; Hicken et al. 2017) and 2020jfo (Sollerman et al. 2021), along with our fits. The
grey-shaded areas denote telluric regions.
Mean fit SN 2008in
SN 2008in was conducted previously by Bose & Kumar (2014),
2.0 68%
2008in D = 15.06 ± 0.71 Mpc
yielding a distance of D = 14.51 ± 1.38 Mpc, which is consis-
2020jfo t0 = 0.14 ± 0.15 day tent with our current estimate. No prior distance measurements
/vph [d/Mpc]
1.5
of SN 2020jfo had been carried out. Although the calibration
1.0 quality varied significantly from epoch to epoch (since multiple
0.5 instruments were used for both spectral sequences), the obtained
distances are consistent within the uncertainties and agree within
0.0 1%.
Mean fit SN 2020jfo
2.0 68%
2020jfo D = 14.95 ± 0.78 Mpc
2008in t0 = -0.12 ± 0.34 day
4.2. NGC 772
/vph [d/Mpc]
1.5
1.0
The spiral galaxy NGC 772 (Fig. 1) is unique in the sense that
0.5 it not only had been host to two Type II supernovae, but both
0.0
objects were also observable simultaneously, as they exploded
0 5 10 15 20 25 30 35 within one and a half months of one another. Both supernovae
t t0 [d]
were followed up by the Carnegie Type II Supernova Program
Fig. 5. Evolution of Θ/vph for SNe 2008in (top panel) and 2020jfo (bot- (CATS) and their spectral sequences were previously analysed
tom panel). The derived distance, D, and the final time of explosion esti- by Jones et al. (2009).
mate (with respect to the initial light curve fit-based value), ∆t0 , are dis- The first supernova, SN 2003hl, was discovered on JD
played in the top left corner of each panel. The shaded region shows the 2452872.0 by Moore et al. (2003). By applying the method
68% confidence interval of the fit. The displayed uncertainties denote
described in Sect. 3.1 on the early light curve, along with
the 1σ errors on Θ/vph .
the unfiltered pre-discovery KAIT (Katzman Automatic Imag-
ing Telescope, Filippenko et al. 2001) non-detection on JD
2452863.0, we estimated the time of explosion to be JD
are displayed in Appendix C, while the best-fit parameters are 2452864.62+1.18
−1.15 (Fig. 6). We assigned the KAIT non-detection
listed in Table B.1. The estimated distances to the supernovae are to the V-band, given that the colour of the supernova is close
D = 15.06 ± 0.71 Mpc and D = 14.95 ± 0.78 Mpc for SN 2008in to zero owing to the combined effect of the very blue spec-
and SN 2020jfo, respectively. The classical EPM analysis of tral energy distribution in such early phases and the reddening,
A129, page 7 of 18Csörnyei, G., et al.: A&A 672, A129 (2023)
Mean fit 95% V R I Mean fit 95% V R I
68% Non-detection limit 68% Non-detection limit
1.0
1.0
0.8
0.8
Flux (normalized)
Flux (normalized)
0.6 0.6
0.4 0.4
0.2 0.2
0.0
0.0
0.2
5 0 5 10 15 20 25 30 35 40 5 0 5 10 15 20 25 30
MJD - 52865 MJD - 52920
Fig. 6. Early light curve fits of SN 2003hl (left) and SN 2003iq (right), along with the determined time of explosion posteriors (blue shaded
regions).
SN 2003hl SN 2003iq Observed
1 Emulator fit
9.0 d
0 15.3 d
16.2 d
F (normalized)
1
20.8 d
2
29.0 d
3
4000 5000 6000 7000 8000 9000 4000 5000 6000 7000 8000 9000
[Å] [Å]
Fig. 7. Spectral time series of SNe 2003hl and 2003iq, along with their fits. The grey-shaded areas denote telluric regions.
which places the effective wavelength close to the V-band even Llapasset et al. (2003) shortly before the first detection, which
for a red-sensitive CCD. Only one spectrum was obtained for already constrained the explosion date of SN 2003iq to a range
this supernova in the temporal range covered by our emulator. of 3 days. By fitting the early light curve, we estimated its time
Nevertheless, using the time of explosion, we could still derive of explosion to be JD 2452919.71+0.59
−0.65 (Fig. 6). Apart from the
an approximate EPM distance. more precisely known t0 , this supernova has a more thorough
The second supernova, SN 2003iq was discovered by spectral record during the photospheric phase than its sibling, as
Llapasset et al. (2003) on JD 2452921.5 during the photometric four spectra were acquired during its early evolution.
follow-up observations of SN 2003hl. Owing to the monitoring The fitted spectral time series of the supernovae are dis-
of the host, a pre-discovery image was taken on JD 2452918.5 by played in Fig. 7. The EPM regression derived from the obtained
A129, page 8 of 18Csörnyei, G., et al.: A&A 672, A129 (2023)
2.0 Mean fit SN 2003hl The second supernova, SN 2008ho, was discovered on JD
68% 2454796.61 by Pignata et al. (2008). The last pre-discovery
1.5 2003hl Dt0==33.95 ± 4.49 Mpc
0.00 ± 1.2 day
2003iq non-detection occurred on JD 2454787.77, which provides
/vph [d/Mpc]
1.0 a weak constraint on the time of explosion: we found
t0 = JD 2454789.63+3.63
−2.54 from the light curve fit (Fig. 9). In
0.5 total, two spectra were obtained for this supernova through the
Carnegie Supernova Project (Hamuy et al. 2006). The spectra
0.0
2.0 were recalibrated using the BV observations obtained through
Mean fit SN 2003iq
68% the CSP project (Anderson et al., in prep., priv. comm.). For the
1.5 2003iq Dt0==26.02 ± 1.85 Mpc
-0.01 ± 0.54 day
2003hl EPM, we made use of the BV photometry from the same cam-
/vph [d/Mpc]
paign.
1.0
The fitted spectral sequences of SN 2002gw and SN 2008ho
0.5 are shown in Fig. 10. From the EPM regression we obtained a
distance for SN 2008ho of D = 40.02 ± 5.07 Mpc (Fig. 11).
0.0 On the other hand, we found D = 43.46 ± 3.77 Mpc for BV
0 5 10 15 20 25 30 35
t t0 [d] bands only and D = 43.85 ± 3.78 Mpc for the full BV I set
for SN 2002gw (see Fig. 12 for the comparison). Our distance
Fig. 8. Evolution of Θ/vph for SNe 2003hl (top panel) and 2003iq (bot- estimates for SN 2002gw fall between the values derived by
tom panel). Jones et al. (2009) for the different dilution factors (D = 37.4 ±
4.9 Mpc and D = 63.9 ± 17.0 Mpc) and agree well with the
previous SCM (D = 48.1 ± 6.2 Mpc, Olivares 2010) and pho-
physical parameters is shown in Fig. 8. We obtain D = 33.95 ± tospheric magnitude method estimates (D = 45.10 ± 3.11 Mpc,
4.49 Mpc and 26.02 ± 1.85 Mpc for the distance of NGC 772 Rodríguez et al. 2014). Although the difference is only ∼1%, we
from SN 2003hl and SN 2003iq, respectively. Although we could used the BV instead of the BV I distance for SN 2002gw for the
use only one spectrum for SN 2003hl and, hence, the resulting plots and the distance consistency check (Sect. 5) to make the
distance estimate is fairly uncertain, both the final result and the analysis of the siblings as similar as possible. We suspect that
Θ/vph value around 15 days show a broad consistency with those the majority of the offset between the distances of the two SNe
of SN 2003iq. can be attributed to the relatively large uncertainties on the times
By comparing our results with the classical EPM carried of explosion. Nevertheless, the two distances are fully consistent
out by Jones et al. (2009), we find significant differences for within 1σ.
SN 2003hl and SN 2003iq as well, both for the Eastman et al.
(1996) and Dessart & Hillier (2005a) correction factors: in the
4.4. NGC 6946
case of 2003hl, our distance is larger than the two Jones et al.
(2009) estimates (D = 17.7 ± 2.1 Mpc and D = 30.3 ± 6.3 NGC 6946 (Fig. 1) is a bright face-on SABcd type galaxy,
Mpc for the different correction factors respectively), while which produced several Type II supernovae: SNe 1948B, 1980K,
for SN 2003iq our distance is shorter than the previous esti- 2002hh, 2004et, and 2017eaw. Due to its proximity, the distance
mates (D = 36.0 ± 5.6 Mpc and D = 53.3 ± 17.1 Mpc, of this galaxy could be estimated through the tip of the red giant
Jones et al. 2009). However, the differences between the esti- branch (TRGB) method (Anand et al. 2018) and the planetary
mates can be explained by the significantly higher colour excess nebulae luminosity function (PNLF) relation (Herrmann et al.
we obtained for SN 2003iq (with our best estimate being E(B − 2008). Three of the aforementioned supernovae (SNe 2002hh,
V) = 0.14 mag) and by the fact that we could not make use 2004et and 2017eaw) were observed spectroscopically during
of more than one spectrum for SN 2003hl, due to the limita- the early photospheric phase, which makes it possible to mea-
tions in our modelling approach. On the other hand, by com- sure their distances through the tailored-EPM. However, only
paring our estimates with previous SCM distances, we find our SNe 2004et and 2017eaw were optimal for our purposes: even
solution for SN 2003iq is consistent with the previous result of though the spectral time series and the photometric coverage
Poznanski et al. (2009; D = 26.6 ± 1.25 Mpc), while our dis- would have allowed the analysis of SN 2002hh, it was found
tance for SN 2003hl is not in tension with the SCM estimate of that this supernova exhibited a very strong, two-component red-
Olivares (2010; D = 25.6 ± 3.30 Mpc). dening (one component arising from the joint effect of the inter-
stellar dust in the host and the Milky Way, the other from large
quantities of local dust, see Barlow et al. 2005; Pozzo et al. 2006
4.3. NGC 922
and Welch et al. 2007). With the currently available data and
The peculiar SBcd type galaxy NGC 922 (Fig. 1) hosted two methodology, it is not possible to obtain an accurate extinction
Type II supernovae six years apart: SN 2002gw and SN 2008ho. correction. Considering the very high reddening, any error in our
First, SN 2002gw was discovered on JD 2452560.8 (Monard extinction correction would significantly impact the inferred dis-
2002). Although the latest non-detection occurred too far from tance. Hence, we chose to exclude SN 2002hh from the analysis.
the discovery to be useful for constraining the explosion date, SN 2004et was discovered on JD 2453273 by Zwitter et al.
the fitting of the early light curve (including the unfiltered CCD (2004), and extensively followed up on by the 2-m Himalayan
observations obtained by Itagaki et al. 2002 and Monard 2002) Chandra Telescope (HCT) of the Indian Astronomical Obser-
gave an estimate of JD 2452556.58+0.97−1.40 (Fig. 9), which is consis-
vatory (IAO) and the 3-m Shane telescope at the Lick Obser-
tent with the value obtained through performing the EPM regres- vatory. The resulting spectral times series have been previously
sion in Jones et al. (2009). In total, three optical spectra were studied by Sahu et al. (2006). However, the spectra taken with
acquired for this supernova by the CATS program (Hamuy et al. the HCT were subject to calibration issues, which could not
2006) in the epoch range that could be used for our EPM be corrected with our standard linear flux re-calibration. Since
analysis. these issues can influence the fitting significantly, we attempted
A129, page 9 of 18Csörnyei, G., et al.: A&A 672, A129 (2023)
Mean fit 68% 95% V
1.2
1.0
Flux (normalized)
0.8
0.6
0.4
0.2
0.0
0 5 10 15 20 25
MJD - 52555
Fig. 9. Early light curve fits of SN 2002gw (left) and SN 2008ho (right), along with the determined time of explosion posteriors (blue shaded
regions).
SN 2002gw SN 2008ho Observed
Emulator fit
1.0
0.5 16.5 d
0.0
F (normalized)
0.5 20.1 d
20.5 d
1.0
21.1 d
1.5
25.4 d
2.0
4000 5000 6000 7000 8000 9000 4000 5000 6000 7000 8000 9000
[Å] [Å]
Fig. 10. Spectral time series of SNe 2002gw and 2008ho, along with their fits. Grey-shaded areas denote telluric regions.
to correct them empirically, using spectra taken with the Keck straints on the time of explosion, the six spectra obtained in
and Lick telescopes. This procedure is detailed in Appendix A. the first month after explosion also allowed for a precise EPM
We completed this spectral time series with three additional analysis.
early-time spectra obtained at the David Dunlap Observatory SN 2017eaw was discovered by Wiggins (2017) on JD
(Takáts & Vinkó 2012, courtesy of József Vinkó). However, 2457885.78, and then extensively followed up on with spec-
since these spectra covered only a very narrow wavelength troscopic observations at the Las Cumbres Observatory 1 m
range, we could not apply the re-calibration procedure from telescope and at the McDonald Observatory with the Low-
Sect. 3.1.3. The pre-discovery non-detection of the supernova Resolution Spectrograph 2 mounted on the 10 m Hobby–
and the subsequent early photometry from Li et al. (2004) has Eberly Telescope. The observations are described in Szalai et al.
allowed for an accurate determination of the time of explo- (2019). The supernova was discovered early, on the rise, and
sion through the fitting of the early light curve (Fig. 13), which a non-detection is also available from a pre-discovery obser-
yielded t0 = JD 2453271.19+0.16 −0.17 . Along with the tight con- vation of the host, which yielded a time of explosion of t0 =
A129, page 10 of 18Csörnyei, G., et al.: A&A 672, A129 (2023)
Mean fit SN 2002gw
5. Discussion
1.0 68%
2002gw BVI D = 43.46 ± 3.67 Mpc As shown in the previous sections, the fitting procedure not only
2002gw BV t0 = -0.22 ± 1.14 day
/vph [d/Mpc]
2008ho yields distances with a claimed uncertainty of ∼10% or bet-
0.5
ter (Table 3), it does so by requiring only a limited amount of
modelling choices. Due to various uncertainties in the observa-
tions and the modelling, these distances can be slightly differ-
0.0 ent for the supernova siblings. The main question, in this case,
Mean fit SN 2008ho is whether the estimated distances of the siblings are consis-
1.0 68%
2008ho D = 40.0 ± 5.07 Mpc tent with one another. Assuming an average galaxy, a reliable
2002gw BV t0 = 0.04 ± 2.12 day
/vph [d/Mpc]
upper limit for the thickness of the disc is 10 kpc, while the
width of the disc is on the order of 100 kpc (Gilmore & Reid
0.5
1983; Zanisi et al. 2020). Consequently, in an ideal case, assum-
ing face-on galaxies, the distances inferred for the supernova
0.0
siblings should match to an uncertainty of ±0.01 Mpc, which
0 5 10 15 20 25 30 35 corresponds to only ∼0.2% even for the most nearby pair. For
t t0 [d]
more inclined galaxies, the uncertainties can be one order of
Fig. 11. Evolution of Θ/vph for SNe 2002gw (top panel) and 2008ho magnitude larger; however, since the closest hosts we investi-
(bottom panel). gated are very likely to be low-inclination galaxies (M 61 and
NGC 6946) and the ones farther away are not viewed edge-on
either (NGC 722 and NGC 922), the offset between the sib-
1.00 2002gw BVI lings should remain sub-1% relative to the distance of the galaxy.
D = 43.46 ± 3.67 Mpc 2002gw BV
t0 = -0.22 ± 1.14 day Hence, the distance estimation to siblings provides an empirical
0.75
test to assess the effect of these uncertainties and systematics
D = 43.85 ± 3.78 Mpc
t0 = -0.24 ± 1.15 day (e.g. the CSM interaction, or data calibration issues, among oth-
/vph [d/Mpc]
ers). It allows us to test whether our results are not only precise
0.50
but accurate as well.
To test the consistency of the obtained distances, we per-
0.25 formed a Bayesian model comparison. We adopted the method-
ology used by Wong et al. (2020) for assessing whether pairs of
0.00 strongly lensed quasars favour a single global set of cosmolog-
0 5 10 15 20 25 30 35 ical parameters or individual cosmologies for each lens that are
t t0 [d] inconsistent with one another. We applied this method to the dis-
Fig. 12. EPM regression performed for SN 2002gw on the Θ/vph values tance estimates of the siblings: thus, we asked the question of
calculated using the BV (green) and BV I (blue) bandpass sets. whether the measured distance posteriors of a pair have more
likely been generated from a single underlying distance, Dgal ,
or from two distinct distances, Dind,1 and Dind,2 (and would thus
+0.25 prove inconsistent). The probability ratio of the two scenarios is
JD 2457886.01−0.20 . In terms of spectroscopy, this supernova had
called the Bayes factor and can be calculated as:
the best-sampled and most homogenous spectral sequence in our
sample, resulting in eight well-calibrated spectra. R D2
The calibrated and fitted spectral sequences are shown in P(di , dj |Dgal ) D1
di dj P(D)dD
Fi j = = RD ,
Fig. 14. For SN 2004et, the EPM regression yielded a distance ind,i
P(di |D )P(dj |D ) ind,j 2
R D2
di P(D)dD D dj P(D)dD
of D = 5.99 ± 0.36 Mpc, while for SN 2017eaw the resulting 1 D 1
value was D = 6.44 ± 0.29 Mpc (Fig. 15). The distance for (7)
SN 2004et is 20% higher than the classical EPM value inferred where di and dj denote the distance posteriors of the individ-
by Takáts & Vinkó (2012) and Szalai et al. (2019), while for ual supernovae in each pair. We chose a uniform prior P(D)
SN 2017eaw the value we obtained is about 5–20% lower than around the average distance of the host (based on previous mea-
the value from Szalai et al. (2019; depending on the assumed surements, as quoted on NASA/IPAC Extragalactic Database,
reddening and the chosen epoch range of spectra of the reference NED7 ), ranging from half to twice that distance. The quoted
work, see Szalai et al. 2019 for details). We note that our dis- Bayes factors can thus be understood as lower limits since they
tance estimates are in much better agreement with one another, scale linearly with the width of the distance prior. If the obtained
which highlights the advantage of the tailored-EPM over the Bayes factor exceeds unity, this can be interpreted as a sign of
classical EPM approach. The distances are also consistent with consistency between the two posterior distributions in accor-
the various independent distances obtained for NGC 6946: dance with the table of Kass & Raftery (1995). The higher the
apart from the previous EPM-based values, our estimates are in F value, the stronger the consistency between the siblings.
agreement with SCM distances of Poznanski et al. (2009) and The distance posteriors from the EPM analysis are shown in
de Jaeger et al. (2017) (both of which yielded D = 6.69 ± 0.30 Fig. 16, while the obtained Bayes factors are listed in Table 4.
Mpc for SN 2004et) and the PNLF distance (Herrmann et al. The consistency of the distance posteriors for the various super-
2008, D = 6.1 ± 0.6 Mpc), but is slightly lower than the lat- novae is good, with Bayes factors being close to or over 5
est TRGB estimate (D = 6.95 ± 0.20 Mpc, Anand et al. 2022, for two cases, showing remarkable agreement. In the case of
from the Extragalactic Distance Database6 ). NGC 772 and NGC 922 the values of the Bayes factors are lower,
which might be attributed to the lack of a well-sampled spectral
6 7
https://edd.ifa.hawaii.edu/ https://ned.ipac.caltech.edu/
A129, page 11 of 18Csörnyei, G., et al.: A&A 672, A129 (2023)
Mean fit 95% B V R Mean fit 95% V R I
68% Non-detection limit 68% Non-detection limit
1.4 1.50
1.2 1.25
Flux (normalized)
1.0
Flux (normalized)
1.00
0.8 0.75
0.6
0.50
0.4
0.25
0.2
0.0 0.00
0.2 0.25
0.0 2.5 5.0 7.5 10.0 12.5 15.0 17.5 20.0 0 2 4 6 8 10
MJD - 53269.5 MJD - 57885.8
Fig. 13. Exponential fit on the early light curves of SN 2004et (left) and SN 2017eaw (right), along with the determined time of explosion posteriors
(blue shaded regions).
2
SN 2004et SN 2017eaw Observed
Emulator fit
11.8 d
0 11.0 d
13.8 d
12.9 d
15.8 d
14.9 d
F (normalized)
2
19.8 d
20.8 d 21.8 d
4
24.6 d 22.7 d
24.7 d
30.6 d
6
32.8 d
4000 5000 6000 7000 8000 9000 4000 5000 6000 7000 8000 9000
[Å] [Å]
Fig. 14. Spectral time series of SNe 2004et and 2017eaw, along with their fits.
sequence for SN 2003hl and the lack of well-constrained explo- precise and consistent values for the supernova pairs, as in the
sion date for SNe 2002gw and 2008ho. However, the remaining case of SNe 2004et and 2017eaw or in the case of SNe 2008in
cases show that the fitting method and the analysis result in dis- and 2020jfo.
tances that are not only consistent for supernovae in the same We offer the caveat that some of our results may be influ-
host but are also precise to a degree of a few percent. The anal- enced by the choice of RV = 3.1. If the true RV is different,
ysis also showed that some of the greatest limiting factors of the this could, in principle, cause notable offsets between the sibling
method are: an insufficient amount of spectra, poor quality and distances, provided that the differential reddening between the
calibration-level of the obtained spectral times series, and weak objects is non-negligible and the measurement uncertainties are
constraints on the time of explosion. If all the conditions for the low enough. In our sample, however, the pairs with the most sig-
above were met, the EPM analysis would be able to yield highly nificant differential reddening had also the largest uncertainty on
A129, page 12 of 18Csörnyei, G., et al.: A&A 672, A129 (2023)
Mean fit
Table 4. Bayes factors for the comparisons of the distance posteriors of
SN 2004et
68% the various SN pairs.
6 2004et D = 5.99 ± 0.36 Mpc
2017eaw t0 = -0.07 ± 0.16 day
/vph [d/Mpc]
4 Galaxy SN 1 DSN 1 SN 2 DSN 2 Bayes factor Prior
NGC 772 2003hl 33.95 ± 4.49 Mpc 2003iq 26.02 ± 1.85 Mpc 0.890 13.44 – 53.77 Mpc
2 NGC 922 2002gw 43.46 ± 3.67 Mpc 2008ho 40.02 ± 5.07 Mpc 3.448 21.29 – 85.16 Mpc
NGC 4303 2008in 15.06 ± 0.71 Mpc 2020jfo 14.95 ± 0.78 Mpc 7.944 7.31 – 29.25 Mpc
NGC 6946 2004et 5.99 ± 0.36 Mpc 2017eaw 6.44 ± 0.29 Mpc 4.272 2.77 – 11.09 Mpc
0
Mean fit SN 2017eaw
68%
6 2017eaw D = 6.44 ± 0.29 Mpc
2004et t0 = 0.01 ± 0.22 day
/vph [d/Mpc]
6. Summary
4
In this work, we investigated the consistency of the EPM dis-
2 tances of sibling Type II SNe, calculated based on the spectral
fitting method introduced by Vogl et al. (2020). According to our
0 analysis, the method not only yields precise results with an esti-
0 5 10 15 20 25 30 35 40
t t0 [d] mated individual distance uncertainty that is better than ∼10%,
Fig. 15. Evolution of Θ/vph for SNe 2004et (top panel) and 2017eaw
despite using literature data from a wide range of sources, but
(bottom panel). the resulting distances are consistent for SNe that are within the
same host galaxy. The degree of consistency depends on how
well the supernovae were observed, with the worst results occur-
Table 3. Summary table of the EPM results. ring when the quality of the data barely allows for the EPM anal-
ysis, while the best consistency is achieved when both super-
novae are similarly well observed and have a good constraint
Host SN D [Mpc] t0 (MJD) E(B − V) [mag] on the time of explosion. In the cases of M 61 and NGC 6946,
M61 2008in 15.06(0.71) 54824.15(0.15) 0.06(0.03) highly consistent distances are derived with mismatches of less
2020jfo 14.95(0.78) 58975.08(0.34) 0.07(0.04) than 5%.
NGC 722 2003hl 33.95(4.49) 52864.26(1.20) 0.31(∗) The high level of consistency between siblings also shows
2003iq 26.02(1.85) 52919.20(0.54) 0.15(0.05) that if there are any other systematics present between the vari-
NGC 922 2002gw 43.46(3.67) 52555.84(1.15) 0.12(0.03) ous SNe, they are likely subdominant compared to the effect of
2008ho 40.02(5.07) 54789.17(2.12) 0.21(∗)
observation quality. Such systematics may include different red-
NGC 6946 2004et 5.99(0.36) 53270.62(0.16) 0.38(0.10)
dening, CSM interaction, explosion energetics, and metallicities.
2017eaw 6.44(0.29) 57885.52(0.22) 0.35(0.04)
Checking for the effect and scale of such systematics will require
Notes. t0 denotes the time of explosion as obtained by the EPM regres- a larger set of siblings with data quality that matches that of the
sion. The E(B − V) values listed here are those determined by the spec- siblings of M 61 or NGC 6946.
tral fitting. The values in brackets denote the uncertainties of the given Apart from checking for the internal consistency of the
quantities. In the starred (*) cases we either had only one spectrum to fit method, we obtained precise distances for the four investigated
or both spectra yielded the same reddening value, which did not allow host galaxies, even though we used literature data with a highly
us to give a reasonable empirical uncertainty. varying level of calibration. Furthermore, the tailored-EPM pro-
vides absolute distances is physics-based and is affected by dif-
ferent systematics than the other existing distance estimation
D [Mpc] D [Mpc]
0.35
20 30 40 50 20 30 40 50 60 70 80 techniques; thus, it can be utilised completely independently of
0.30
NGC 772 2003hl NGC 922 2002gw 0.20 them. These properties and the presented analysis in this paper
F: 0.89 2003iq F: 3.45 2008ho
0.25
0.15
demonstrate the potential of the tailored-EPM to provide not
0.20 only precise distances but a precise Hubble parameter as well.
0.10
h
h
0.15 Such an analysis is currently being conducted on high-quality
0.10
0.05 spectral time series obtained for SNe II in the Hubble Flow by
0.05
0.00 0.00 the adH0cc collaboration (accurate determination of H0 with
0.7 NGC 4303 2008in NGC 6946 2004et 1.50
core-collapse supernovae8 ), which will provide important clues
0.6 F: 7.94 2020jfo F: 4.27 2017eaw to the Hubble tension.
1.25
0.5 1.00
0.4
0.75
h
h
0.3 Acknowledgements. We especially thank J. Anderson, M. Stritzinger and the
0.2 0.50 CSP collaboration for providing us pre-published data, which helped us to
0.1 0.25 improve our analysis. The research was completed with the extensive use of
0.0 0.00 Python, along with the numpy (Harris et al. 2020), scipy (Virtanen et al. 2020)
10 15 20 25 4 6 8 10
D [Mpc] D [Mpc] and astropy (Astropy Collaboration 2018) modules. This research made use
of Tardis, a community-developed software package for spectral synthesis
Fig. 16. Distance posteriors obtained from the EPM analysis of the in supernovae (Kerzendorf & Sim 2014; Kerzendorf et al. 2022). The devel-
supernovae for the various host galaxies. The calculated Bayes factors opment of Tardis received support from the Google Summer of Code ini-
are displayed in the top-left corners of the panels. tiative and from ESA’s Summer of Code in Space program. Tardis makes
extensive use of Astropy and PyNE. Based on observations obtained with the
Samuel Oschin 48-inch Telescope at the Palomar Observatory as part of the
Zwicky Transient Facility project. ZTF is supported by the National Science
Foundation under Grant No. AST-1440341 and a collaboration including Cal-
their distance and vice versa. Hence, it is currently not possible tech, IPAC, the Weizmann Institute for Science, the Oskar Klein Center at
to estimate the scale of this effect on the basis of our four sibling
8
pairs. https://adh0cc.github.io/
A129, page 13 of 18You can also read