COMPANY OVERVIEW United States' Leading Silver Producer - RESPONSIBLE. SAFE. INNOVATIVE.
←
→
Page content transcription
If your browser does not render page correctly, please read the page content below
COMPANY
OVERVIEW

United States’ Leading
Silver Producer

March 2022

                         RESPONSIBLE. SAFE. INNOVATIVE.

NYSE: HL
CAUTIONARY STATEMENTS

 Cautionary Statement Regarding Forward Looking Statements

 This presentation contains “forward-looking statements” within the meaning of Section 27A of the Securities Act of 1933, as amended, and Section 21E of the Securities Exchange Act of 1934, as amended,
 which are intended to be covered by the safe harbor created by such sections and other applicable laws, including Canadian securities laws. When a forward-looking statement expresses or implies an
 expectation or belief as to future events or results, such expectation or belief is expressed in good faith and believed to have a reasonable basis. However, such statements are subject to risks, uncertainties
 and other factors, which could cause actual results to differ materially from future results expressed, projected or implied by the forward-looking statements. Forward-looking statements often address our
 expected future business and financial performance and financial condition and often contain words such as “anticipate,” “intend,” “plan,” “will,” “could,” “would,” “estimate,” “should,” “expect,” “believe,”
 “project,” “target,” “indicative,” “preliminary,” “potential” and similar expressions. Forward-looking statements in this presentation may include, without limitation: (i) new mining method implemented at Lucky
 Friday should improve safety and increase productivity; (ii) increased demand for silver due to transition to clean energy; and; (iii) mine-specific and Company-wide 2022 estimates of future production, sales,
 costs of sales and cash cost and AISC per ounce (in each case after by-product credits), as well as Company-wide estimated spending on capital, exploration and pre-development for 2022.The material
 factors or assumptions used to develop such forward-looking statements or forward-looking information include that the prices assumed in the calculation of cash cost and AISC will occur and the Company’s
 plans for development and production will proceed as expected and will not require revision as a result of risks or uncertainties, whether known, unknown or unanticipated, to which the Company’s operations
 are subject.

 Estimates or expectations of future events or results are based upon certain assumptions, which may prove to be incorrect, which could cause actual results to differ from forward-looking statements. Such
 assumptions, include, but are not limited to: (i) there being no significant change to current geotechnical, metallurgical, hydrological and other physical conditions; (ii) permitting, development, operations and
 expansion of the Company’s projects being consistent with current expectations and mine plans; (iii) political/regulatory developments in any jurisdiction in which the Company operates being consistent with
 its current expectations; (iv) the exchange rate for the USD/CAD and USD/MXN, being approximately consistent with current levels; (v) certain price assumptions for gold, silver, lead and zinc; (vi) prices for
 key supplies being approximately consistent with current levels; (vii) the accuracy of our current mineral reserve and mineral resource estimates; (viii) there being no significant changes to Company plans for
 2022 and beyond due to COVID-19 or any other public health issue, including, but not limited to with respect to availability of employees, vendors and equipment; (ix) the Company’s plans for development
 and production will proceed as expected and will not require revision as a result of risks or uncertainties, whether known, unknown or unanticipated; (x) counterparties performing their obligations under
 hedging instruments and put option contracts; (xi) sufficient workforce is available and trained to perform assigned tasks; (xii) weather patterns and rain/snowfall within normal seasonal ranges so as not to
 impact operations; (xiii) relations with interested parties, including Native Americans, remain productive; (xiv) maintaining availability of water rights; (xv) factors do not arise that reduce available cash
 balances; and (xvi) there being no material increases in our current requirements to post or maintain reclamation and performance bonds or collateral related thereto.

 In addition, material risks that could cause actual results to differ from forward-looking statements include, but are not limited to: (i) gold, silver and other metals price volatility; (ii) operating risks; (iii) currency
 fluctuations; (iv) increased production costs and variances in ore grade or recovery rates from those assumed in mining plans; (v) community relations; (vi) conflict resolution and outcome of projects or
 oppositions; (vii) litigation, political, regulatory, labor and environmental risks; (viii) exploration risks and results, including that mineral resources are not mineral reserves, they do not have demonstrated
 economic viability and there is no certainty that they can be upgraded to mineral reserves through continued exploration; (ix) the failure of counterparties to perform their obligations under hedging
 instruments; (x) we take a material impairment charge on our Nevada operations; and (xi) we are unable to remain in compliance with all terms of the credit agreement in order to maintain continued access to
 the revolver. For a more detailed discussion of such risks and other factors, see the Company’s 2021 Form 10-K, filed on February 22, 2022, with the Securities and Exchange Commission (SEC), as well as
 the Company’s other SEC filings. The Company does not undertake any obligation to release publicly, revisions to any “forward-looking statement,” including, without limitation, outlook, to reflect events or
 circumstances after the date of this presentation, or to reflect the occurrence of unanticipated events, except as may be required under applicable securities laws. Investors should not assume that any lack of
 update to a previously issued “forward-looking statement” constitutes a reaffirmation of that statement. Continued reliance on “forward-looking statements” is at investors’ own risk.

NYSE: HL                                                                                                                                                                                    RESPONSIBLE. SAFE. INNOVATIVE. l 2
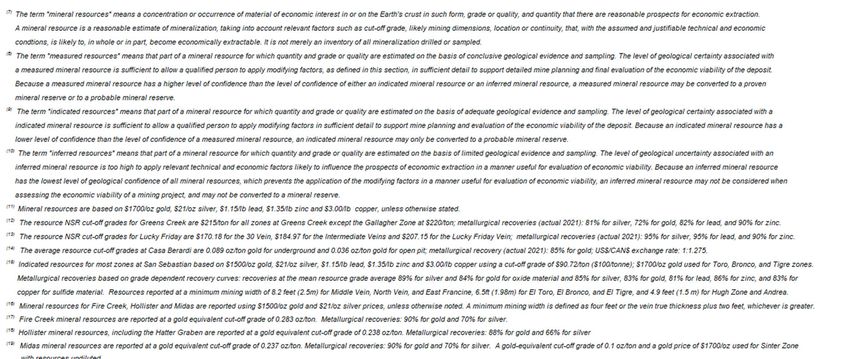
CAUTIONARY STATEMENTS (cont’d)
Cautionary Note Regarding Reserves and Resources
This presentation uses the terms “mineral resources,” “measured mineral resources,” “indicated mineral resources” and “inferred mineral resources.” Mineral resources that are not mineral reserves do not have
demonstrated economic viability. You should not assume that all or any part of measured or indicated mineral resources will ever be converted into mineral reserves. Further, inferred mineral resources have a
great amount of uncertainty as to their existence and as to whether they can be mined legally or economically, and an inferred mineral resource may not be considered when assessing the economic viability of
a mining project, and may not be converted to a mineral reserve. On October 31, 2018, the SEC adopted new mining disclosure rules (“S-K 1300”) that is more closely aligned with current industry and global
regulatory practices and standards, including National Instrument 43-101 – Standards of Disclosure for Mineral Projects (“NI 43-101”) which we comply with because we also are a “reporting issuer” under
Canadian securities laws. While S-K 1300 is more closely aligned with NI 43-101 than the prior SEC mining disclosure rules, there are some differences. NI 43-101 is a rule developed by the Canadian
Securities Administrators, which established standards for all public disclosure an issuer makes of scientific and technical information concerning mineral projects. Unless otherwise indicated, all resource and
reserve estimates contained in this presentation have been prepared in accordance with NI 43-101, as well as S-K 1300. Investors are urged to consider closely the disclosure in the Company’s Annual Report
on Form 10-K for the year ended December 31, 2021 available at www.sec.gov.

Qualified Person (QP)
Kurt D. Allen, MSc., CPG, Vice President - Exploration of Hecla Mining Company and Keith Blair, MSc., CPG, Chief Geologist of Hecla Limited, who serve as a Qualified Person under S-K 1300 and “NI 43-
101”, supervised the preparation of the scientific and technical information concerning Hecla’s mineral projects in this presentation. Technical Report Summaries for each of the Company’s material properties
are filed as exhibits 96.1, 96.2 and 96.3 to the Company’s Annual Report on Form 10-K for the year ended December 31, 2021 and are available at www.sec.gov. Information regarding data verification,
surveys and investigations, quality assurance program and quality control measures and a summary of analytical or testing procedures for the Greens Creek Mine are contained in a technical report titled
“Technical Report for the Greens Creek Mine” effective date December 31, 2018, and for the Lucky Friday Mine are contained in a technical report titled “Technical Report for the Lucky Friday Mine Shoshone
County, Idaho, USA” effective date April 2, 2014, for Casa Berardi are contained in a technical report titled “Technical Report on the mineral resource and mineral reserve estimate for Casa Berardi Mine,
Northwestern Quebec, Canada” effective date December 31, 2018 (the “Casa Berardi Technical Report”), and for the San Sebastian Mine, Mexico, are contained in a technical report prepared for Hecla titled
“Technical Report for the San Sebastian Ag-Au Property, Durango, Mexico” effective date September 8, 2015. Also included in these three technical reports is a description of the key assumptions, parameters
and methods used to estimate mineral reserves and resources and a general discussion of the extent to which the estimates may be affected by any known environmental, permitting, legal, title, taxation, socio-
political, marketing, or other relevant factors. Information regarding data verification, surveys and investigations, quality assurance program and quality control measures and a summary of sample, analytical or
testing procedures for the Fire Creek Mine are contained in a technical report prepared for Klondex Mines, dated March 31, 2018; the Hollister Mine dated May 31, 2017, amended August 9, 2017; and the
Midas Mine dated August 31, 2014, amended April 2, 2015. Copies of these technical reports are available under Hecla’s and Klondex’s profiles on SEDAR at www.sedar.com. Mr. Allen and Mr. Blair reviewed
and verified information regarding drill sampling, data verification of all digitally collected data, drill surveys and specific gravity determinations relating to all the mines. The review encompassed quality
assurance programs and quality control measures including analytical or testing practice, chain-of-custody procedures, sample storage procedures and included independent sample collection and analysis.
This review found the information and procedures meet industry standards and are adequate for Mineral Resource and Mineral Reserve estimation and mine planning purposes.

Cautionary Note Regarding Non-GAAP measures
Cash cost per ounce of silver and gold, after by-product credits, EBITDA, adjusted EBITDA, AISC, after by-product credits, realized silver margin, and free cash flow represent non-U.S. Generally Accepted
Accounting Principles (GAAP) measurements. A reconciliation of these non-GAAP measures to the most comparable GAAP measurements can be found in the Appendix.

NYSE: HL                                                                                                                                                                        RESPONSIBLE. SAFE. INNOVATIVE. l 3
2021: RECORD REVENUES, 2nd HIGHEST SILVER RESERVES

     Silver – Metal for                        Largest U.S. Silver
                                                                             ESG Focus                Record Year
       Green Future                                Producer
 • Silver is key to clean                    • Hecla produces >40%      • Strong safety          • Developed
   and green energy                            of U.S. silver             performance, All-        Underhand Closed
   transition                                • Largest silver reserve     Injury Frequency         Bench (UCB) mining
 • 2021E silver demand                         base in the U.S. with      Rate of 1.45, 40%        method at Lucky
   of 1.29 billion oz* with                    200 Moz in silver          lower than U.S.          Friday
   photovoltaic demand                         reserves                   average                • 2nd highest silver and
   estimated to rise 13%                     • Technical reports        • Net neutral on scope     gold reserves
   to 110 Moz                                  confirm strong             1 & 2 emissions        • Record revenues,
                                               reserve economics                                   Adjusted EBITDA, 2nd
                                               and long mine lives                                 highest cash flows
                                                                                                   from operations and
                                                                                                   free cash flow

           * Source – The Silver Institute
NYSE: HL                                                                                                 RESPONSIBLE. SAFE. INNOVATIVE. l 4
RESERVES: 2021 vs. 2020
2nd highest silver and gold reserves, mining depletion replaced by increased reserves

• Greens Creek silver reserves up +12%, second highest
  since 2002
• Company wide measured & indicated resources declined
  due to conversion to reserves
• Inferred resources increased 8% for silver, 2% for gold
• Reserve prices: Gold $1,600/oz, Silver $17/oz

                   Silver Reserves                                     Gold Reserves
                        (Million Ounces)                                 (Thousand Ounces)

                  +6%
                                                                    +14%
                                                                      +14%

NYSE: HL                                                                                 RESPONSIBLE. SAFE. INNOVATIVE. l 5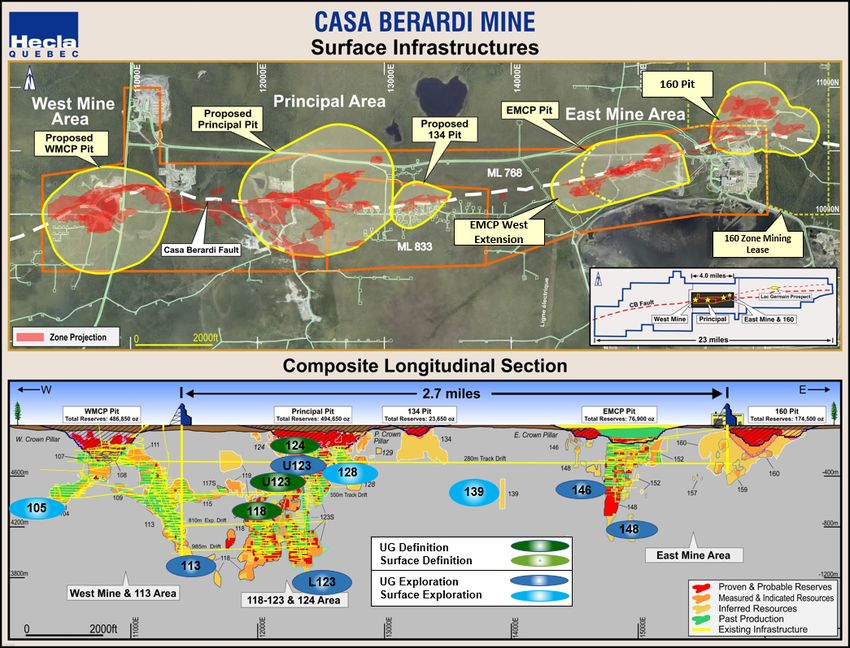
WHY INVEST IN HECLA?
The largest U.S. silver producer with the largest U.S. reserve base

 Primary U.S.                      • Right jurisdiction for risk and ESG
    Based
 Operations                        • Net neutral in scope 1 & 2 emissions

     Highest                      • Long lived mines with decades ahead of us
  grade silver                    • Produce >40% silver mined in the U.S.
   miner with
  largest U.S.                    • Generated cumulatively >$200 million in
    reserves                        free cash flow in 2020 & 2021

                                  • 2022E silver production from Lucky Friday
   Silver                           is 20% higher than 2021, 111% higher than
production is                       2020
  growing                         • Exploration resulted in 2nd highest reserves

  Only silver-
    linked                         • Paying dividends for a decade
   dividend                        • Dividends were 19% of 2021 free cash flow
    policy
 Brand Value                        • 130 years old and 55 years on NYSE
           *Includes $17.3 million in letters of credits drawn on the revolving credit facility
NYSE: HL                                                                                          RESPONSIBLE. SAFE. INNOVATIVE. l 6
LOW POLITICAL RISK
U.S. and Canada focus results in one of the safest operating jurisdictions
                                                                                                                                                                     Policy Perception Index: Measures
                                      (1)
  Geographic Risk Profile                                                                                                                                            attractiveness of mining policies in a jurisdiction
  2020 Fraser Institute Policy Perception Index | Operating Assets Only                                                                                              based on the opinions of managers and
                                                                                                                                                                     executives
                                                                                                                                                                          Most Attractive                 Least Attractive
                                                                                                                                                                          Jurisdiction       Rating       Jurisdiction       Rating

                                                                                                                                                                      1. Idaho (USA)        100.00    77. Venezuela             0.00
                                                                                                                                                                      2. Wyoming (USA)       99.54    76. Chubut (AR)        38.94
                                                                                                                                                                      3. Finland             99.07    75. Zimbabwe           39.42
     96.2                                                                                                                                                             4. Ireland             98.72    74. Bolivia            44.73
                                                                                                                                                                      5. Nevada (USA)        98.64    73. Mendoza (AR)       47.45

                   88.3

                                  82.3           82.3           81.0
                                                                               78.4           78.3           77.4
                                                                                                                            76.0           75.5           75.3
                                                                                                                                                                         72.6
                                                                                                                                                                                          70.4
                                                                                                                                                                                                       66.6
                                                                                                                                                                                                                         65.1
                                                                                                                                                                                                                                        59.8

     Hecla         Coeur      Agnico Eagle SSR Mining          Yamana        New Gold Alamos Gold           Kinross       Eldorado        Hudbay         Fortuna     First Majestic        Pan        IAMGOLD         Equinox          Centerra
                                                                                                                                                                                         American

                  Source: Fraser Institute and Wall Street research
                  (1) Calculated as the weighted average of each company’s geographic revenue distribution and the respective 2020 Fraser Institute Policy Perception Index
                  (PPI) value for each region. Calculation excludes geographic revenue distribution from countries without PPI scores (China, Greece, Philippines, Switzerland,
NYSE: HL          Singapore, Germany and others).                                                                                                                                                RESPONSIBLE. SAFE. INNOVATIVE. l 7
HECLA MINES >40% OF ALL SILVER PRODUCED IN THE USA
Half of the world’s production is from Mexico, Peru and China; U.S. production is scarce

                      2020 U.S. Silver Production                                                     Hecla’s Share of U.S. Production
                                 (Moz)

    13.5                                                                                                                     43%

                                                                                                              57%

                                                                                                                    Hecla    Other

                            6.5                                                               3 Countries. Produce ~50% of World Production
                                                                                                             U.S. Produces 4%

                                                         3.2
                                                                  2.2                                                       22%
                                                                                 0.9                         48%
                                                                                                                             13%
    Hecla                   Teck                        Coeur   Rio Tinto   Americas Gold &
                                                                                Silver                                  13%

                                                                                                                     4%
                                                                                                    Mexico   Peru     China        USA     ROW

NYSE: HL    Source: Silver Institute; Company Reports                                                                        RESPONSIBLE. SAFE. INNOVATIVE. l 8
FINANCIAL STRENGTH AND FLEXIBILITY
Solid operational performance delivers strong balance sheet

• Record revenues of $807 million, +16% over 2020
• Record adjusted EBITDA of $279 million, +20% over 2020; net debt to adjusted EBITDA ratio of 1.1x, well
  below the 2.0x target(1)
• Cash flow from operations $221 million, free cash flow of $111 million, +23% over 2020
• Cash and equivalents of $210 million, Liquidity of $443 million*

           2021 Revenues By Metal                                                          Adjusted EBITDA, Leverage Ratio(1)                                 Cash & Liquidity
                                                                                                           ($ millions, ratio)                                       ($ millions)

           Silver           Gold             Lead             Zinc

                                                                               290

                                                                                                    1.7x                         $279              2.0x

                                                                                                                                                   1.8x

                       15%
                                                                               270

                                                                                                                                                   1.6x

                                                                               250

                                                                                                    $231                         1.1x              1.4x

                                                 34%
                                                                                                                                                   1.2x

                                                                                                                                                                      Total
                                                                                                                                                                                    Cash
                                                                               230

               9%                                                                                                                                         Revolver* Liquidity
                                                                                                                                                   1.0x

                            2021                                               210

                                                                                                                                                   0.8x

                                                                                                                                                                                    $210
                          Revenues                                             190
                                                                                                                                                   0.6x
                                                                                                                                                            $233     $443 M
                                                                                                                                                   0.4x

                           $807 M                                              170

                                                                                                                                                   0.2x

                                                                               150                                                                 0.0x

                                                                                                    2020                         2021
                                                                                                             (1)                               (1)
                          42%                                                                 Adjusted EBITDA           Net Debt/Adjusted EBITDA

             *Includes $17.3 million in letters of credits drawn on the revolving credit facility
NYSE: HL                                                                                                                                                            RESPONSIBLE. SAFE. INNOVATIVE. l 9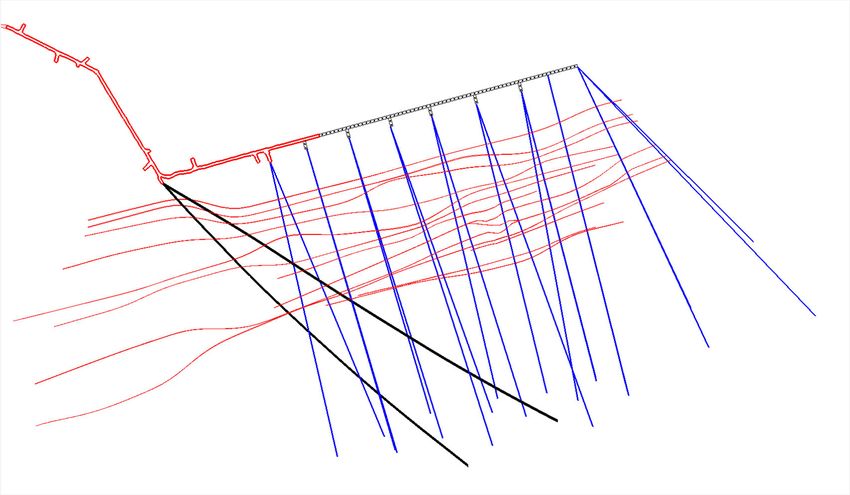
CAPITAL AND PRODUCTION COSTS ARE STABLE
Impact from inflation is relatively low due to low tonnage, high-grade mines

• Increase in silver production not tied to any significant increase in capital
• No significant increase in planned production costs in 2022
• Stable capital costs with no planned large construction projects

           2021: Capital and Production Costs                       2019 – 2022E: Capital Spend
                         ($ millions)                                        ($ millions)

                                                                                                              $135
                                                             $121
                                        Greens Creek                                         $109
               Casa Berardi                $176.3                          $91
                 $206.7

                              Lucky Friday
                                 $96.4
                                                             2019          2020             2021             2022E

NYSE: HL                                                                                    RESPONSIBLE. SAFE. INNOVATIVE. l 10
STRONG FREE CASH FLOW GENERATION
Positive free cash flow generation from all mines over last five quarters(2)
Greens Creek Casa Berardi Lucky Friday*
Generated $236 million in Free Cash Flow since Generated $43 million in Free Cash Flow since Generated $33 million in Free Cash Flow in 2021
Q4/2020 Q4/2020
Cash Flow from $58.3 $44.5 $69.8 $43.1 $51.3 $27.0 $32.2 $17.5 $21.4 $12.1 $11.0 $19.7 $15.0 $17.0
Operations:
$63.5
($ millions) $18.4 $14.0
$51.1
$43.0 $41.8
$37.0
$9.6 $7.8
$9.3
$5.9
$5.0
$2.8 $2.6
Q4 2020 Q1 2021 Q2 2021 Q3 2021 Q4 2021 Q4 2020 Q1 2021 Q2 2021 Q3 2021 Q4 2021 Q1 2021 Q2 2021 Q3 2021 Q4 2021
*Free Cash Flow at Lucky Friday presented during periods of full production.
Consolidated
Generated $140 million in Free Cash Flow since Q4/2020
Cash Flow from
$64.9 $37.9 $86.3 $42.7 $53.4
Operations:
($ millions) $54.4
$28.3
$24.5
$16.5 $15.8
Q4 2020 Q1 2021 Q2 2021 Q3 2021 Q4 2021
NYSE: HL Refer to ‘Endnotes’ slide for definitions and footnotes. RESPONSIBLE. SAFE. INNOVATIVE. l 11LOW-COST PROFILE OF SILVER ASSETS
Greens Creek in the top 15th percentile, Lucky Friday expected to be in top 33rd percentile of
primary silver mines
Silver AISC Curve of Primary Silver Mines
US$/oz
– 9 Months Ended September 30, 2021
40
30
20
10
0
-10
-20
-30
0 Greens Creek 25 Lucky Friday 50 Lucky Friday 75 100
2022E
Cumulative Silver Production - Market Share (%)
• Greens Creek’s low-cost structure reflected by its position in the top 15th percentile of AISC of primary silver
mines
• Expected production increases at Lucky Friday to improve its position to the top 33rd percentile in 2022
NYSE: HL Source: Metals Focus Silver Mine Cost Service RESPONSIBLE. SAFE. INNOVATIVE. l 12LOW-CAPITAL PROFILE
Organic growth in production at no significant increase to capital spend
2022 Capital Guidance
$ millions
372 390
305
135 208 280 332 320
Hecla First Majestic Pan American Alamos Coeur
Low End of Guidance High End of Guidance
• Lucky Friday’s production increase with no anticipated large capital outlays
• No major construction capital on the horizon
Source: Company Filings
NYSE: HL RESPONSIBLE. SAFE. INNOVATIVE. l 13GREENS CREEK: ANOTHER SOLID YEAR
Consistent performance, low costs drive free cash flow generation at all silver prices
• Solid finish to 2021, production met guidance,
costs beat guidance – 9.2 Moz silver produced
• Cost of sales $216 million
• Cash costs per silver oz, after by-product credits,
($0.65)
• AISC per silver oz, after by-product credits,
$3.19
• 12% increase in reserves to 125 Moz, 14-year
reserve plan
Realized Silver Margins(3) Free Cash Flow(2)
Top 15th percentile in AISC of primary silver mines Generated $449 million in Free Cash Flow since 2019
Cost of Cash flow from
$210 $217 $216 $135 $177 $204
Sales(7) operations
($ millions) ($ millions)
$185
$157
$10.66 $12.58
$107
$22.05
$5.99 $8.57
$3.19
2019 2020 2021 2019 2020 2021
(4) (3)
AISC Realized Price Margin
NYSE: HL RESPONSIBLE. SAFE. INNOVATIVE. l 14HECLA’S FLAGSHIP ASSET - GREENS CREEK IS A TIER 1 ASSET
2021: 9.2 Moz silver production, $209 M cash flow, $185 M free cash flow**
Cumulative Gross Profit and Cumulative Net Cash Flow* Greens Creek Throughput has Grown 15% Since Purchase in 2008
Cumulative Gross Profit and Net Cash Flow
Greens Creek Production and Reserves
900 16
$ millions
1,666
14
1,526
1,425
1,351
1,257 12
1,167
1,127 800
1,060
10
Ore Production (kt)
Ore Reserves (Mt)
982 Hecla
became
827 operator
8
637
470
6
370
700
250
119 4
(10)
122 216 324 504 698 812 875 941 983 1,061 1,156 1,235 1,336 1,491
2
(118) (11)
600 0
2005
2006
2007
2008
2009
2010
2011
2012
2013
2014
2015
2016
2017
2018
2019
2020
Cumulative
2006
2007
2008
2009
2010
2011
2012
2013
2014
2015
2016
2017
2018
2019
2020
Until 2005
Net Cash Flow* Gross Profit
• Automation drive commenced in 2017 resulting in further efficiencies
• Consistent exploration success maintains stable reserve base
*Net cash flow is a non-GAAP measure and reconciliation to Gross Profit (GAAP) is shown in the Appendix.
**Free Cash Flow is $182.6M of cash flow from operations less $23M of capital spend.
NYSE: HL RESPONSIBLE. SAFE. INNOVATIVE. l 15LUCKY FRIDAY ON TRACK TO BE 5 Moz/YR PRODUCER
Underhand Closed Bench (UCB) mining method expected to improve safety, tonnage and
production
• UCB method’s success with higher grades mined at
depth position Lucky Friday to be a flagship asset
for the next decade
• 2022E production 1.2x 2021, 2.2x 2020, declining
per ounce costs
• 2021 Reserves of 75 Moz, 17-year reserve plan
Silver Production Silver Cash Costs and AISC per ounce*
(Million ounces) Cost of $98 $115
4.6 Sales(7)
($ millions) $14.34
19%
43%
75% $8.25
4.3 $6.60
3.6
2.0 $1.38
2020 2021 2022E 2021 2022E**
(5) (4)
Cash Costs AISC
* Cash Cost and All-in sustaining cost (AISC) is a non-GAAP measure, reconciliation to GAAP is shown in appendix.
NYSE: HL ** Cash costs and AISC per ounce for 2022 are mid points of lower and upper range of guidance
RESPONSIBLE. SAFE. INNOVATIVE. l 16UCB MINING METHOD Isometric view showing two of the four UCB stopes that produce the 30 Vein • Large scale blasting proactively manages seismic risk – miners work inside the de-stressed zone. • Mining front advances down-dip, under engineered backfill. NYSE: HL This information is confidential; it is not to be relied on by any 3rd party without prior written consent. RESPONSIBLE. SAFE. INNOVATIVE. l 17
UCB MINING METHOD
Same stopes, two weeks later

   • Dilution is controlled by bolting the ribs as mining advances along strike and down dip.
   • High degree of mechanization and reduced seismic delays improve productivity.

NYSE: HL               This information is confidential; it is not to be relied on by any 3rd party without prior written consent.   RESPONSIBLE. SAFE. INNOVATIVE. l 18
LUCKY FRIDAY ON TRACK TO BE 5 Moz PER YEAR PRODUCER
Higher grades at depth are supported by success of UCB mining method

                                                                         30 Vein - *AgEq Grade (opt)
           20 Years
           Past Mining
                                                                                         < 10
                                                                                         10 - 20
                                                            Almost                       20 - 30
                6500 Level                                                               30 - 35
                                                            1000 feet
                                                                                         > 35
                                                            @ +35
                                                                                     Oct. 12, 2020
                                                            AgEq
                                                                            *Ag Equivalent Values Based on
                     7500 Level                                             metal prices of $16.50/oz
                                                                            Ag, $0.85/lb Pb, and $1.00/lb Zn
                                                                            ** Cutoff grade 11 AgEq
                                                                            *** 2020 average grade 25 AgEq

                                  #4 Shaft           1000 Feet
                                                     Looking North
NYSE: HL                                                                RESPONSIBLE. SAFE. INNOVATIVE. l 19
CASA BERARDI: STRONG PRODUCTION PERFORMANCE IN 2021
Production optimization focus delivered results, 16% increase in gold reserves
• Mill achieved record throughput at 4,187 tpd; Mill
recoveries +4%
• 2021: 134.5 Koz gold produced
• Cost of sales $230 million
• Cash costs per gold oz, after by-product credits,
$1,125
• AISC per gold oz, after by-product credits, $1,399
• Gold reserves at 1.8 Moz, 14-year reserve plan
Mill Throughput and Gold Production Free Cash Flow(2)
$101 million in free cash flow generation from 2019-2021
Cash Flow
$51.5 $85.0 $73.8
1.6 140
1.5 from
134.4
Operations:
47.2
1.5
($ millions)
135
1.4
1.4 134.5 130
33.7
1.3
1.3 125
1.2 120
19.7
121.5
1.1 115
1.0 110
2019 2020 2021 2019 2020 2021
Throughput (Million tons) Gold Produced (Koz)
NYSE: HL * Cash Cost and AISC per gold ounce, after by-product credits, are non-GAAP measures, reconciliations of which to GAAP are shown in appendix. RESPONSIBLE. SAFE. INNOVATIVE. l 20CASA BERARDI: FOCUSED ON LONG-TERM OPERATIONAL IMPROVEMENT
Investments are yielding results
Mill performance is consistent with >approximately 90%
availability
~10% increase in UG active time, leading to improved
productivity
Reduced UG maintenance backlog by 2.5 weeks, translates to
higher equipment availability
Launched training for UG operators to improve pre/post-op
(equipment reliability)
Increased operator accountability to decrease operator driven
downtime
Working on implementing reduction in Support Costs
Open Pits and Explosives RFP process well underway paves
way to reduced external spend
NYSE: HL RESPONSIBLE. SAFE. INNOVATIVE. l 21LUCKY FRIDAY TECHNICAL REPORT HIGHLIGHTS
Positioned for long-term value with strong free cash flow generation in the next decade
Technical Report S-K 1300 Highlights
Mine life, based on reserve plan years 17
Ore Tons Processed ktons 5,456
Silver Grade opt 13.7
Silver Recovery % 96.4
Total Silver Produced Koz 72,003
Silver Produced – 10 Year Avg. Koz 5,055
(2022-2031)
Financial Highlights (Silver $21/oz, Lead $0.95/lb. Zinc $1.25/lb.)
Reserves & Resources, as of 12/31/2021
Total Operating Costs $/ton milled $188
Tons Silver Silver Lead Zinc
(000) Grade (000 oz) (tons) (Tons) Total Capex $ mm $372
(opt)
Reserves 5,456 13.7 74,699 452,440 181,020 Free Cash Flow – 10 Year Avg. $ mm $58
Measured & 10,493 7.6 79,762 518,240 257,600 NPV0%, after-tax $ mm $779
Indicated
Inferred 5,377 7.8 41,872 311,850 126,600 NPV5%, after-tax $ mm $554
NYSE: HL RESPONSIBLE. SAFE. INNOVATIVE. l 22GREENS CREEK S-K 1300 TECHNICAL REPORT HIGHLIGHTS
Tier 1 asset that will maintain production and solid free cash flow generation profile
Technical Report S-K 1300 Highlights*
Mine life, based on reserve plan years 14
Ore Tons Processed ktons 12,700
Silver Grade** opt 11.3
Silver Recovery** % 76.5
Total Silver Produced Koz 110,200
Total Gold Produced Koz 800
Financial Highlights (Silver $21/oz, Gold $1650/oz, Lead
$0.95/lb. Zinc $1.25/lb.)*
Reserves & Resources, as of 12/31/2021
Total Operating Costs** $/ton milled $194.7
Tons Silver Silver Gold Lead Zinc
(000) Grade (000 oz) (000 oz) (tons) (Tons) Cash Flow from Operations $ mm $1,730
(opt)
Reserves 11,076 11.3 125,219 946 282,250 725,920 Total Capex $ mm $330
Measured 8,355 12.8 106,670 836 250,040 701,520 NPV0%, after-tax $ mm $1,400
& Indicated
Inferred 2,152 12.8 27,508 164 60,140 146,020 NPV5%, after-tax $ mm $1,000
* Production and financial highlights from Section 21 of the S-K 1300 technical report, unless otherwise mentioned
NYSE: HL ** Grade and recovery data from section 19 of the S-K 1300 technical report RESPONSIBLE. SAFE. INNOVATIVE. l 23CASA BERARDI S-K 1300 TECHNICAL REPORT HIGHLIGHTS
Solid asset with consistent free cash flow generation
Technical Report S-K 1300 Highlights*
Mine life, based on reserve plan years 14
Ore Milled Mtonnes 20.9
Gold Grade – Open pit** g/t 2.61
Gold Grade – Underground** g/t 5.27
Gold Recovery** % 83.5
Total Gold Produced Koz 1,725
Financial Highlights (Gold $1650/oz)*
Reserves & Resources, as of 12/31/2021 Total Operating Costs $/tonne $69
milled
Tons Gold Gold
(000) Grade (000 oz)
Total Capex $ mm $400
(opt)
Free Cash Flow – 10 Year Avg. $ mm $39
Reserves 20,752 0.09 1,784
Measured & Indicated 7,248 0.13 1,054
NPV0%, after-tax $ mm $950
Inferred 10,125 0.79 791 NPV5%, after-tax $ mm $600
* Production and financial highlights from Section 21 of the S-K 1300 technical report, unless otherwise mentioned
NYSE: HL ** Grade and recovery data from section 19 of the S-K 1300 technical report RESPONSIBLE. SAFE. INNOVATIVE. l 24HECLA IS THE LEADER IN METAL PRODUCED PER TONNE OF GHG
High-grade, low tonnage silver mines generate more benefit with smaller footprint
Silver Equivalent Ounce per Tonne of GHG Emissions Gold Equivalent Ounce per Tonne of GHG Emissions
473
5.5
177 166 158
139 2.1 1.9 1.9
1.6
Hecla Coeur Pan American First Majestic Newmont Hecla Coeur Pan American First Majestic* Newmont*
Silver Silver
*Newmont and First Majestic based on 2019 GHG reported
Source: 2020 Company filings
NYSE: HL RESPONSIBLE. SAFE. INNOVATIVE. l 25COMPARISON TO PEERS – RESERVES AND ORE GRADES
Hecla has highest reserve grade and third largest reserve base
Reserves & Reserve Grade
AgEq Reserves (mmoz) AgEq Reserve Grade (g/t)
1,297 587
1,138
441
430
376 369
354
516 511
147
130 291
158 158
133
36 103 104 83
Fresnillo Pan American Hecla Coeur Fortuna Silvercorp First Majestic Gatos Silver Hochschild Endeavour Silver
Source: TD Securities
NYSE: HL RESPONSIBLE. SAFE. INNOVATIVE. l 26ESG: ENVIRONMENTAL INTENSITY MEASURES 2020
Hecla’s “Small footprint, large benefit” illustrated within industry peer group KPI’s
GHG Intensity
Water Intensity
(tonnes GHG/US$M
(H20 M3/US$ M Sales)
Sales)
HECLA MINING CO 109
YAMANA GOLD INC 2,978
YAMANA GOLD INC 115
COEUR MINING INC 9,759
AGNICO EAGLE MINES 184
HECLA MINING CO 11,885
ELDORADO GOLD CORP 210
FORTUNA SILVER
13,168
MINES INC
NEW GOLD INC 235
AGNICO EAGLE MINES 13,797
FORTUNA SILVER MINES
254
ENDEAVOUR SILVER INC
23,049
CORP
NEWMONT CORP 281
IAMGOLD CORP 32,478
PAN AMERICAN SILVER
286
CORP
Median 32,926
Median 286
SILVERCORP METALS
33,373
INC
SILVERCORP METALS INC 338
ELDORADO GOLD
36,768
CORP
ENDEAVOUR SILVER
351
CORP
NEWMONT CORP 38,961
COEUR MINING INC 368
SSR MINING INC 45,712
KINROSS GOLD 387
NEW GOLD INC 46,839
IAMGOLD CORP 391
KINROSS GOLD 82,967
SSR MINING INC 541
PAN AMERICAN
132,495 329,327
SILVER CORP
BARRICK GOLD 584
BARRICK GOLD
Source - Bloomberg
NYSE: HL RESPONSIBLE. SAFE. INNOVATIVE. l 27SILVER RESERVE GRADE COMPARISON
Hecla’s reserves are stable and high grade
16 Silver Reserve
Grade (opt)
Hecla
14
12
First Majestic
10
Fortuna
8
Pan American
6
4
Coeur
2
Fresnillo
0
2002 2004 2006 2008 2010 2012 2014 2016 2018 2020
Source: Bloomberg
NYSE: HL RESPONSIBLE. SAFE. INNOVATIVE. l 28SILVER RESERVES (contained ounces of silver)
Hecla’s silver reserves continue to increase while world reserves react to current metal prices
4.00
World 3.3 Billion
3.50
3.00
Silver Price $20.60 /oz
2.50 Hecla 188 Million
World in Billions
of Ounces 2.00 Hecla in 100Ms
Silver $35.12/oz
1.50
World 1.7 Billion
1.00
Silver $6.66/oz Hecla 150 Million
0.50
Hecla 45 Million
World 439 Million
-
2004 2005 2006 2007 2008 2009 2010 2011 2012 2013 2014 2015 2016 2017 2018 2019 2020
World Reserves Hecla Reserves
Source: Bloomberg
NYSE: HL RESPONSIBLE. SAFE. INNOVATIVE. l 29HECLA’S TAX CHARACTERISTICS ARE NOT RECOGNIZED
Tax expense and paid taxes amongst the lowest and an unrecognized tax asset
Current Tax Expense: Hecla & Peers
2018-2020
($ millions)
Fresnillo Pan American Silver Coeur Hecla SSR Mining First Majestic Silver Fortuna Silver
(7) (8) (5) (7) (8) (18) (10) (16) (2) (10)
(25) (33) (34) (23) (25)
(45) (39) (33) (31) (34)
(54)
(81)
(98) (92)
(121)
(149) (146)
(168)
2020 Current (Provision) Benefit 2019 Current (Provision) Benefit 2018 Current (Provision) Benefit 3 Year Average Current (Provision) Benefit
• Hecla has a $759 million tax loss carryforward to reduce future U.S. taxable income
• $53 million in Canada
• U.S. tax incentives for U.S. mines
• Depletion deductions
• Research and development credits
• Mine safety training credits
• Accelerated depreciation
NYSE: HL RESPONSIBLE. SAFE. INNOVATIVE. l 30LEADING DIVIDEND POLICY IS IMPROVED FURTHER
More cash returned to shareholders as dividend yield increases synchronously with silver prices
• Industry’s only silver-linked dividend policy that pays an annual normal dividend ($0.015 per share) plus a
silver price-linked dividend that commences at $20/oz silver price.
$9.0 At $25/oz realized price, an implied dividend yield of 8.0% of silver price 20.00%
$8.0 16.4% 18.00%
14.6% 16.00%
$7.0
12.2% 14.00%
$6.0
12.00%
$5.0 9.2%
8.0% 10.00%
$4.0
8.00%
$3.0 4.4% 6.00%
$2.0 4.00%
$1.0 2.00%
$0.6 $1.0 $2.2 $3.0 $4.6 $6.2 $7.8
$0.0 0.00%A VERY SHORT HISTORY ON SILVER DEMAND
Despite declining photography demand, silver industrial and investment demand has been in a
secular bull market since 2000 and is stronger in 2021 and the future
Five distinct periods of silver demand, three that are strengthening
• Monetary by governments (2000 BC to 1800 AD)
• Photographic (1900 to 1999)
• Industrial (1940 - )
• Investment (2000 - )
• Energy (2010 - )
20 YEAR CHANGE IN DEMAND
Million Ounces
1999 2020 % Increase
If the decrease in
Industrial 343 487 42% photographic demand is
removed, silver demand
Photography 246 28 -89% increases 441 million
Jewelery/Silverware 260 181 -31% ounces or 61%
Investment 26 532 1,946%
Total 875 1,033 18%
Source – World Silver Survey 2021
NYSE: HL RESPONSIBLE. SAFE. INNOVATIVE. l 32RENEWABLE ENERGY GAINS MOMENTUM – SOLAR PROJECTED
FOR THE LARGEST GROWTH
Global policies are favoring renewable energy
• In the U.S., renewable energy projected to double from 21% in 2020 to 42% by 2050
• Solar energy generation as a percentage of renewable energy forecast to increase 3x by 2050 from 16%
to 47%
U.S. Electricity Generation* U.S. Renewable Electricity Generation*
Annual Economic Outlook 2021, Reference Case Annual Economic Outlook 2021, Reference Case
* Source – U.S. Energy Information Administration (EIA), Annual Energy Outlook 2021 narrative, February 2021.
NYSE: HL RESPONSIBLE. SAFE. INNOVATIVE. l 33SILVER – WIDENING GAP BETWEEN SUPPLY & DEMAND
Gap expected to increase even if industrial demand growth is only 2%
• 2019 saw a total supply of 1,023 Moz and total demand of 1,074 Moz
• Silver’s total demand in 2030 is expected to reach ~1,147 Moz if demand stays on the last
decade trend and no increase due to additional solar or investment demand
• Supply needs to grow by ~70 Moz per year by 2030 with only 2% demand growth
Silver Supply & Demand: 2019 and 2030E 1,147
Million Ounces
Supply shortfall of 50 Moz in
2019 was filled by above 1,074
ground stocks
1,023
Total Supply Total Demand Demand Expected, Based on 10 Year Growth
2019 2019 Rate
2030F*
* Demand assumptions: CAGR for industrial demand over the past 10 years has been 2.0%. Assume no increase or decrease in investment, jewelry or silverware demand.
NYSE: HL RESPONSIBLE. SAFE. INNOVATIVE. l 34WHY INVEST IN HECLA?
The largest U.S. silver producer with the largest U.S. reserve base with high margin
best in class silver assets
We mine:
• Silver is the right metal for a renewable
The Right energy future
Metals • Produce 40% of silver mined in the U.S.
• Have the largest U.S. silver reserve base
• Mines located in the right geographical
addresses with low risk
In the Right
Jurisdictions • For investment attractiveness, Hecla operates
in 3 of the top 10 regions globally: Alaska 5,
Quebec 6, Idaho 9*
• Long-lived mines with decades ahead of us
With the Right
• Mines have the highest reserve grades, long
Mines mine lives and are low cost
* Source: Fraser Institute Survey 2020
NYSE: HL RESPONSIBLE. SAFE. INNOVATIVE. l 35Guidance NYSE: HL RESPONSIBLE. SAFE. INNOVATIVE. l 36
GUIDANCE: GROWING SILVER & GOLD PRODUCTION
High silver margins projected despite COVID-19 and inflation costs

                                                                         Silver Production       Gold Production          Silver Equivalent
     Consolidated Production Outlook*                                          (Moz)                  (Koz)                     (Moz)8
                                                                                                                                                   Gold Equivalent (Koz)8

       2022 Total                                                           12.9 – 13.5              165 - 175                39.3 – 40.7                 509 – 527

       2023 Total                                                           13.5 – 14.5              175 - 185                40.7 – 42.5                 527 – 550

       2024 Total                                                           14.5 – 15.1              185 - 195                42.5 – 43.8                 550 – 567
     * Production and cost outlook by mine available in the appendix

                                                                       Costs of Sales and other direct
                                                                                                          Cash cost, after by-product        AISC, after by-product credits,
                                                                        production (“Cost of Sales”)
     2022 Consolidated Cost Outlook*                                                                     credits, per silver/gold ounce5    per produced silver/gold ounce4
                                                                                  (million)7

      Total Silver                                                                  $345                          $0.75 - $2.50                      $9.75 - $11.75

      Total Gold                                                                    $210                         $1,175- $1,325                     $1,450 - $1,600
     * Production and cost outlook by mine available in the appendix

     2022E Capital and Exploration Outlook
     (in millions)
     Capital expenditures                                                                 $135
     Exploration & Pre-development expenditures                                            $45

NYSE: HL                                                                                                                                     RESPONSIBLE. SAFE. INNOVATIVE. l 37
Financial NYSE: HL RESPONSIBLE. SAFE. INNOVATIVE. l 38
2021 REVENUE, PRODUCTION AND COST HIGHLIGHTS
Largest silver producer, #3 lead and zinc producer in the U.S.

                                                                                             Silver          Gold          Lead          Zinc                         Silver Production: 12.9 Moz
                                                                                                                                                                      Cost of Sales(3): $314 M
                                                                                                                                                                      Cash Costs, after by-product credits(6): $1.37/oz
                                                                                                                                                                      AISC, after by-product credits(4): $9.19/oz
                                                                                                             15%                                                      Realized Price: $25.24/oz

                                                                                                                                   34%                                Gold Production: 201 Koz
                          2021 Margins(2)                                                             9%                                                              Cost of Sales: $278.8 M
                      Silver Margin: $16.05/oz                                                                                                                        Cash Costs, after by-product credits(6): $1,127/oz
                       Gold Margin: $422/oz                                                                                                                           AISC, after by-product credits(4): $1,374/oz
                                                                                                                                                                      Realized Price: $1,796/oz

                                                                                                                                                                      Lead Production: 43 Ktons
                                                                                                                                                                      Realized Price: $1.03/lb
                                                                                                                 42%
                                                                                                                                                                      Zinc Production: 63.6 Ktons
                                                                                                                                                                      Realized Price: $1.44/lb

                                   Greens Creek                                                                  Lucky Friday                                                                 Casa Berardi

                                                                                                                 13%
                                25%

                                                    50%
                             8%                                                                            30%                   57%

                                  17%                                                                                                                                                              100%

                              48% of Total Revenue                                                         16% of Total Revenue                                                           30% of Total Revenue
          * Cash Costs after by-product credits, AISC after by-product credits and Margins are non-GAAP measures. Reconciliation to GAAP is provided in the appendix. Silver Margin for 2021 is
          calculated as Realized Silver Price of $25.24/oz less AISC, after by-product credits of $9.19/oz. Gold Margin for 2021 is calculated as Realized Gold Price of $1,796/oz less AISC, after
NYSE:   HLby-product credits of $1,374/oz.           .                                                                                                                                            RESPONSIBLE.   SAFE. INNOVATIVE. l 39
Q4 REVENUE, PRODUCTION 2021 AND COST HIGHLIGHTS
Largest silver producer, #3 lead and zinc producer in the U.S.
Silver Production: 3.2 Moz
Cost of Sales(3): $72.7 M
Cash Cost, after by-product credits(6): $1.69/oz
18% AISC, after by-product credits(4): $10.08oz
31% Realized Price: $23.49/oz
Gold Production: 48.0 Koz
10% Cost of Sales(3): $59.2 M
Q4 2021 Margins(2) Cash Cost, after by-product credits(6): $1,143/oz
Silver Margin: $13.41/oz AISC, after by-product credits(4): $1,494/oz
Gold Margin: $308/oz Realized Price: $1,802/oz
Lead Production: 10.7 Ktons
41% Realized Price: $1.13/lb
Zinc Production: 14.8 Ktons
Silver Gold Lead Zinc Realized Price: $1.74/lb
Greens Creek Casa Berardi Lucky Friday Nevada
Nevada
14% 2%
32%
100%
43%
55%
32%
8%
16% 100% 98%
47% of Hecla Revenue 32% of Hecla Revenue 18% of Hecla Revenue 2% of Hecla Revenue
* Cash Costs after by-product credits, AISC after by-product credits and Margins are non-GAAP measures. Reconciliation to GAAP is provided in the appendix. Silver Margin for
Q4/2021 is calculated as Realized Silver Price of $23.97/oz less AISC, after by-product credits of $12.82/oz. Gold Margin for Q4/2021 is calculated as Realized Gold Price of $1,792/oz
NYSE: HL .
less AISC, after by-product credits of $1,1450/oz. RESPONSIBLE. SAFE. INNOVATIVE. l 40GENERATING SUBSTANTIAL MARGINS
Continue to remain a very low-cost silver producer
Silver Margins(3) Gold Margins(3)
17%
27% 22% 19%
26%
41% 72%
72%
47%
57%
Cost of Sales (000s)7 AISC, After By-Product Credits, per Ag-Au/Oz4
Q4 2020 Q1 2021 Q2 2021 Q3 2021 Q4 2021 2022 Outlook Q4 2020 Q1 2021 Q2 2021 Q3 2021 Q4 2021 2022 Outlook
Silver $85,967 $76,069 $83,390 $78,784 $72,655 $345,000 Silver $15.35 $7.21 $7.54 $12.82 $10.08 $9.75 - $11.75
Gold $56,159 $69,971 $75,333 $79,549 $59,182 $210,000 Gold $1,330 $1,284 $1,419 $1,450 $1,494 $1,450 - $1,600
*Cost of sales and AISC, after by-product credits, are non-GAAP measures, please refer to appendix for reconciliation to GAAP.
NYSE: HL RESPONSIBLE. SAFE. INNOVATIVE. l 41Silver Market NYSE: HL RESPONSIBLE. SAFE. INNOVATIVE. l 42
U.S. CURRENT ELECTRICITY CONSUMPTION TRENDS
Solar is projected to be the largest beneficiary, currently accounts for 1.3% of total U.S. energy
consumption

NYSE: HL                                                                            RESPONSIBLE. SAFE. INNOVATIVE. l 43
TRILLIONS OF GOVERNMENT SPENDING AND GROWING
Current programs are three times greater than the 2008-9 programs
     $1.0 trillion           $550bn: new funding for transportation, utilities & broadband; $110 bn: roads, bridges and major
     Infrastructure          projects, $66 bn: passenger & freight rail, $39 bn: public transit
     bill:
     $1.9 trillion           $350bn: Aid to state & local governments, $225 bn: stimulus checks, $130 bn: school funding,
     Stimulus bill:          Additional jobless benefits, Vaccine tracing and testing, Health insurance subsidies

                Source: Morgan Stanley Research US economics team
NYSE: HL                                                                                                            RESPONSIBLE. SAFE. INNOVATIVE. l 44
SIGNIFICANT MONETARY GROWTH COMPARED TO 1970s
M2 money supply is highly correlated with inflation
US M2 year over year % change, Q1/1960 – 07/2021
Source: Reuters Eikon, Incrementum AG
NYSE: HL RESPONSIBLE. SAFE. INNOVATIVE. l 45GOLD MARKETS SINCE NIXON CLOSED THE GOLD WINDOW
Last Bull market driven by the Dot.com bust, 9/11 and Global Financial Crisis
Gold Bull and Bear Markets 01/1971-09/2021
Source: Reuters Eikon, Incrementum AG
NYSE: HL RESPONSIBLE. SAFE. INNOVATIVE. l 460
100
200
300
400
500
600
12/1/2001
NYSE: HL
3/1/2002
6/1/2002
9/1/2002
12/1/2002
3/1/2003
6/1/2003
Source: Bloomberg
9/1/2003
12/1/2003
3/1/2004
6/1/2004
9/1/2004
12/1/2004
3/1/2005
REPLAYING THE PAST
6/1/2005
9/1/2005
12/1/2005
• 1/1/2000 to 3/31/2004 – 50% appreciation
3/1/2006
6/1/2006
9/1/2006
12/1/2006
• 1/1/2009 to 3/31/2011 – 230% for Silver, 62% for gold
3/1/2007
Silver
6/1/2007
9/1/2007
12/1/2007
Gold
3/1/2008
Two major periods of monetary and fiscal stimulus – 2001 and 2008
Very strong silver and gold performance from 2000 to 2011
6/1/2008
9/1/2008
12/1/2008
3/1/2009
Percentage Increase In Gold and Silver
6/1/2009
9/1/2009
12/1/2009
3/1/2010
6/1/2010
9/1/2010
12/1/2010
3/1/2011
6/1/2011
9/1/2011
12/1/2011
3/1/2012
6/1/2012
9/1/2012
12/1/2012
RESPONSIBLE. SAFE. INNOVATIVE. l 47GOLD AND SILVER LINKED THROUGHOUT HISTORY
Highest known ratio in last 300 years, close in 1941
120
100
80
60 2020: G/S ratio = 108
~ 3x above average
40 ~ 5x above median
20
0
1718 1738 1758 1778 1798 1818 1838 1858 1878 1898 1918 1938 1958 1978 1998 2018
Gold/Silver ratio Average Median
Source: Nick Laird, goldchartsrus.com, Incrementum AG
NYSE: HL World Bank, Wheaton Precious Metals RESPONSIBLE. SAFE. INNOVATIVE. l 48RISING INFLATION IS NEGATIVE FOR MOST ASSET CLASSES
Gold and mining shares are among the best performers in inflation regimes
Compound annual growth rates of different asset classes in different inflation regimes
Source: Wellington Asset Management, Incrementum AG
NYSE: HL RESPONSIBLE. SAFE. INNOVATIVE. l 49SILVER SUPPLY COMES FROM MINE PRODUCTION & RECYCLING
Significant disruptions occurred in mine supply in 2020
Mine production accounts for 80-85% of total silver supply
• 2019 saw lower mine production due to grade declines and temporary mine suspensions due to community action
• Greater challenges occurred in 2020 due to COVID-19 that resulted in disruptions in production.
million ounces
1057.8 1032.1 1016.7 1021.3 976.2 1056.2
Net Hedging Supply
Recycling
Mine Production
NYSE: HL Source: Bloomberg, Metals Focus RESPONSIBLE. SAFE. INNOVATIVE. l 50SILVER MINE SUPPLY DEPENDENT ON OTHER METALS
Over half of supply is a by-product of copper, lead and zinc mines
100%
90%
80%
70%
60%
50%
40%
30%
20%
31% 32% 32% 30% 30% 31% 31%
26% 28% 29% 27% 27% 28%
10% 23% 22% 23%
0%
2005 2006 2007 2008 2009 2010 2011 2012 2013 2014 2015 2016 2017 2018 2019 2020e
Silver Zinc & Lead Copper Gold Polymetallic, Other
Source: The Silver Institute, Incrementum AG
NYSE: HL RESPONSIBLE. SAFE. INNOVATIVE. l 51SILVER MINE SUPPLY HAS JURISDICTION RISK
50% from four countries – 4% from the U.S.
Troy Ounces mn
Source: The Silver Institute, Incrementum AG
NYSE: HL RESPONSIBLE. SAFE. INNOVATIVE. l 52SILVER DEMAND HAS THREE MAIN COMPONENTS
Green energy demand is new and growing
Silver Demand Consumer Products/Industrial
Other
64.3 Moz
13%
Investment
267.8 Moz
25%
Photovoltaics
98.7 Moz
Consumer Products/ 19%
Electronics
Industrial* 297.6 Moz
544.6 Moz 58%
Jewelry & 51%
Silverware
261.1 Moz Brazing Alloys
24% 50.3 Moz
10%
* Industrial demand includes photography
demand Source: World Silver Survey 2020
NYSE: HL Source: Bloomberg, Metals Focus RESPONSIBLE. SAFE. INNOVATIVE. l 53AMERICA NEEDS TO PRODUCE THE METALS AT HOME If Copper is the “new oil” - Silver is like the spark • Biden Administration’s Build Back Better counts on a shorter supply chain • The metals Hecla produces are the foundation of a low carbon future • Silver, copper, and other metals are essential for wind, solar, batteries, and electric vehicles • Hecla is the largest U.S. silver producer and owns the world’s third largest undeveloped copper deposit NYSE: HL RESPONSIBLE. SAFE. INNOVATIVE. l 54
Appendix

NYSE: HL              RESPONSIBLE. SAFE. INNOVATIVE. l 55
ENDNOTES

 1. Net debt to adjusted EBITDA is a non-GAAP measurement, a reconciliation of adjusted EBITDA and net debt to the closest GAAP measurements of net income (loss) and debt can be
    found in the appendix. It is an important measure for management to measure relative indebtedness and the ability to service the debt relative to its peers. It is calculated as total debt
    outstanding less total cash on hand divided by adjusted EBITDA.
 2. Free cash flow is a non-GAAP measure and is calculated as cash flow from operations less additions to property, plant and equipment. Reconciliation to GAAP is shown in the
    appendix.
 3. Realized silver margin is a non-GAAP measure and is calculated as realized market price of silver less AISC.
 4. All-in sustaining cost (AISC), after by-product credits, is a non-GAAP measurement, a reconciliation of which to cost of sales and other direct production costs and depreciation,
    depletion and amortization, the closest GAAP measurement, can be found in the appendix. AISC, after by-product credits, includes cost of sales and other direct production costs,
    expenses for reclamation and exploration, and sustaining capital costs at the mine sites. AISC, after by-product credits, for our consolidated silver properties also includes corporate
    costs for all general and administrative expenses, exploration and sustaining capital which support the operating properties. AISC, after by-product credits, is calculated net of
    depreciation, depletion, and amortization and by-product credits. Current GAAP measures used in the mining industry, such as cost of goods sold, do not capture all the expenditures
    incurred to discover, develop and sustain silver and gold production. Management believes that all in sustaining costs is a non-GAAP measure that provides additional information to
    management, investors and analysts to help in the understanding of the economics of our operations and performance compared to other producers and in the investor's visibility by
    better defining the total costs associated with production. Similarly, the statistic is useful in identifying acquisition and investment opportunities as it provides a common tool for
    measuring the financial performance of other mines with varying geologic, metallurgical and operating characteristics. In addition, the Company may use it when formulating
    performance goals and targets under its incentive program.
 5. Cash cost, after by-product credits, per silver and gold ounce represents a non-GAAP measurement, a reconciliation of which to cost of sales and other direct production costs and
    depreciation, depletion and amortization (sometimes referred to as "cost of sales" in this release), can be found in the Appendix. It is an important operating statistic that management
    utilizes to measure each mine's operating performance. It also allows the benchmarking of performance of each mine versus those of our competitors. As a primary U.S. silver mining
    company, management also uses the statistic on an aggregate basis - aggregating the Greens Creek, Lucky Friday and San Sebastian mines - to compare performance with that of
    other primary silver mining companies. With regard to Casa Berardi and Nevada Operations, management uses cash cost, after by- product credits, per gold ounce to compare its
    performance with other gold mines. Similarly, the statistic is useful in identifying acquisition and investment opportunities as it provides a common tool for measuring the financial
    performance of other mines with varying geologic, metallurgical and operating characteristics. In addition, the Company may use it when formulating performance goals and targets
    under its incentive program.
 6. Silver and gold equivalent (include zinc and lead production) is calculated using the average market prices for the time period noted.
 7. Cost of sales and other direct production costs and depreciation, depletion and amortization.
 8. 2022E refers to Hecla’s estimates for 2022. Calculations for 2022 include silver, gold, lead and zinc production from Greens Creek, Lucky Friday and Casa Berardi Operations
    converted using $1,700 gold, $22 silver, $1.00 lead, and $1.50 zinc.

NYSE: HL                                                                                                                                                        RESPONSIBLE. SAFE. INNOVATIVE. l 56
ESG NYSE: HL RESPONSIBLE. SAFE. INNOVATIVE. l 57
ESG: SMALL FOOTPRINT, LARGE BENEFIT
Environment, Community and Safety are three pillars of our ESG program

                                                                                                   Small Environment
                        Safety                                                                                                                                                        Large Community Benefit
                                                                                                       Footprint

 • Well-established safety culture                                                     • Net neutral on emissions in 2021*                                                           • Support >2,300 families
 • Casa Berardi awarded the John T. Ryan                                               • Global footprint 40% of U.S. silver and is the largest U.S. silver producer with the largest U.S. silver reserve base
  •   Our Montana assets are the third largest undeveloped copper deposit in the world, host >2.5 billion pounds of copper and >300 million
      ounces of silver in inferred resources
            * On scope 1 & 2 emissions, and through the purchase of carbon offset credits.
            **Peers for comparison include Coeur Mining, Pan American Silver, First Majestic Silver and Newmont.
NYSE: HL    ***John T. Ryan award is a CIM (Canadian Institute of Mining, Metallurgy, and Petroleum) award, lowest reportable injury frequency rate in the Quebec/Maritime region.                   RESPONSIBLE. SAFE. INNOVATIVE. l 58
HECLA IS AMONG THE SAFEST OF MINING COMPANIES
Hecla’s commitment and NMA CORESafety started in 2012, moved from underperformance to
industry leader
• Reduced AIFR by 24%, the lowest in
company history ALL INJURY FREQUENCY RATE
(AIFR)
• Reduced AIFR by 76% since 2012 6.06
5.35
• Hecla 1.22 rate in 2020 nearly 50% better 5.41 76% reduction
since SHMS
than national average of 2.40 4.57
inception
3.42
• Aggressive health and safety protocols
even before COVID-19 was deemed a 2.76
2.00
pandemic 1.61
1.22 1.45
• Have more than a 90+% vaccination rate
at Greens Creek
2012 2013 2014 2015 2016 2017 2018 2019 2020 2021
NYSE: HL RESPONSIBLE. SAFE. INNOVATIVE. l 59GREEN HOUSE GAS INTENSITY
Hecla’s Scope 1 and 2 emissions are among the lowest in the industry
Hecla produced 157 silver ounces per tonne of GHG, 473 silver-equivalent ounces
per tonne of GHG, or 6.8 gold equivalent ounces per tonne of GHG
Source: BMO Capital Markets
NYSE: HL RESPONSIBLE. SAFE. INNOVATIVE. l 60HECLA PROVIDES OVERSIZED BENEFITS
Contributions to our world, country, communities and employees
• Metals America needs
• Silver, copper, zinc, lead, gold
• Embrace families
• Good paying jobs and “uncommon” benefits
• Multi-generations work for the company
• Active community partner
• Develop innovations
• Dry-stack tailings
• New technology that makes workers safe, more
productive
• Support communities
• Taxes, economic impact, social engagement
• First Nations/Native Americans
• Hecla Charitable Foundation
• Protect the environment
NYSE: HL RESPONSIBLE. SAFE. INNOVATIVE. l 61HECLA CHANGES LIVES
Largest employer with jobs and benefits that last a lifetime and an
active participant in the local communities
• Direct economic impact of $550+ million annually in 3 small
communities
• More than a living wage – longevity, benefits
• Each Hecla job creates more jobs - 3,000+
• Support for communities during COVID-19:
• $150,000 of food, personal protective equipment, supplies, and
financial assistance
• $150,000 worth of “Hecla Bucks” for Hecla employees use at local
businesses
• Hecla Charitable Foundation has provided $3+ million to area
non-profits
• First Nation/Native Americans are key beneficiaries
NYSE: HL RESPONSIBLE. SAFE. INNOVATIVE. l 62INNOVATION THAT IMPROVES MINES AND SOCIETY Led the way in dry-stack tailings development, tier IV engines improved air quality for all, and better, safer jobs • Pioneered dry-stack tailings management at Greens Creek is industry “best practice” today 2 • Hecla established an internal tailings standard in 2014 and continues to improve our management systems • Engines developed for underground mines have made air quality better for all • Remote and automated machines put workers out of harms way and eliminate repetitive work NYSE: HL RESPONSIBLE. SAFE. INNOVATIVE. l 63
ENVIRONMENTAL STEWARDSHIP FROM BEGINNING TO END
Troy tailings reclamation considered “gold standard” in Montana

• Troy Tailings Storage Facility reclamation
  completed (300 acres). Nearly $8 million in
                                                                                           2017
  financial assurance released by the state
      • More than 200,000 shrubs and trees planted at
        Troy; land returned to productive wildlife habitat
      • Native plant collection and planting in partnership
        with Kootenai-Salish Tribes
      • Reclamation and biodiversity efforts can also help
        sequester carbon
• Backfilling the San Sebastian pits
• Closure of older Lucky Friday tailings dams
                                                              2020

NYSE: HL                                                             RESPONSIBLE. SAFE. INNOVATIVE. l 64
Operations/Exploration/Pre-development NYSE: HL RESPONSIBLE. SAFE. INNOVATIVE. l 65
OPERATIONAL REVIEW
Continued performance despite COVID-19 challenges

NYSE: HL                                            RESPONSIBLE. SAFE. INNOVATIVE. l 66
DIVERSE ASSET PORTFOLIO IN MINING FRIENDLY JURISDICTIONS
Low cost, high margin, low tonnage assets in stable and best jurisdictions

                                                                                                           Fundamental Operations
                                               Greens Creek                                                   Casa Berardi                                                  Lucky Friday

  Location/Fraser Ranking1                       5 - Alaska, USA                                             6 - Quebec, Canada                                                9 - Idaho, USA
      Primary Product                                   Silver                                                        Gold                                                            Silver
      2021 % Revenue
                                                        48 %                                                          30%                                                             16 %
        Contribution
     2021 2P Reserves                            125.2 Moz silver                                                1.9 Moz gold                                                  74.7 Moz silver
      2021 Production                       9.2Moz Ag / 46.1Koz Au                                       134.5Koz Au / 33.6Koz Ag                                                 3.6Moz Ag
   2021 Cash provided by
                                                      $201.4 M                                                      $83.3 M                                                         $62.6 M
    operating activities2
                           3
     2021 Cost of Sales                               $213.1 M                                                     $194.4 M                                                         $97.5 M
      2021 Cash Cost4                             $(0.65) / oz Ag                                               $1,125 / oz Au                                                  $6.60 / oz Ag
        2021 AISC4                                 $3.19 / oz Ag                                                $1,399 / oz Au                                                 $14.34 / oz Ag
   2021 Sustaining Capex                              $27.6 M                                                       $34.4 M                                                         $26.5 M
           2021 FCF4                                  $184.8 M                                                      $33.7 M                                                         $32.7 M
       Start-Up Year                                    1989                                                          1989                                                            1942
    Mine Life at Start-up                              7 years                                                      6 years                                                         2 years
  Remaining Reserve Life                              14 years                                                      14 years                                                       17 years

                                                                                                                                                                        Underhand Closed Bench mining
                                            Hecla’s flagship mine: ~$1bn in                               Doubled tonnage for economies
                                                                                                                                                                      method with high grades at depth sets
                                            cumulative free cash flow over                                    of scale with open pit
                                                                                                                                                                     the mine up as a flagship assets for the
                                                      last 10 years                                        supplementing underground
                                                                                                                                                                               next two decades

             ¹ Location ranking based on Fraser Institute Annual Survey of Mining 2020 Report (77 companies ranked - Lower is Better).
             3 Cost of sales and other direct production costs and depreciation, depletion and amortization.
NYSE: HL     4 Cash Costs and AISC, after by-product credits, per produced silver/gold ounce. AISC and FCF are non-GAAP measures; please refer to appendix for reconciliation to GAAP.      RESPONSIBLE. SAFE. INNOVATIVE. l 67
You can also read