Climate Impacts on Washington's Hydropower, Water Supply, Forests, Fish, and Agriculture
←
→
Page content transcription
If your browser does not render page correctly, please read the page content below
Climate Impacts on Washington’s Hydropower, Water Supply, Forests, Fish, and Agriculture

    Climate Impacts on
Washington’s Hydropower,
Water Supply, Forests, Fish,
      and Agriculture

                                                            A report by

        Joseph H. Casola, Jennifer E. Kay, Amy K. Snover,
               Robert A. Norheim, Lara C. Whitely Binder,
                           and the Climate Impacts Group

                       Center for Science in the Earth System
  Joint Institute for the Study of the Atmosphere and Ocean
                                      University of Washington

                                                        October 2005

                                                                                       Page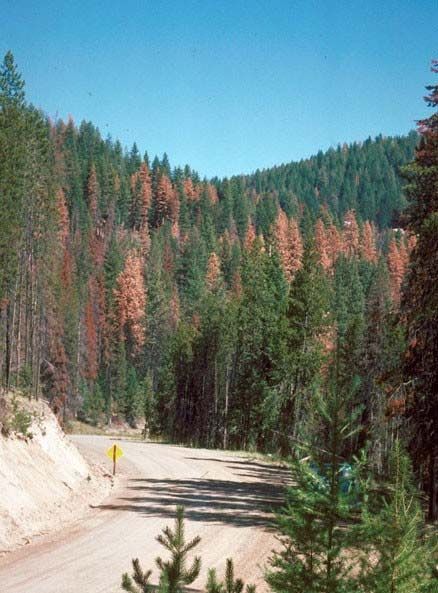
Climate Impacts on Washington’s Hydropower, Water Supply, Forests, Fish, and Agriculture

   This document was prepared at the request of King County (Washington) for the October 27, 2005 conference “The Future
   Ain’t What It Used to Be: Planning for Climate Disruption” in Seattle, Washington. Information on that meeting is available at
   http://dnr.metrokc.gov/dnrp/climate-change/conference-2005.htm and http://www.cses.washington.edu/cig/outreach/
   workshops.shtml. For electronic copies of this document, visit http://www.cses.washington.edu/db/pubs/abstract459.shtml.

   The Climate Impacts Group periodically updates its scenarios of Pacific Northwest climate change and climate impacts as
   warranted by developments in global climate models and improvements in regional modeling capabilities. For the most current
   scenarios, see http://www.cses.washington.edu/cig.pnwc/cc.shtml.

   Cite as:
    Casola, J.H., J.E. Kay, A.K. Snover, R.A. Norheim, L. C. Whitely Binder and the Climate Impacts Group. 2005. Climate
   Impacts on Washington’s Hydropower, Water Supply, Forests, Fish, and Agriculture. A report prepared for King County
   (Washington) by the Climate Impacts Group (Center for Science in the Earth System, Joint Institute for the Study of the
   Atmosphere and Ocean, University of Washington, Seattle).

   Cover photo credits: Stream in the Olympic Peninsula (Climate Impacts Group); North Cascades Mountains (Climate Impacts Group); Wheat fields in the Palouse
   (Climate Impacts Group); Turbines inside powerhouse at The Dalles dam (Bob Heims, U.S. Army Corps of Engineers); Moss covered trees in the Hoh Rain Forest
   (Climate Impacts Group); Bull Run watershed (Tualatin Water District)

Page 2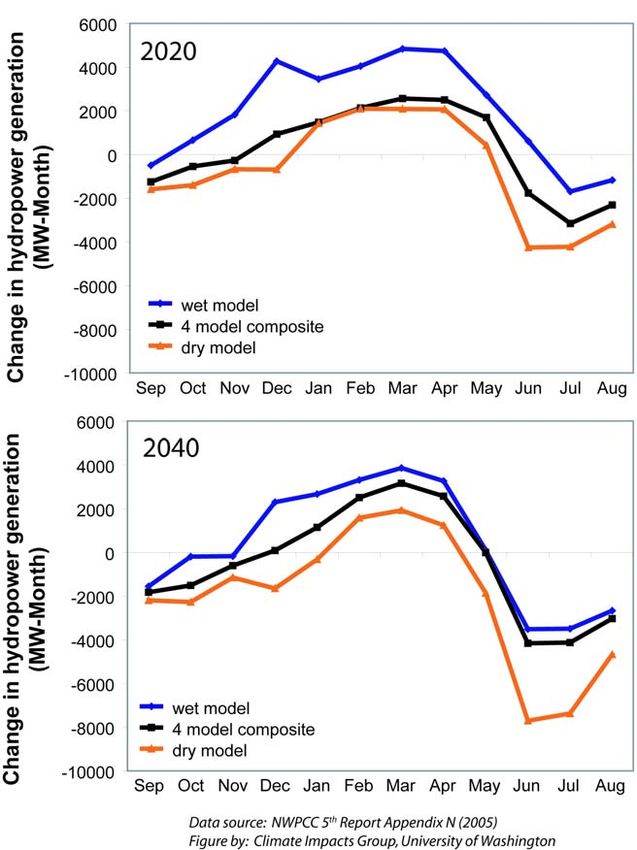
Climate Impacts on Washington’s Hydropower, Water Supply, Forests, Fish, and Agriculture

Table of Contents

Table of Contents
Figures and Table

Executive Summary ........................................................................................................ 5
Introduction ..................................................................................................................... 7
Global Climate Change ................................................................................................... 7
Washington and Climate Change .................................................................................. 10
          Future Temperature Changes ...................................................................................................... 10
          Future Precipitation Changes ...................................................................................................... 11
          Updated 2005 Climate Change Scenarios (BOX) ....................................................................... 12

Impacts on Washington’s Hydrology ........................................................................... 14
     Snowpack ................................................................................................................................... 14
     Skiing in the Pacific Northwest (BOX) ....................................................................................... 16
     Streamflow .................................................................................................................................. 17
     Stream Temperatures................................................................................................................... 20
     Soil Moisture ............................................................................................................................... 20
     Implications of 2005 Climate Change Scenarios for Hydrologic Impacts (BOX) ...................... 22

Impacts on Hydropower ................................................................................................. 24
     Water Resource Management (BOX).......................................................................................... 27

Impacts on Municipal and Industrial Water Supplies .................................................. 29

Impacts on Flood and Stormwater Management.......................................................... 32

Impacts on Forests ......................................................................................................... 33

Impacts on Fish ............................................................................................................... 35

          Pacific Northwest Salmon (BOX) ............................................................................................... 35

Impacts on Agriculture ................................................................................................... 39

          Yakima River Basin Agriculture (BOX) ..................................................................................... 40

Changes Beyond the 2040s............................................................................................ 42

                                                                                                                                                        Page 3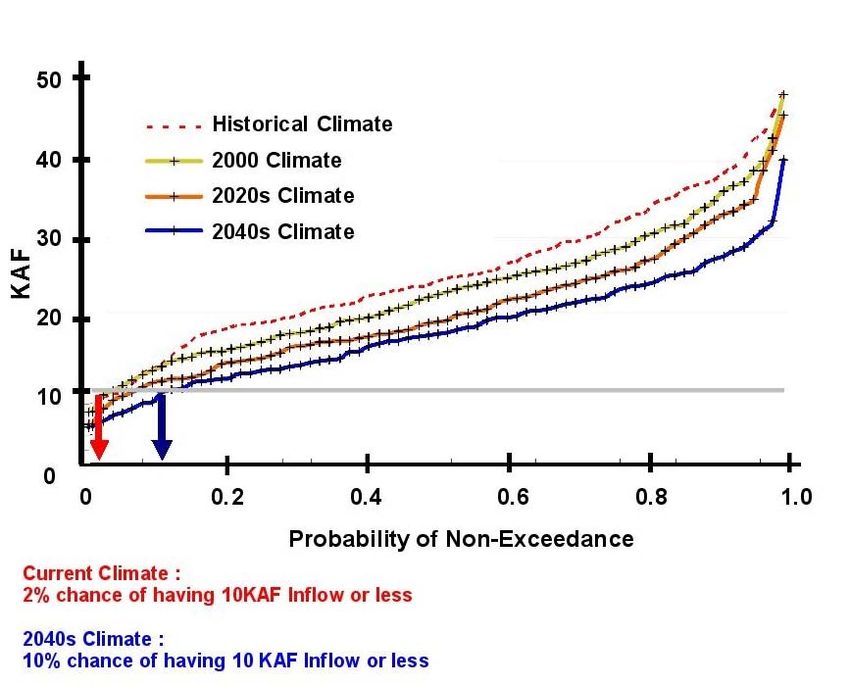
Climate Impacts on Washington’s Hydropower, Water Supply, Forests, Fish, and Agriculture
Figures and Table
Figures
Figure 1. Accumulation of greenhouse gases in the atmosphere increases global mean surface
air temperatures ..................................................................................................................................7
Figure 2. Projected changes in monthly temperature and precipitation in the PNW for the 2020s
and 2040s (in degrees F and percent). ................................................................................................10
Figure 3. Comparison of historical year-to-year variations in temperature and precipitation with
projected shifts in average temperature and precipitation ..................................................................11
Figure 4. Comparison of projected changes in temperature for the Pacific Northwest for the
2005 and 2001 scenarios ....................................................................................................................12
Figure 5. Changes in April 1 Snow Water Equivalent in the western United States. ........................................14
Figure 6. Spring snowpack (inches of snow water equivalent) in the Pacific Northwest for the
20th century, the 2020s, and the 2040s...............................................................................................15
Figure 7. Projected changes in ski conditions at Snoqualmie Pass, Stevens Pass, and Mission
Ridge for the 2020s and 2040s. ..........................................................................................................16
Figure 8. Typical seasonal streamflow patterns for a rain-dominant, snow-dominant, and
transient watershed .............................................................................................................................17
Figure 9(a). Winter precipitation sensitivity to warming and projected streamflow changes in the
Pacific Northwest................................................................................................................................18
Figure 9(b). Winter precipitation sensitivity and projected changes in monthly streamflow for
selected Washington State river basins. .............................................................................................19
Figure 10. Warming trend in Fraser River average summer stream temperatures, 1953-1998............................20
Figure 11. Historical and projected incidence of stream temperatures harmful to salmon spawning
on the Fraser River watershed. ...........................................................................................................20
Figure 12. Projected changes in spring and summer soil moisture for the 2020s and 2040s...............................21
Figure 13. Residential and commercial per capita electricity consumption (kWh) and monthly
average air temperature.......................................................................................................................24
Figure 14. Projected 2040 monthly temperature increases (degrees F) and the estimated impact
on electricity demand (Megawatt-months) .........................................................................................25
Figure 15. Projected climate impacts on hydroelectricity generation for the 2020s and the 2040s. ....................25
Figure 16. Columbia River Basin reliability by sector for current and future climate.........................................27
Figure 17. Historical, current, and projected reservoir inflows for Seattle’s water supply..................................29
Figure 18. Historical, current, and projected probability of achieving combined June-September
reservoir inflow levels for Seattle's water supply (in thousand acre-feet) ..........................................30
Figure 19. Factors controlling Portland's (Oregon) projected future water supply ..............................................30
Figure 20. Evidence of beetle destruction near Granite Creek, Washington. ......................................................34
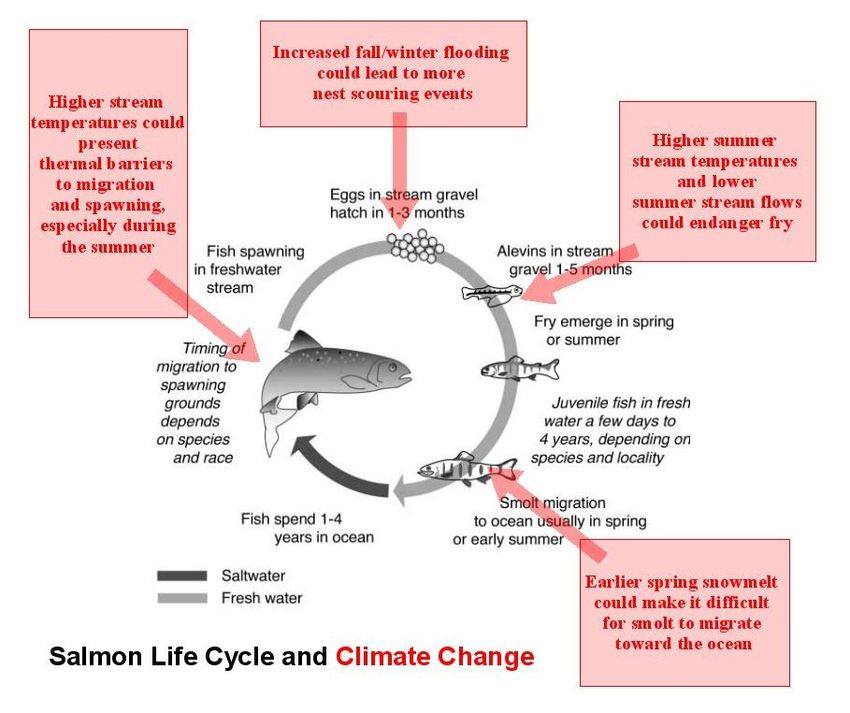
Figure 21. Salmon life cycle and climate change.................................................................................................36
Figure 22. Recent and projected average August surface air temperature in the Columbia Basin ......................37
Figure 23. Current and projected probability of prorationing irrigation water for junior rights
holders in the Yakima River Valley....................................................................................................40
Table
Table 1. Examples of greenhouse gas lifetimes................................................................................................8
Page 4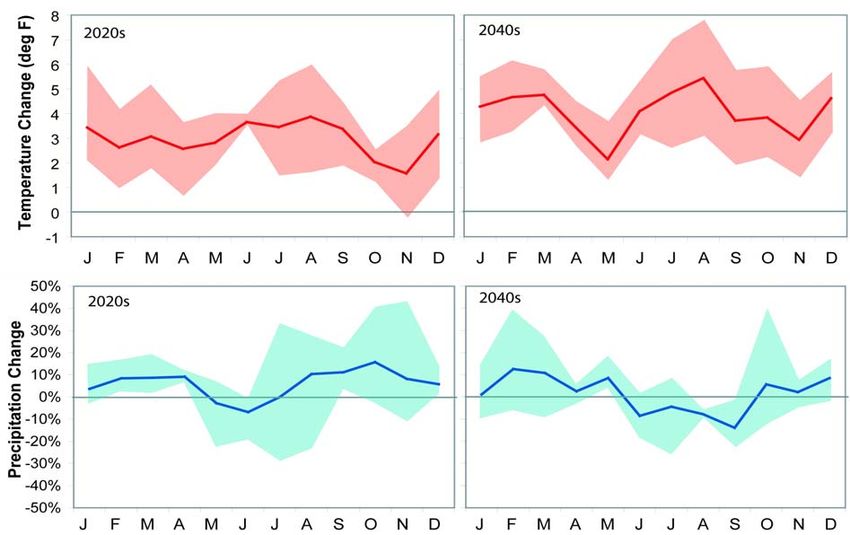
Climate Impacts on Washington’s Hydropower, Water Supply, Forests, Fish, and Agriculture

Executive Summary

The climate is changing. Human activities,                     shifts in the amount and
especially those related to fossil fuel combustion,            timing of streamflow will
have and will continue to change the composition of            likely reduce winter
the atmosphere. Consequently, climate conditions in            electricity demands and
Washington during the 21st century will likely be              increase winter electricity
different than those experienced in the past.                  generation. Conversely,
                                                               summer demands are likely to
•   All climate models project that temperatures will          increase overall while
    increase during the 21st century. The projected            summer generation is likely
                                                                                                  Melting snow at Mt. Rainier
    increases exceed the year to year variability in           to decrease. Any changes in        (Climate Impacts Group)

    temperature experienced during the 20th century            annual hydropower generation are highly dependent
    and occur across all seasons.                              on future changes in winter precipitation, and will
                                                               probably be determined by the characteristics of
•   Many climate models project a slight increase in           future wet or dry cycles, the timing and intensity of
    precipitation, especially during the fall and winter       which remain uncertain.
    months during the 21st century. However, natural
    year-to-year and decade-to-decade fluctuations in          Municipal and Industrial Water Supplies
    precipitation are likely to be more noticeable than        Increasing temperatures and decreased summer flows
    longer term trends associated with climate                 could make it more difficult for water suppliers to
    change. Washington will probably continue to               meet the needs of consumers and in-stream flow
    experience distinct periods, perhaps decades long,         requirements, especially in snowmelt-fed watersheds.
    of relatively wet and relatively dry conditions.
                                                               Flood and Stormwater Management
Washington's economy and natural                               Increasing temperatures and small increases in winter
resources are sensitive to changes in climate.                 precipitation could lead to increases in the frequency
Management of hydroelectric power production,                  of flooding in some river basins. It is unclear how
water supply systems, flood and storm management,              urban stormwater flooding may change in the future,
forests, fisheries, and agriculture is predicated on           as modeling the behavior of individual storms, and
observed patterns and extremes in temperature and              their potential response to global warming, is
precipitation. Each of these sectors has adapted to the        currently beyond the capabilities of global climate
timing and length of the seasons, the range of                 models.
temperatures, and the amount and frequency of
precipitation that has been experienced in the past. As        Forests
temperature increases and precipitation patterns               In response to increasing temperatures, some tree
potentially change during the 21st century, current            species will shift their geographic range, migrating to
management practices may not achieve the results for           higher elevations and latitudes. Other species may be
which they are designed.                                       unable to adapt and their numbers will decline.
                                                               Increasing temperatures will likely create favorable
Hydroelectric Power Production                                 conditions for fire and pest outbreaks, which could
Increasing temperatures, decreases in snowpack, and            become more frequent and severe.

                                                                                                                       Page 5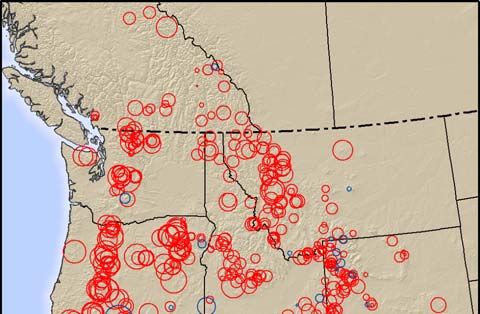
Climate Impacts on Washington’s Hydropower, Water Supply, Forests, Fish, and Agriculture

                                                               altered environment. In the Columbia River basin, for
                                                               example, primacy for water management is currently
                                                               reserved for flood control and hydroelectric power
                                                               generation. In the future, integrated management
                                                               decisions that incorporate trade-offs between hydroe-
      Sockeye salmon (Climate Impacts Group)
                                                               lectric power interests and other sectors such as in-
                                                               stream flow augmentation will be required if those
Fisheries                                                      sectors' water needs are to be reliably met.
Increasing stream and lake temperatures along with
changes in the volume and timing of streamflow                 Planning should begin now. Although the
could create environmental conditions that are                 climate changes occurring through the mid 21st are
inhospitable to many Pacific Northwest cold water              largely unavoidable, the ultimate consequences of
fish populations. Salmon, which represent some of              those changes will depend strongly on today's
the region’s most important fish species, are at               decisions for preparation and adaptation. Further-
particular risk.                                               more, adaptation will take time, and planning and
                                                               adaptation needs to begin well before (and in many
Agriculture                                                    instances several decades before) the impacts are
Increasing temperatures and atmospheric carbon                 expected to occur.
dioxide concentrations will likely increase crop yields
in places where sufficient soil moisture or irrigation         Today's choices will shape tomorrow's
water is available. However, in areas where soil mois-         impacts. Not only will our choices about preparing
ture is projected to decrease, crops could suffer more         for climate change determine Washington's resilience
days of heat and moisture stress. The shifts in the            to future climate change, but choices we make today
timing of peak streamflow could reduce the availabil-          and into the future will help determine the total
ity of irrigation water during the summer when it is           amount of change the global climate system will
needed the most. The increasing temperatures may               undergo. The rate of population growth, the type and
also enhance threats posed by crop pests and                   amount of energy use, the development and spread of
pathogens.                                                     technology, and the rate and reach of globalization
                                                               will all affect the rate at which greenhouse gases are
Climate impacts on water resources are                         emitted in the future and the rate at which the climate
integral to each sector. The most important                    changes.
climate impact pathway for hydroelectric power
production, water supply systems, flood and
stormwater management, forests, fisheries, and
agriculture involve changes in the timing and
availability of water. The hydrologic changes will
likely be most detrimental and acute during the
summer, as water is projected to be less available, in
many cases exacerbating existing conflicts over
limited resources. Climate change will force resource
managers and planners to evaluate complex tradeoffs
between different management objectives and to
                                                                           Sunset, Puget Sound (Climate Impacts
adapt their systems to meet these objectives in an                         Group)

Page 6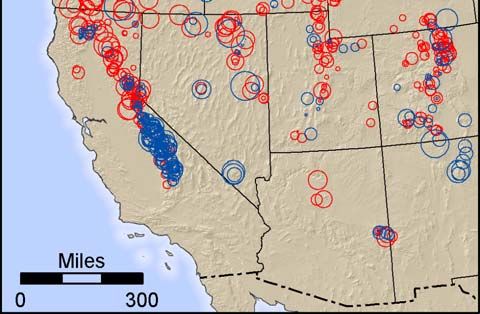
Climate Impacts on Washington’s Hydropower, Water Supply, Forests, Fish, and Agriculture

Introduction
This booklet provides information on human-caused climate change (“global warming”) and how it will affect
Washington's natural resources, commerce, and industries. We focus on the anticipated climate changes taking
place by the 2020s and 2040s and how they will impact hydroelectric power production, municipal water
resources, flooding and stormwater management, agriculture, forests, and fisheries. This material is in-
tended to assist natural resource managers, policy planners, and other decision makers in identifying which of
their activities are sensitive and potentially vulnerable to climate change. The overarching message is that the
climate of the future is not likely to resemble the climate of the past, and planning for possible future
climates should begin now.

Global Climate Change

Human-induced climate change (“global warming”)
                                                                                            3.
refers to the alteration of earth's energy balance
resulting from the accumulation of greenhouse gases
in the atmosphere. These gases, which include carbon
                                                              1.
dioxide (CO2), methane (CH4), and nitrous oxide
(N2O), act like a heat-trapping blanket that prevents
the energy leaving the earth's surface from escaping
to space and causes globally averaged temperatures to
rise (Figure 1). This trapped energy can also cause
potentially significant changes in the timing and                                                  2.
length of the seasons as well as the amount and
frequency of precipitation.
                                                              Figure 1. Accumulation of greenhouse gases in the
                                                              atmosphere increases global mean surface air
Because of human activities, atmospheric CO2                  temperatures. The figure illustrates how greenhouse gases
concentrations are currently higher than any other            can prevent infrared radiation from escaping to space, acting
                                                              like a blanket and warming the lower atmosphere. Figure
time in the past 400,000 years and are likely to be           source IPCC (2001)4
higher than any time in the past 20 million years.1
Fossil fuel burning is the primary source of
anthropogenic (human caused) CO2 emissions,                   While the atmospheric burden of greenhouse gases
accounting for three-quarters of today’s emissions.           has grown, globally averaged surface temperature has
The remainder of the CO2 comes predominantly from             increased by 1.0 ± 0.4°F (0.6 ± 0.2°C) during the 20th
land use changes such as deforestation.2 Atmospheric          century.5 This warming represents the largest increase
concentrations of methane and nitrous oxide have              in temperature of any century in at least the last 1,000
also increased significantly. Methane’s concentration         years.6 The warming has been uneven in time and
has increased 151% since 1750, also exceeding any             space: nighttime temperatures have increased more
measurement for the last 400,000 years. Nitrous               than daytime temperatures, more warming has
oxide’s concentration has increased 17% since 1750,           occurred at mid- and high latitudes than in the tropics,
exceeding any level in at least the last 1,000 years.3        and more warming has occurred in the Northern

                                                                                                                     Page 7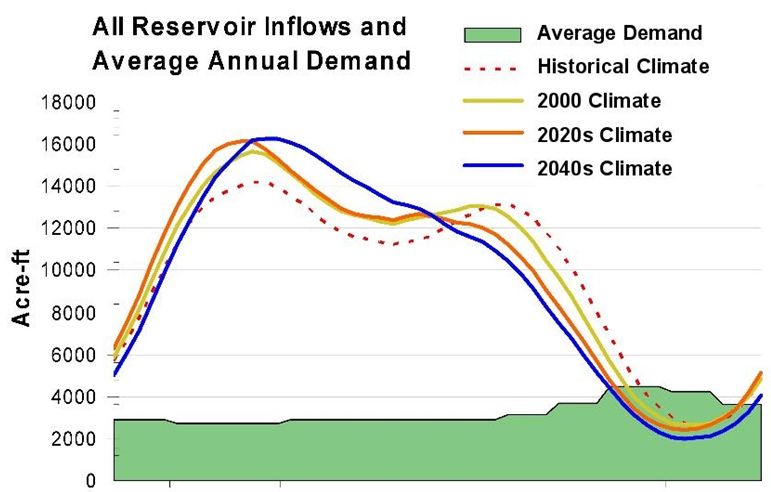
Climate Impacts on Washington’s Hydropower, Water Supply, Forests, Fish, and Agriculture

Hemisphere than in the Southern Hemisphere. As a                The international climate policy community has
result, the earth’s physical systems have changed:              developed a suite of scenarios that make different
glaciers have retreated; sea-ice has been reduced in            assumptions about these social, political, and
thickness and extent; snow cover has decreased; and             economic factors for the 21st century. The scenarios
sea-level has risen, caused by both the expansion of            represent possible global futures, and there are no
warmer ocean water and the addition of water from               assigned probabilities to the scenarios' likelihood of
melting ice sheets.7 All of these temperature trends8           taking place (i.e., three is not a “most likely”
and impacts are consistent with and provide evidence            scenario). The scenarios' atmospheric concentrations
for the human-induced greenhouse gas warming.                   for CO2 range between 540 and 970 parts per million
Although some of the past century’s warming may be              (ppm)11 by 2100, representing at least a doubling
due to natural causes, most of the warming occurring            from pre-industrial CO2 concentrations (280ppm).
between 1950 and 2000 can be attributed to
greenhouse gases from human activities.9                        The magnitude of climate impacts for the 21st century
                                                                varies by scenario. However, the scenarios do
Given the prevalence and necessity of fossil fuel               converge for many aspects of the climate:
combustion and the atmospheric persistence of
greenhouse gases (Table 1), atmospheric greenhouse              •   The 21st century will likely be warmer. The
gas concentrations will likely continue increasing                  projected increase in global average temperature
through the 21st century and with that, global                      by 2100, relative to 1990, ranges from 2.5 to 10°
temperatures.                                                       F (1.4 to 5.8°C).12 Loss of sea-ice and snow
                                                                    cover will likely continue along with increases in
Precise projections of future greenhouse gas                        sea level.
concentrations are highly uncertain; changes in
emission patterns are dependent upon many factors               •   The frequency of extreme warm events and
such as population growth, energy use, the spread of                intense precipitation events are projected to
technology, and the rate and reach of globalization.                increase. The interiors of many continents are
                                                                    projected to experience drier conditions,
                                                                    especially during the summers.
Gas                                       Lifetime
Carbon Dioxide (CO2)                   5 to 200 years           All of these changes will impact hydrological
                                                                systems, ecosystems, agriculture, and human societies
Methane (CH4)                              12 years             around the world.13 Like the changes in climate
Nitrous Oxide (N2O)                       114 years             observed over the last century, we can expect 21st
                                                                century climate change to manifest itself differently at
Sulfur Hexafluoride (SF6)                3,200 years
                                                                different times and in different places around the
Carbon Tetrafluoride (CF4)              50,000 years            world. And since each part of the world has a unique
                                                                set of environmental characteristics, key ecosystems,
Table 1: Examples of greenhouse gas lifetimes. The table
shows some of the important greenhouse gases discussed in the   and patterns of dependence on natural resources, we
text along with two synthetic gases (SF6 and CF4) that have     can expect the impacts of those climate changes to
long lifetimes. Lifetimes refer to the average amount of time
an emitted gas will spend in the atmosphere before being        differ significantly from place to place.
chemically broken down, absorbed into the ocean or otherwise
removed from the atmosphere. For CO2, a single value cannot
be assigned since there are many removal processes that occur
                                                                To understand how a specific region, such as
at a range of speeds. Table source: IPCC (2001a)10              Washington State, will be affected by climate change,
                                                                we must examine the potential consequences of

Page 8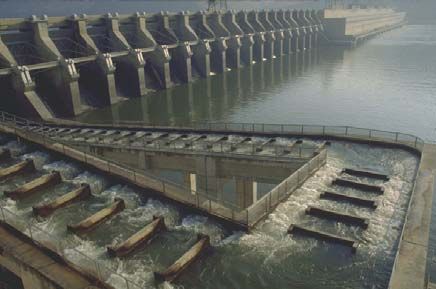
Climate Impacts on Washington’s Hydropower, Water Supply, Forests, Fish, and Agriculture

                                                                    12
projected changes within the specific context of that                    IPCC (2001a), Executive Summary

place. The following sections provide an overview of                13
                                                                       (IPCC) Intergovernmental Panel on Climate Change
projected climate change impacts on Washington                      (2001b), J.J. McCarthy, O.S. Canziani, N.A. Leary, D.J.
state, paying particular attention to the important                 Dokken, and K.S. White (Eds.), Climate Change 2001:
resources, ecosystems and climate sensitivities of this             Impacts, Adaptation, and Vulnerability: Contribution of
                                                                    Working Group II to the Third Assessment Report of the
region.
                                                                    Intergovernmental Panel on Climate Change (IPCC),
                                                                    Cambridge University Press, Cambridge, Summary for
                                                                    Policymakers. Available for download at http://www.grida.no/
References and Endnotes                                             climate/ipcc_tar/. Reference specifically from the Executive
1                                                                   Summary.
  (IPCC) Intergovernmental Panel on Climate Change (2001a),
J. T. Houghton, Y. Ding, D.J. Griggs, M. Noguer, P. J. van der
Linden and D. Xiaosu (Eds.), Climate Change 2001: The
Scientific Basis: Contribution of Working Group I to the Third
Assessment Report of the Intergovernmental Panel on Climate
Change (IPCC), Cambridge University Press, Cambridge.
Available for download at http://www.grida.no/climate/
ipcc_tar/. Reference specifically from the Executive Summary.

2
 IPCC (2001a), Chapter 3, “The Carbon Cycle and
Atmospheric Carbon Dioxide”

3
    IPCC (2001a), Executive Summary

4
    IPCC (2001a), Chapter 1, Figure 1.2

5
    IPCC (2001a), Executive Summary

6
    IPCC (2001a), Executive Summary

7
 More information regarding temperature trends and observed
changes in the earth's physical systems can be found IPCC
(2001a).

8
  Nighttime temperature, temperature over land (which is
found disproportionately in the Northern Hemisphere), and
temperature at higher latitudes where ice is present are more
sensitive to greenhouse gas forcing than daytime temperature,
temperatures over the ocean, and temperatures at lower, ice-
free latitudes. These temperature trends act as important
indicators of human-induced climate change.

9
 IPCC (2001a), Executive Summary; also, National
Academies of Science (2001), Climate Change Science: An
Analysis of Some Key Questions, Committee on the Science of
Climate Change, Division on Earth and Life Studies, National
Research Council, National Academy Press, Washington, D.C.

10
  Table information taken from IPCC (2001a), Technical
Summary Table 1 and Table 6.7.

11
     IPCC (2001a), Executive Summary

                                                                                                                         Page 9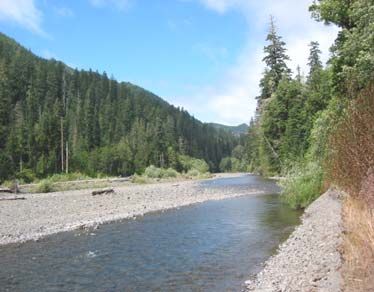
Climate Impacts on Washington’s Hydropower, Water Supply, Forests, Fish, and Agriculture

Washington and Climate Change

        ashington has already experienced changes in                  Future Temperature Changes
W       climate during the 20th century that are
consistent with human-caused global climate change.                   Given expected increases in greenhouse gas
The average temperature in the Pacific Northwest                      concentrations, many of these changes are projected
(PNW) increased approximately 1.5°F (0.8°C) over                      to continue. Perhaps most importantly, temperature is
the last century;1 snowpack has been declining over                   expected to continue to rise. Washington is likely to
the last 80 years, especially at lower elevations;2 the               face an increase in temperatures across all seasons.
onset of snow melt and peak streamflows in snow-fed                   Projections derived from global climate models5
rivers has moved earlier in the year; and many species                indicate that PNW average annual temperatures will
of plants are blooming earlier in the year.3 Although                 likely increase 2.5 to 3.7˚F (1.4 to 2.1˚C) by the
direct observations are not available, hydrologic                     2020s (Figure 2). For the 2040s the increase is
models indicate that spring soil moisture has also                    projected to be between 3.1 and 5.3˚F (1.7 to 2.9˚C).6
been increasing.4                                                     These increases are much larger than the average

    Figure 2. Projected changes in monthly temperature and precipitation in the Pacific Northwest for the 2020s and
    2040s (in degrees F and percent). The red lines in the upper panels show the average change in temperature derived from
    four global climate models for the PNW for the 2020s and 2040s. The shaded regions represent the range of the models.
    Although there are differences among the model projections, all show increases in average temperature, regardless of the
    season. The blue lines and shaded regions show the average precipitation changes and ranges for the same models. The
    majority of the model projections call for wetter cool seasons (October-March) than the historical average. For the warm
    season (April-September), some models are relatively wet while others are relatively dry. The changes have been calculated
    relative to the 1990s.

Page 10
Climate Impacts on Washington’s Hydropower, Water Supply, Forests, Fish, and Agriculture
expected to fall as rain instead of snow. The models
are divided as to whether the warm season (April-
September) will be wetter or drier; however, any
changes will be small given how little rain the region
currently receives during the summer.
Overall, the projected precipitation changes will
likely not be as drastic as the increases in
temperature, relative to historic variability (Figure 3).
Thus, natural year-to-year and decade-to-decade
fluctuations in precipitation are likely to be more
Figure 3. Comparison of historical year-to-year
variations in temperature and precipitation with
noticeable than longer term trends associated with
projected shifts in average temperature and climate change. In other words, the projections for a
precipitation. The blue bars represent the year-to-year
systematically wetter winter climate do not imply that
variability in PNW temperature and precipitation during the
20th century. The orange and brown lines indicate the shift all years or decades will be wetter than average.
in average temperature and precipitation from four climate Washington will probably continue to experience
models for the 2020s and 2040s, respectively. Average
temperature is projected to increase beyond the year-to-year distinct periods, perhaps decades long,
variability observed during the 20th century, while future distinguished alternatively by relatively wet and
projected precipitation falls within the range of past
variability. relatively dry conditions.
In contrast to the historical record of temperature,
increase experienced by the PNW over the last which shows steady warming over most of the 20th
century (Figure 3). century, the historical record for precipitation shows a
variety of trends. While there is a robust increase in
Future Precipitation Changes warm season precipitation across the West from 1916
Global climate models also provide a glimpse at to 2003, the cool season has displayed relatively wet
Washington’s future precipitation; however, this view and relatively dry periods. Precipitation statistics
is much less clear. Some models project increases in derived from Columbia River flow records indicate
precipitation while others forecast decreases. The decreasing cool season precipitation from the late
divergence in model projections results from the fact 1800s to the present. However, direct observations for
that precipitation is affected by complex, large-scale the 1916-2003 period show a slight increase in cool
atmospheric circulation changes that are influenced season precipitation, largely a result of extensive
by many imperfectly understood processes (e.g., drought in the early portion of the record during the
ocean currents, tropical circulation, interactions 1930s and 1940s. Most recently, the 1947-2003
between vegetation and the atmosphere).7 Thus, period shows a drying trend in cool season
projections for precipitation are more uncertain than precipitation.
for temperature.
These observations underscore the challenge of
Despite this limitation, the majority of models drawing conclusions about long-term precipitation
project a wetter future, with most of the trends. They also suggest that further study is needed
precipitation increases occurring in the cool season to determine the different atmospheric processes that
(October-March) (Figure 2).8 Consistent with control cool and warm season precipitation in the
projected increases in temperature, a larger West on long time scales (decades to centuries). The
percentage of winter precipitation in the PNW is degree to which any of the cool or warm season
Page 11Climate Impacts on Washington’s Hydropower, Water Supply, Forests, Fish, and Agriculture
Updated 2005 Climate Change Scenarios
Modeling the earth’s climate system and projecting future climate change continue to be very active areas of
research. Global climate models continue to evolve as additional scientific information and increased
computing power becomes available. Researchers continue to develop future socioeconomic scenarios, each
resulting in different scenarios for future greenhouse gas emissions. Methods for downscaling global climate
change projections to the regional scale continue to be improved.
In preparation for the Fourth Assessment by the Intergovernmental Panel on Climate Change (due out in 2007),
modeling centers around the world have prepared new simulations of future climate change, using updated
global climate models and greenhouse gas emission scenarios. The Climate Impacts Group has acquired and
downscaled this output to the Pacific Northwest using recently developed downscaling techniques.
The new projections for PNW climate change (“2005 scenarios”) show smaller temperature increases (Figure
4). The 2005 scenarios also show slightly drier conditions for the 2020s and similar precipitation changes for
the 2040s compared to the climate change scenarios described in this paper. These differences are primarily due
to the examination of a much larger set of global climate models and a new and improved standardization
method (for establishing the baseline to which future changes are compared). The new baseline for all model
projections is the 1970-2000 mean climate.9
The implication of cooler 2005 scenarios is that temperature increases will occur a decade or more later in the
century than previously projected. As a result, climate impacts that depend on these temperature changes (such
as reductions in snowpack (Figure 6) would occur later in the century than projected here. Climate impact
projections that relied on a relatively cool model, such as the potential for increased stream temperature and
salmon stress shown in Figure 22, may not shift later in the year. For details about how the 2005 climate
change scenarios would affect the hydrologic results described in this paper, please see Implication of 2005
Climate Change Scenarios for Hydrologic Impacts Box.10
Figure 4. Comparison of
projected changes in temperature
for the Pacific Northwest for the
2005 and 2001 scenarios. The
smooth black line shows the
average temperature projections for
ten climate models that use the
2005 scenarios. The red shading
indicates the range of the models’
temperature projections. The black
line connecting plus signs (labeled
“Old scenarios” represents the
average and range for 2020s and
2040s temperature projections from
four climate models using the 2001
scenarios. The projections made
using the 2005 scenarios are cooler
than the projections made using the
2001 scenarios, implying that many
impacts may happen later in the
21st century than discussed in this
report.
Page 12Climate Impacts on Washington’s Hydropower, Water Supply, Forests, Fish, and Agriculture
precipitation trends are a result of last century’s increases, with the PCM representing the “coolest” model.
warming, or how the trends might be affected by 6
Mote, P.W., A.F. Hamlet, and R. Leung (2005a), Possible
future warming, remains uncertain. The model Future Climate, Chapter 5 in A. K. Snover, E.L. Miles, and
projections for small increases in future precipitation, The Climate Impacts Group, Rhythms of Change: An
on the order of a few percent of the long-term Integrated Assessment of Climate Impacts on the Pacific
Northwest, Cambridge, Massachusetts: MIT Press. (in review)
precipitation average, should be understood as
secondary to the larger, natural, decadal and 7
Precipitation projections represent an average of projections
multidecadal precipitation trends. from the ECHAM4, PCM, HadCM2, and HadCM3 global
climate models. The HadCM2 model is relatively wet, while
the ECHAM4 is relatively dry.
References and Endnotes 8
For more information about future precipitation projections,
1
Mote, P.W. (2003), Trends in Temperature and Precipitation see Mote et al. (2005a), “Possible Future Climate”
in the Pacific Northwest During the Twentieth Century, 9
For more information about these models, evaluation of their
Northwest Science, 77(4): 271-282.
skill at simulating PNW 20th century climate, and their
2
Hamlet, A.F., P.W. Mote, M.P. Clark, and D.P. Lettenmaier projections for 21st century PNW climate, see Mote, P. M., E.
(2005), Effects of Temperature and Precipitation Variability on Salathé and C. Peacock. (2005b), Scenarios of future climate
Snowpack Trends in the Western U.S., Journal of Climate (in for the Pacific Northwest, Report prepared for King County
review); also, Mote, P.W., A.F. Hamlet, M.P. Clark, and D.P. (Washington) by the Climate Impacts Group (Center for
Lettenmaier (2005), Declining Mountain Snowpack in Western Science in the Earth System, Joint Institute for the Study of the
North America, Bulletin of the American Meteorological Atmosphere and Ocean, University of Washington, Seattle).
Society, 86(1): 39-49; also, Mote, P.W., E.A. Parson, A.F. 10
The Climate Impacts Group will continue to periodically
Hamlet, W.S. Keeton, D. Lettenmaier, N. Mantua, E.L. Miles,
update its scenarios of Pacific Northwest climate change and
D.W. Peterson, D.L. Peterson, R. Slaughter, and A.K. Snover
climate impacts as warranted by developments in global
(2003), Preparing for Climatic Change: The Water, Salmon,
climate models and improvements in regional modeling
and Forests of the Pacific Northwest, Climatic Change, 61: 45-
capability. For the most current scenarios, see http://
88.
www.cses.washington.edu/cig/pnwc/cc.shtml.
3
Cayan, D., S.A. Kammerdiener, M.D. Dettinger, J.M. Caprio,
and D.H. Peterson (2001), Changes in the Onset of Spring in
the Western United States, Bulletin of the American
Meteorological Society, 82(3): 399-415.
4
Hamlet, A.F., P.W. Mote, M.P. Clark, and D.P. Lettenmaier
(2005), 20th Century Trends in Runoff, Evapotranspiration, and
Soil Moisture in the Western U.S. Journal of Climate (in
review). Available for download at ftp://
ftp.hydro.washington.edu/pub/hamleaf/hamlet_runoff_trends/
hamlet_west_wide_hydrologic_trends_070105.pdf.
5
More information regarding the models and projections can
be found in Kay, J.E., J.H. Casola, A.K. Snover and the
Climate Impacts Group (2005), “Climate Impacts Science
Primer”, fact sheet prepared for King County (Washington)’s
October 27, 2005 Climate Change Conference. This and other
conference materials are available at
http://www.cses.washington.edu/cig/outreach/workshops/
kc2005.shtml. Temperature projections represent an average
of projections from the ECHAM4, PCM, HadCM2, and
HadCM3 global climate models. All show similar temperature
Page 13Climate Impacts on Washington’s Hydropower, Water Supply, Forests, Fish, and Agriculture
Impacts on Washington’s Hydrology
any of the resources and
M industries discussed in this
booklet intersect in their reliance on
water. Hydropower is generated by
water flowing in rivers and released
from reservoirs. Cities require
supplies of clean drinking water. Fish
rely on clean water at an appropriate temperature for
their habitat. Forests and crops rely on water to grow
and reproduce. Droughts and floods can strain all of
these water users, imposing significant conflicts
among them.1
Snowpack
An important “natural” water reservoir is provided by
snowpack that accumulates during the winter in
mountain watersheds. During the 20th century,
especially since 1945, snowpack has been declining
throughout the West, with the Cascades showing
some of the largest losses (Figure 5).2 Increases in
temperature over the last 80 years have been shown to
be the predominant cause of the observed declines in
snowpack.3
Declines in Washington's mountain snowpack
occurring over the last 80 years will likely continue
due to warming, especially at lower elevations.
Although future winters may be somewhat wetter on Figure 5. Changes in April 1 Snow Water Equivalent in
the western United States. Linear trends in April 1 snow
average, warmer temperatures should make more water equivalent (SWE) relative to 1950 at 798 snow course
precipitation fall as rain and less as snow, resulting in locations in the western U.S. and Canada for the period 1950-
1997. Negative trends are shown by red circles and positive
reduced spring snowpack and earlier snowmelt by blue circles. SWE is a common measurement for the
(Figure 6). Parts of Washington state where winter amount of water contained in snowpack if it were melted
temperatures are currently near freezing would be the instantaneously. Figure adapted from Mote et al. (2005).4
most sensitive to this climate change; in the warmest
areas, significant snow accumulation in spring may
(Opposite page) Figure 6. Spring snowpack (inches of snow water equivalent) in the Pacific Northwest for the 20th century, the
2020s, and the 2040s. Areas in white are snow-free; areas in pink have some snowpack; areas in purple have relatively heavy
snowpack. Future projections indicate that less snow is likely to accumulate during the winter and the snow melt is likely to occur
earlier in the year. The projections have been made with an average of four climate models, one relatively wet model, one relatively
dry model, one relatively warm model, and one relatively cool model. This four model composite can be considered a “middle-of-the-
road” projection.
Page 14April 1 June 1
Spring snowpack
2003
2020s
36 inches
2 inches
Miles
0 150
2040s
Climate
Impacts
Group
University
of
Washington
Page 15Climate Impacts on Washington’s Hydropower, Water Supply, Forests, Fish, and Agriculture
Skiing in the Pacific Northwest
The increases in temperature projected for the next century Snoqualmie Pass (3000 ft)
could pose serious challenges to skiing operations located in 0 10 20 30 40 50 60 70 80 90 100 110 120
the Cascade Mountains. Many skiing areas may have to open % Years Open
later in the season, due to the later establishment of a sufficient Dec 1
base, while facing a shorter ski season and more frequent rainy
days, all of which could negatively affect revenue. The most Days Open
dramatic impacts would likely occur in lower elevation ski
areas where current winter temperatures are often close to
% Days of Rain
freezing.
The Climate Impacts Group (CIG) has performed model
simulations to investigate how ski conditions in the Cascades Stevens Pass (4060 ft)
would be affected by climate change.5 Their work focused on 0 10 20 30 40 50 60 70 80 90 100 110 120
three ski areas (Stevens Pass, Snoqualmie Pass, and Mission
% Years Open
Ridge), examining three metrics of ski season: the percentage Dec 1
of years the ski area could open by December 1, the length of
the ski season, and the number of rainy days during the ski Days Open
season.6
This study showed that impacts are larger the lower the ski % Days of Rain
area's elevation and the warmer the climate (Figure 7). A
temperature change of 3.6°F (2°C) (projected to occur around
the 2020s), could reduce the season length by 28% and 14%, Mission Ridge (4500 ft)
for Snoqualmie and Stevens, respectively (compared to the 0 10 20 30 40 50 60 70 80 90 100 110 120
1948-1997 control climate). Quality of skiing conditions could
% Years Open
also be reduced, with the percentage of rainy days during the Dec 1
ski season climbing above 50% for both locations. A
temperature change of 4.5°F (2.5°C) (projected to occur Days Open
around the 2040s) would further shorten the ski season and
reduce the probability of opening by December 1 to less than
% Days of Rain
25% for both areas.7 In short, the warmer it gets, the larger the
magnitude of impacts.
Current 2020s 2040s
Mission Ridge, located on the east side of the crest of the
Cascades, would experience a slight increase in days of rain -
around 40% of ski season days for both scenarios (compared
with 25% in the control climate). However, due to Mission Figure 7. Projected changes in ski conditions at
Snoqualmie Pass, Stevens Pass, and Mission
Ridge's higher elevation (its base is 4500 feet [1372 m]; for Ridge for the 2020s and 2040s. Each graph shows
comparison, Snoqualmie is at 3000 feet [915 m] and Stevens is how Cascade ski operations would be impacted by
at 4060 feet [1238 m]) the length of the ski season and projected climate change. For all areas, future
warming would likely make opening by December 1
probability of opening would not be significantly affected. more difficult, shorten the length of the ski season,
Higher elevation areas like Mission Ridge are probably more and reduce the quality of ski conditions (as
vulnerable to precipitation variability than regional warming. measured by the number of days where rain falls
while the area is open). The areas at lower elevation
(Snoqualmie and Stevens) are impacted the most.
It is important to note that the impacts of regional warming on
For all areas, impacts become worse as the warming
the ski industry are not necessarily all negative. For example, increases.
warmer temperatures and less snow on the highways during the
ski season could improve customer access to ski areas.
Page 16Climate Impacts on Washington’s Hydropower, Water Supply, Forests, Fish, and Agriculture
Figure 8. Typical seasonal streamflow patterns
for a rain-dominant, snow-dominant, and
transient watershed. Rain-dominant watersheds
(dark blue line) typically experience peak flow
during the winter, when precipitation is heaviest.
Snow-dominant watersheds (purple line) have
more area at higher elevation and accumulate
snow during the winter. Their peak flows occur
during the late spring or early summer as the snow
melts. Transient watersheds (light blue line)
receive both rain and snow during the winter, and
display a double-peak in their hydrographs.
Transient watersheds are the most sensitive to
temperature increases.
become infrequent in the future. Meanwhile, all those in the Columbia River Basin, are
elevations - even those well above the current considered “snow melt-dominant” (the
freezing level - would experience an earlier onset of hydrographs for the Dalles and Grand Coulee
snowmelt due to spring warming. Dam in Figure 9(a) are typical of a snow melt
dominant system). These watersheds experience
Streamflow low flows in the winter, peak flows during the
Streamflow varies strongly throughout the year as a spring and early summer as snowpack melts, and
result of seasonal cycles of precipitation, snowpack, low flows during the late summer. The timing of
temperature, and groundwater. Humans and this cycle is sensitive to temperature. Projected
ecosystems have adapted to the “rhythms” of temperature increases will likely increase winter
streamflow occurring in the watersheds upon which flows, reduce spring and summer flows, and shift
they rely. Changes in temperature and peak runoff earlier in the year, continuing and
precipitation will likely affect the timing and amplifying trends observed throughout the West
volume of streamflow. However, a river system's over the last 80 years.8
precise response will depend on its elevation
(Figure 8): • River systems at intermediate elevations, such as
the Cedar, Tolt, Quinalt, and Spokane Rivers (see
• Coastal rivers at low elevation exhibit flow Figure 9(b)), experience mid-winter temperatures
behavior that follows seasonal precipitation close to freezing and are sensitive to changes in
patterns, with high flows during the wet winter the percentage of winter precipitation falling as
months and low flows during the summer. These snow. Typically, rivers in the “transient snow
“rain-dominant” watersheds, like the Hoh River, zone” have peak flows in November and
respond directly to changes in precipitation. December during periods of heavy precipitation
Projected increases in cool season precipitation and another period of peak flow during the spring
could lead to increases in fall and winter flows. It as snowpack melts. Similar to snowmelt-
is difficult to make projections for summer flow dominant watersheds, the transient watersheds
given the uncertainty in summer precipitation will likely have an enhanced winter time peak
projections. flow due to the increase in rain, reduced spring
and summer flows due to the reduction in
• Rivers fed by high elevation sources, such as snowpack, and an earlier snow melt.9 A small
Page 17Climate Impacts on Washington’s Hydropower, Water Supply, Forests, Fish, and Agriculture Figures 9(a) and (b). Winter precipitation sensitivity to warming and projected streamflow changes in the Pacific Northwest. Areas where current winter precipitation is a mix of rain and snow are highly sensitive to future warming. These areas appear purple on the map; areas where winter precipitation is predominantly snow or rain are shaded pink. Solid black lines indicate the drainage area for the Columbia River Basin. The hydrographs below the maps show monthly naturalized streamflow (streamflow corrected for the effects of dams and withdrawals). The black line represents streamflow for typical hydrologic conditions and early 20th century temperature; the gray line represents calculated streamflow for typical hydrologic conditions but late 20th century temperature; the blue swath represents the range of projected streamflow for the 2040s. Page 18
Climate Impacts on Washington’s Hydropower, Water Supply, Forests, Fish, and Agriculture

Figure 9(b). Winter precipitation sensitivity and projected changes in monthly streamflow for selected Washington State
river basins.

                                                                                                                  Page 19
Climate Impacts on Washington’s Hydropower, Water Supply, Forests, Fish, and Agriculture
amount of temperature increase in transient
watersheds can lead to a large streamflow
response, as demonstrated by the large changes in
streamflow timing for the Spokane River at Long
Lake.
Stream Temperatures
Many aquatic organisms have a particular
temperature range in which they can function. Many
factors, such as ground water flow, streamflow,
vegetation along the banks, or nearby snow cover can
affect water temperature. All of those factors being Figure 10. Warming trend in Fraser River average
summer stream temperatures, 1953-1998. Each diamond
equal, water temperatures in unregulated rivers (those represents the average summer stream temperature in the
rivers whose flow is not controlled by dams)10 tend to Fraser River (British Columbia). The black line shows the
warming trend during the 35-year period. The warming trend
strongly influenced by air temperatures (Figure 10).
likely reflects to response of unregulated rivers to increasing
During the typical summer low flow period that air temperatures. Reproduced with permission from the
occurs across Washington State, streams are Pacific Salmon Commission and the British Columbia
Ministry of Water, Land, and Air Protection.14
particularly susceptible to reaching high temperatures
that can be dangerous for fish and other riverine life.
It is highly likely that projected increases in air
temperature will lead to warmer stream
temperatures, especially during the summer.
Recent work on the Fraser River in British Columbia,
an unregulated river, indicates that stream
temperatures in the next century could be
significantly higher during the summer (Figure 11).11
Results from model simulations similar to those used
in the results presented here demonstrate that
dangerously high temperatures for fish on the Fraser
could be exceeded during 20% of the summers by
2020, over 40% of the summers by 2050, and nearly Figure 11. Historical and projected incidence of stream
temperatures harmful to salmon spawning in the Fraser
60% of the summers by 2080.12 Water temperatures River watershed. The figure shows a dramatic projected
in the Columbia, although complicated by the increase in the frequency of high stream temperatures for the
Fraser and Thomson Rivers, both located in the Fraser
presence of dams and reservoirs, are also expected to Watershed. The Thomson River flows into the Fraser – fish
increase. spawning in the Thomson may be harmed by high stream
temperatures on either river, hence the “Either” column on the
Soil Moisture graph. The incidence of high stream temperatures is measured
in DRH (Degree Reach Hours), which represents the number
Soils of the PNW store large volumes of water, of hours during the summer along a 6 miles (10 km) portion
of the river where stream temperatures exceed 68°F (20°C).
constituting a crucial water supply for vegetation and The percentages plotted correspond to the number of years
dry land agriculture. Soil moistures are usually lowest the DRH value was greater than the worst summer during the
period 1961-1990. The label “2020” corresponds to the 30-
at the beginning of October.13 Cool temperatures year period 2010-2039; “2050” corresponds to 2040-2069;
accompanied by heavy fall and winter precipitation and, 2080 corresponds to 2070-2099. Reproduced with
permission from Morrison et al. (2002).15
allow the soil to accumulate water throughout the
Page 20Climate Impacts on Washington’s Hydropower, Water Supply, Forests, Fish, and Agriculture
Figure 12. Projected changes in spring and summer soil moisture for the 2020s and 2040s. The four
maps show projected soil moisture differences between future climate and the current climate. The left
panels show differences for April 1 soil moisture. The differences for the 2020s appear on the top, the
differences for the 2040s appear on the bottom. The right panels show similar maps for July 1 soil
moisture. Increases in soil moisture relative to the current climate appear in green, decreases appear in
brown. The April 1 projections show substantial increases in soil moisture for both time periods, a
consequence of an earlier onset of snowmelt. The July 1 projections show small increases and decreases
in soil moisture across the region. There appears to be moderate drying west of the Cascades and slight
increases in soil moisture east of the Cascades; however, the July 1 projections are highly uncertain.
Page 21Climate Impacts on Washington’s Hydropower, Water Supply, Forests, Fish, and Agriculture
winter in areas that are above freezing. Soils in snow more difficult to predict, since they are sensitive to
dominant watersheds tend to accumulate moisture changes in many factors including solar radiation
later in the year with the onset of snowmelt. In most (cloudiness), wind speed, precipitation, humidity, and
cases, soil moisture peaks in the spring or early temperature. For areas west of the Cascades where
summer. In summer, the longer days, decreased cloud evaporation rates are an important factor in
cover, low precipitation, increased plant growth, and determining seasonal evaporation, warming would
higher temperatures lead to a depletion of soil tend to enhance soil drying and reduce soil
moisture over much of the PNW. The return of fall moisture in the summer and fall (Figure 12, right
rains and cooler temperatures allow the soils to panels). East of the Cascades, where warm season
recharge, continuing the cycle.16 evaporation in natural settings is almost entirely
determined by water availability, summer soil
Under climate change scenarios, increasing moistures will likely be most sensitive to
temperatures, reduced snow pack, and an earlier precipitation changes. If summer precipitation
onset of snowmelt cause soil moisture recharge to increases, soil moistures in natural landscapes may be
occur earlier in the year in snowmelt-dominant similar to those observed today, or may even increase.
and transient watersheds (Figure 12, left panels).
Changes in soil moisture in the summer and fall are
IMPLICATION OF 2005 CLIMATE CHANGE SCENARIOS FOR HYDROLOGIC
IMPACTS
New projections for Pacific Northwest climate change (“2005 scenarios”) are slightly cooler and, in the 2020s,
drier than the climate change scenarios used in the hydrologic studies described in this paper (see Updated
2005 Climate Change Scenarios Box). The 2005 scenarios could affect the hydrologic results described in this
paper as follows:*
• Under the cooler (2005) climate change scenarios temperature related effects including decreases in
snowpack, increases in April soil moisture, streamflow timing shifts from summer to winter, and water
resources impacts associated with earlier peak flow and decreased summer water availability that were
previously projected for the 2020s and 2040s would occur later in the century.
• The electricity demand changes projected by the Northwest Power and Conservation Council for the 2020s
and 2040s would similarly occur later in the century due to the cooler 2005 climate change scenarios.
• Increases in annual streamflow volume (which are controlled primarily by winter precipitation changes)
previously projected for the 2020s are probably overestimated, given the
drier projections of the 2005 scenarios.
• For the 2040s, projections of annual streamflow volume changes would
be comparable under both the old and new (2005) climate change
scenarios due to the similarities in their projected precipitation changes.
* For more information on how the 2005 scenarios would affect various previous
hydrologic studies, see Lettenmaier et al. (2005), Implications of 2005 climate change
scenarios for Pacific Northwest hydrologic studies.17 Grand Coulee Dam, Washington (Source: Climate
Impacts Group)
Page 22You can also read