City of Waterford
Draft Urban Water Management Plan
                             2005
←
→
Page content transcription
If your browser does not render page correctly, please read the page content below
City of Waterford
Draft Urban Water Management Plan
2005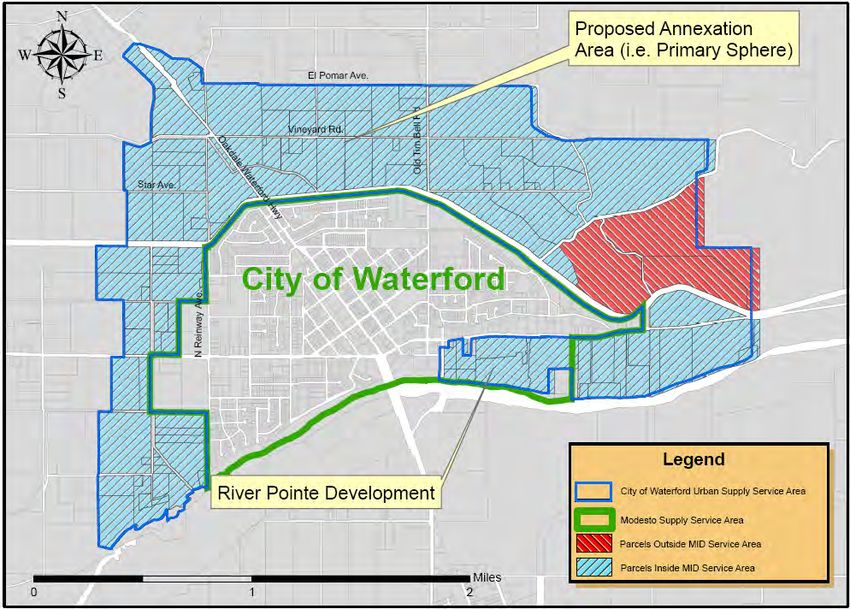
City of Waterford Draft 2005 Urban
     Water Management Plan

              Prepared by:

              Water and Environment

              In Association with:
            Byron Buck & Associates
(This page intentionally left blank)
Table of Contents
Chapter 1 Introduction ...........................................................................................................1-1
1.1         Background .............................................................................................................1-1
1.2         Agency Coordination...............................................................................................1-1
1.3         Plan Updates...........................................................................................................1-2
1.4         City and County Notification and Participation ........................................................1-2
1.4.1       Notification Regarding 2005 UWMP Review and Revision.....................................1-2
1.4.2       Evidence of Consultation and Comments ...............................................................1-2
1.5         Public Participation..................................................................................................1-2
Chapter 2 Supplier Service Area ...........................................................................................2-1
2.1         Background .............................................................................................................2-1
2.2         Climate ....................................................................................................................2-2
2.3         Other Demographic Factors....................................................................................2-3
2.4         Population Projections ............................................................................................2-3
2.4.1       Current Population Determination...........................................................................2-3
2.4.2       Future Population Projections – Primary Sphere and River Pointe Development ..2-3
Chapter 3 Water Supply .........................................................................................................3-1
3.1         Sources of Supply ...................................................................................................3-1
3.1.1       Surface Water .........................................................................................................3-1
3.1.2       Groundwater ...........................................................................................................3-1
3.2         Current Supply Determination.................................................................................3-2
3.3         Future Supply..........................................................................................................3-2
3.4         Exchange or Transfer Opportunities .......................................................................3-3
3.5         Desalination ............................................................................................................3-3
3.6         Wholesale Supplies.................................................................................................3-4
3.7         Summary of Supply.................................................................................................3-4
Chapter 4 Water Demand .......................................................................................................4-1
4.1         Current Water Demand ...........................................................................................4-1
4.2         Future Water Demand Analysis ..............................................................................4-1
4.2.1       Residential Demand................................................................................................4-1
4.2.2       Industrial and Commercial Demand........................................................................4-2
4.3         Sales to Other Agencies .........................................................................................4-2
4.4         Other Water Uses ...................................................................................................4-3
4.5         Future Water Demand Summary ............................................................................4-3
Chapter 5 Demand Management and Conservation............................................................5-1
5.1         Demand Management Measures............................................................................5-1
5.1.1       DMM 1: Water Survey Programs for Single-Family Residential and Multi-Family
Residential Customers...............................................................................................................5-1
5.1.2       DMM 2: Residential Plumbing Retrofit ....................................................................5-2
5.1.3       DMM 3: System Water Audits, Leak Detection, and Repair ...................................5-2
5.1.4       DMM 4: Metering with Commodity Rates for all New Connections and Retrofit for
Existing Connections .................................................................................................................5-3
5.1.5       DMM 5: Large Landscape Conservation Programs and Incentives........................5-4
5.1.6       DMM 6: High-Efficiency Washing Machine Rebate Programs ................................5-4
5.1.7       DMM 7: Public Information Programs .....................................................................5-5
5.1.8       DMM 8: School Education Programs ......................................................................5-5
5.1.9       DMM 9: Conservation Programs for Commercial, Industrial, an Institutional
Accounts 5-5
5.1.10      DMM 10: Wholesale Agency Programs ..................................................................5-6
5.1.11      DMM 11: Conservation Pricing ...............................................................................5-6

Effective: June 2005
5.1.12     DMM 12: Water Conservation Coordinator .............................................................5-7
5.1.13     DMM 13: Water Waste Prohibition..........................................................................5-7
5.1.14     DMM 14: Residential Ultra-Low-Flush Toilet Replacement Programs ....................5-8
5.2        Planned Supply Projects .........................................................................................5-8
Chapter 6 Water Supply Reliability .......................................................................................6-9
6.1        Climate: Reliability and Vulnerability .......................................................................6-9
6.2        Projected Water Supplies........................................................................................6-9
6.2.1      Basis for Average, Single and Multiple Dry Water Year Data .................................6-9
6.3        Supply Inconsistencies..........................................................................................6-11
Chapter 7 Water Quality Impacts on Reliability ...................................................................7-1
7.1        Water Quality Impacts.............................................................................................7-1
Chapter 8 Wastewater and Recycled Water .........................................................................8-1
8.1        Coordination............................................................................................................8-1
8.2        Wastewater Quantity, Quality and Current Issues ..................................................8-1
8.3        Wastewater Disposal and Recycled Water Uses....................................................8-1
8.4        Potential and Projected Use, Optimization Plan with Incentives.............................8-2
Chapter 9 Supply and Demand Comparison........................................................................9-1
9.1        Normal Year ............................................................................................................9-1
9.1.1      Supply .....................................................................................................................9-1
9.1.2      Demand...................................................................................................................9-1
9.1.3      Comparison.............................................................................................................9-1
9.2        Single and Multiple Dry Years.................................................................................9-1
Chapter 10 Water Shortage Contingency Plan ....................................................................10-1
10.1       Stages of Action ....................................................................................................10-1
10.1.1     Triggering Mechanisms.........................................................................................10-1
10.2       Estimate of Minimum Supply for the Next Three Years ........................................10-1
10.3       Catastrophic Supply Interruption Plan...................................................................10-1
10.4       Prohibitions, Penalties and Consumption Reduction ............................................10-1
10.4.1     Mandatory Prohibitions on Water Wasting............................................................10-1
10.4.2     Excessive Use Penalties.......................................................................................10-1
10.5       Analysis of Revenue Impacts of Reduced Sales during Shortages ......................10-1
10.6       Draft Ordinance and Use Monitoring Procedure ...................................................10-1
10.6.1     Draft Ordinance.....................................................................................................10-1
10.6.2     Water Use Monitoring Procedure..........................................................................10-1
Chapter 11 Provisions, Adoption, and Implementation ......................................................11-1
11.1       Provision of Water Service Reliability Section ......................................................11-1
11.2       Participation and Plan Adoption ............................................................................11-1
11.3       Implementation......................................................................................................11-1
Chapter 12 References............................................................................................................... A

List of Tables
Table 1-1: Coordination with Appropriate Agencies ............................................................1-2
Table 2-1: Climate Data ...........................................................................................................2-3
Table 2-2: Estimated Buildout (2030) Land Use Categories and Acreage for the Service
    Area ...................................................................................................................................2-4
Table 2-3: Current and Projected Population for the Service Area .....................................2-4
Table 3-1: Supply by Source Summary .................................................................................3-3
Table 3-2: Available Wholesaler Supplies (Current and Projected) to the City (AFY) .......3-4
Table 4-1: Residential Water Demand in Service Area – Current and Projected ...............4-2

Effective: June 2005
Table 4-2: Industrial and Commercial Water Demand – Current and Projected ................4-2
Table 4-3: Past, Current, and Future Water Demand Summary in Service Area................4-4
Table 5-1: Demand Management Measures Implemented by the City ................................5-1
Table 5-2: Estimated City Water Rates and Charges............................................................5-3
Table 5-3: Volume of Projected Supply for Planned Projects..............................................5-8
Table 6-1 Supply Reliability at Buildout Year 2030(AFY) .....................................................6-9
Table 6-2 Basis of Water Year Data......................................................................................6-10
Table 6-3 Wholesale Supply Reliability (% of Normal AFY) ...............................................6-11
Table 6-4 Factors Resulting in Inconsistency of Wholesaler’s Supply ............................6-11
Table 8-1 Wastewater Collection and Treatment (AFY)1 ......................................................8-1
Table 8-2 Disposal of Wastewater (Non-Recycled AFY) ......................................................8-1
Table 9-1 Projected Normal Year Water Supply (AFY) .........................................................9-1
Table 9-2 Projected Normal Year Water Demand (AFY) .......................................................9-1
Table 9-3 Projected Supply and Demand Comparison (AFY) ..............................................9-1
Table 9-4 Projected Available Supply, Demand, and Comparison during Single and
Multiple Dry Year Periods (AFY) .....................................................................................9-1
Table 10-1: Water Shortage Stages of Action .....................................................................10-1
Table 10-2: Phasing Criteria for Water Shortage Stage Determination ............................10-1
Table 10-3 Minimum Supply by Source for the Next Three Years (AFY) ..........................10-1
Table 10-4: Requested Consumer Actions by Stage ..........................................................10-1
Table 10-5: Penalties for Excessive Water Use by Stage...................................................10-1
List of Figures
Figure 2-1: City of Waterford - General Location ..................................................................2-1
Figure 2-2: Water Supplier Service Areas .............................................................................2-2
Figure 3-1: Current and Projected Water Supplies to Meet Demand in the Service Area.3-3
Figure 4-1: Total Projected Water Demand by Section within the Service Area................4-3
Effective: June 2005List of Abbreviations AC Acreage AF Acre feet AFY Acre feet per year CIMIS California Irrigation Management Information System DBCP Dibromochloropropane DMM Demand Management Measure DU Dwelling Unit DWR Department of Water Resources EOM Emergency Operations Manual GPD Gallons per day GPDC Gallons per day per capita GPM Gallons per minute IRGMP Integrated Regional Groundwater Management Plan MGD Million gallons per day MID Modesto Irrigation District MRWTP Modesto Regional Water Treatment Plant SCADA Systems Control and Data Acquisition STRGBA Stanislaus and Tuolumne Rivers’ Groundwater Basin Association TID Turlock Irrigation District UWMP Urban Water Management Plan WWTP Wastewater Treatment Plant Effective: June 2005
City of Waterford Draft 2005 Urban Water Management Plan                                Chapter 1 Introduction
                                                                                                       DRAFT

Chapter 1              Introduction
The Urban Water Management Planning Act was established by Assembly Bill 797 (AB 797) on
September 21, 1983. Passage of this law was recognition by state legislators that water is a limited
resource and a declaration that efficient water use and conservation would be actively pursued throughout
the state. The law requires water suppliers in California, providing water for municipal purposes either
directly or indirectly to more than 3,000 customers or supplying more than 3,000 acre-feet per year (AFY)
of water, to prepare and adopt a specific plan every five years which defines their current and future water
use, sources of supply and its reliability, and existing conservation measures.
In recognition of the state requirements, the City of Waterford (City) has prepared this Urban Water
Management Plan (UWMP) to address the anticipated future urban demands that will be met by the newly
formed City of Waterford Water Department from 2005-2030. As such, this 2005 UWMP is the first
UWMP prepared by the City of Waterford and therefore is not an update of an existing plan. This UWMP
will discuss the demands generated by anticipated urban development within the City of Waterford
service area, and the supplies the City will use to meet these demands. This discussion will also include
demand management, supply reliability, water quality impacts, wastewater and recycled water, supply
and demand comparison, and water shortage planning.

1.1 Background and Effective Date
As of its formation in 2005, the City of Waterford Water Department (Department) will be responsible for
supplying all urban water demands within their service area. As of 2005, the Department service area is
the 1,610-acre Primary Sphere annexation area surrounding the current City boundaries. The City will
also supply water to River Pointe, a 75-acre section within the City limits where new residential
development has recently begun.
The effective date of this document is June 1, 2005. As of the effective date, the City did not supply water
to the service area, however development is in its initial phases and the City is expected to be supplying
water as early as mid to late 2005. Currently, the service area consists of primarily agricultural land that is
being converted into residential areas.
The area within current City of Waterford boundaries is and will continue to be served by the City of
Modesto. This has been the case since the mid 1990’s when the City of Modesto took over service from
the Del Este Water Company. The City has no plans at this time to service existing City of Modesto
Waterford customers but will focus on new development within the City boundaries and sphere of
influence.
The existing water demands in the Primary Sphere which include agricultural and limited residential
demands are met with raw surface water from the Modesto Irrigation District (MID), and private
groundwater wells. As previously stated, the City is not responsible for supplying these current demands.
As agricultural areas are transitioned to residential areas during development of the area, the City will
take over service.

1.2 Agency Coordination
In preparing this UWMP, the City has coordinated with MID and the City of Modesto during preparation
of their 2005 UWMP updates. The City has also coordinated with the Department of Water Resources
(DWR) on several occasions to develop a document that will meet DWR requirements. The City will also
supply the County of Stanislaus (County) the Draft 2005 UWMP prior to adoption.

Effective: June 2005                                                                                      1-1
City of Waterford Draft 2005 Urban Water Management Plan Chapter 1 Introduction
DRAFT
Table 1-1: Coordination with Appropriate Agencies
Agency Level of Coordination
Meetings, demand review, shared UWMP information, Draft
MID UWMP review
City of Modesto UWMP information, Draft UWMP review
Conference call held to discuss UWMP format and specifics to
Waterford (September 2005). Completeness review of Draft
DWR UWMP requested (October 2005).
County of
Stanislaus Draft UWMP will be sent to the County for review and posting.
1.3 Resource Maximization/Import Minimization Plan
The City understands that water is a limited, though renewable resource, and that a long-term reliable
supply of water is essential to protect the local and state economy. It also recognizes that, while
conservation and efficient use of water is a statewide concern, planning for this use is best done at the
local level.
The main focus for the City is to maximize the efficient use of water and install water meters. In addition
to the water meter program, the City is increasing its other water conservation measures as described later
in the UWMP.
1.4 Plan Updates
This 2005 UWMP is the original plan for the newly formed City Water Department.
1.5 City and County Notification and Participation
The City will notify appropriate parties of the preparation of this Draft 2005 UWMP.
1.5.1 Notification Regarding 2005 UWMP Review and Revision
As stated, the City has not previously developed an UWMP. A Draft UWMP will be sent to the following
agencies: MID, the City of Modesto, Stanislaus County, and DWR. The Final UWMP will be submitted
to DWR for approval.
1.5.2 Evidence of Consultation and Comments
The City is planning to consult with DWR, and other agencies as necessary, during the Draft UWMP
review period. The City is prepared to incorporate comments received into a Final UWMP for submittal
to DWR for approval. A summary of any comments received from DWR or other agencies will be found
as Appendix A to the Final 2005 UWMP, along with the transmittal letters sent to these agencies with the
Draft UWMP.
1.6 Public Participation
To the extent possible, the City will encourage public participation through circulating a public draft and
holding a public hearing. A least two notifications of the time and location of the public hearing will be
published in the Modesto Bee at least 14 days prior to the hearing date and close of the public review
period. The notifications will also include the locations of the Draft UWMP available for review. Copies
of the Draft UWMP will be placed at the Nora Ballard Library, the Waterford Community Center, and the
Stanislaus County Clerk’s office.
Effective: June 2005 1-2City of Waterford Draft 2005 Urban Water Management Plan Chapter 2 Supplier Service
Area
Chapter 2 Supplier Service Area
2.1 Background
The City of Waterford is located in Stanislaus County, 13 miles east of the City of Modesto along State
Highway 132 (Yosemite Boulevard). Figure 2-1 shows its general location within California.
Figure 2-1: City of Waterford - General Location
The City is planning to serve any urban development occurring within the 1,610 acre Primary Sphere.
Currently, this area is mostly agricultural land but is expected to be completely converted (reach buildout)
by 2030 into low-density residential housing (4.5 dwelling units/acre). Since development has already
begun in the River Pointe area, it will be addressed separately from the Primary Sphere with regard to
current demand and supply. Figure 2-2 presents the service area delineation in the City of Waterford
vicinity.
Effective: June 2005 2-1City of Waterford Draft 2005 Urban Water Management Plan Chapter 2 Supplier Service
Area
DRAFT
Figure 2-2: Water Supplier Service Areas
As previously stated, the City does not currently plan to supply water within the existing City of
Waterford boundary except to the River Pointe development. Areas within the city limits are currently
supplied by the City of Modesto. The City of Modesto supplies this area with groundwater wells located
in Waterford. Within the City’s service area, existing land use is primarily agricultural with a few
associated residences. Current demand within the City service area is supplied by MID and private
groundwater wells.
As the City’s service area is converted to urban residences, the City will become the primary water
supplier. The sources of these supplies will be discussed in Chapter 3.
It is assumed that MID will continue to serve the agricultural demands within its service area until the
land is converted for residential development and municipal service standards are met. Further details on
MID users and demands can be found in the MID Agricultural Water Management Plan.
2.2 Climate
Climate data including temperature and precipitation estimates used for the Waterford area were obtained
from the Western Regional Climate Center near Modesto, California. The period of record was January 1,
1931 through December 31, 2004. Evapotranspiration values for the area were calculated specific to crop
type and can be found in a Technical Memorandum authored by RMC in October 2005 (RMC, 2005b).
In general Waterford’s climate is described as continental, characterized by moderate, wet winters and
hot, dry summers. Table 2-1 shows the historic climate characteristics in the Waterford area.
Effective: June 2005 2-2City of Waterford Draft 2005 Urban Water Management Plan Chapter 2 Supplier Service
Area
DRAFT
Table 2-1: Climate Data
Jan Feb Mar Apr May Jun Jul Aug Sep Oct Nov Dec Ann.
Monthly Average
ETo(1) (in) 0.87 1.71 3.43 5.24 6.7 7.4 7.85 6.75 4.93 3.37 1.66 0.87 50.78
Average Total
Precipitation(2) (in) 2.37 2.13 1.94 1.07 0.46 0.09 0.03 0.04 0.2 0.64 1.36 2.1 12.42
Average Max
Temperature(2) (F) 53.7 60.8 66.9 73.4 81.1 88.2 94.1 92.1 87.7 78 64.4 54.2 74.5
Average Min
Temperature(2) (F) 37.7 40.9 43.4 46.8 51.7 56.4 59.8 58.7 56 49.7 41.7 37.8 48.4
1. Data from CIMIS Station #71. The period of record is June 1987 to present.
2. Data from Western Regional Climate Center (http://www.wrcc.dri.edu/cgi-bin/cliMAIN.pl?camode+nca) for Modesto, CA.
Period of record is 1/1/1931 through 12/31/04.
Other climate characteristics that affect water management in Waterford include solar radiation, relative
humidity, dew point, wind speed, and soil temperature. Daily and monthly averages for these values can
be obtained from the CIMIS station website at: http://wwwcimis.water.ca.gov/.
2.3 Other Demographic Factors
No other demographic factors were determined to affect water management at this time. As the City
undergoes development, other factors may be identified and would be discussed in subsequent UWMP
updates.
2.4 Population Projections
The current and projected population (through 2030) of the service area was estimated using parcel
information and buildout projections. The current population, methodology, and resulting projections are
discussed in the following sub-sections.
2.4.1 Current Population Determination
For the purposes of this UWMP, the current population of the River Pointe development area is
considered to be zero given that the development construction has just begun. The current population of
the Primary Sphere was estimated using parcel assessment data (MetroScan) provided by MCR
Engineering. For each Primary Sphere parcel section, the total number of residences was calculated. After
determining the total number of residences, an industry standard approximation of 3 persons per
household was used to derive the current population. Based on this methodology, the total current
population for the entire service area (Primary Sphere and River Pointe) was calculated to be 204 people.
2.4.2 Future Population Projections – Primary Sphere and River Pointe Development
Population projections were developed by extrapolating linearly from current population to buildout at
2030. Table 2-2 shows projected buildout population and acreage by land use category.
Effective: June 2005 2-3City of Waterford Draft 2005 Urban Water Management Plan Chapter 2 Supplier Service
Area
DRAFT
Table 2-2: Estimated Buildout (2030) Land Use Categories and Acreage for the Service Area
Land Use Category Gross Acreage (ac) Dwelling Units(1) Population(1)
Low Density Residential 1,392 6,264 18,792
Industrial 126 0 n/a
General Commercial 48 0 n/a
Major roads, canals,
railroads 129 0 n/a
(2)
Total 1,695 6,264 18,792
1. Population estimate assumes 3.5 persons/DU, 4.5 dwelling units (DU) per acre (gross acreage), and a net acreage
value of 85% (effectively 3.85 DU/acre)
2. Includes Primary Sphere (1610 acres) and River Pointe development (75 acres).
As shown in the Table 2-2, the City’s service area population is expected to reach 18,792 persons by
2030. Table 2-3 shows the projected population in 5-year increments, assuming a linear increase from
2005 to 2030. It is important to note that these population projections include the existing population not
currently served water by the City.
Table 2-3: Current and Projected Population for the Service Area
2005 2010 2015 2020 2025 2030
Service Area Population 204 3922 7639 11357 15074 18792
Estimated Residences in the Service
Area 68 1307 2546 3786 5025 6264
Effective: June 2005 2-4City of Waterford Draft 2005 Urban Water Management Plan Chapter 3 Water Supply
DRAFT
Chapter 3 Water Supply
The following sections describe the sources of supply, as well as current and future supply analysis.
3.1 Sources of Supply
Urban demands within the service area will be supplied from a combination of surface water and
groundwater sources. The following subsections describe the current surface water and groundwater
sources and planned expansion of these supplies.
3.1.1 Surface Water
MID has historic surface water rights on the Tuolumne River. These water rights have been used to divert
raw water irrigation supply for the agricultural users within MID’s service area and the Primary Sphere.
Agricultural demands within the Primary Sphere but outside of MID’s service area are met through
private groundwater supplies. As these agricultural areas are converted to residential, industrial and
commercial areas, or other urban zones, the City is planning to utilize existing MID surface water supply
allocations to meet the urban supply needs. Instead of flowing through agricultural aqueducts, raw MID
water will be routed to the Modesto Regional Water Treatment Plant (MRWTP) and treated for potable
use, then distributed as needed throughout the developing service area. It is anticipated that such an
arrangement will be procured to coincide with a proposed MRWTP expansion in 2018.
The MRWTP is located at the Modesto Reservoir, approximately 2 miles east of the city. The plant is a
complete conventional treatment facility providing flocculation, sedimentation, and filtration, along with
ozonation for primary disinfection. The MRWTP and the transmission pipeline are owned and operated
by MID and would provide treated surface water to the City by agreement.
3.1.2 Groundwater
Groundwater in the Waterford area is pumped from the Modesto Subbasin. The Modesto Subbasin is part
of the much larger San Joaquin Valley Groundwater Basin. The cities of Modesto, Oakdale, and
Riverbank, and the communities of Salida and Empire use groundwater to supply their service areas
(STRGBA 2005).
The groundwater basin is managed under the umbrella of the Modesto Subbasin Integrated Regional
Groundwater Management Plan (IRGMP). The subbasin is not currently adjudicated; however, it is
managed closely by Stanislaus and Tuolumne Rivers’ Groundwater Basin Association (STRGBA). It is
estimated in the IRGMP that 32% of the current agricultural supply in the area is met by groundwater.
Historically, groundwater has been depleted near Modesto, which resulted in a cone of depression
(STRGBA 2005). This cone of depression began recover in 1994 when the MRWTP surface water
treatment plant was constructed (STRGBA 2005) allowing for surface supply offset. Aside from localized
depressions, the groundwater levels have remained relatively consistent over 40 years (STRGBA 2005).
The total municipal safe yield of the subbasin is 50,000 acre-feet per year (AFY).
Until treated surface water supplies are available, the City will meet emerging demand through
groundwater. Currently, the City of Modesto owns 6 wells1 within Waterford to supply the existing
Modesto service area within the City of Waterford. The City of Waterford proposes to drill and construct
groundwater wells in the Primary Sphere and River Pointe areas to meet pre-2018 development demands
prior to the anticipated 2018 MRWTP supplies. Groundwater will also be used to supply areas that fall
outside of the MID service area within the Primary Sphere.
1
Only five wells are currently operational (TM: Hydraulic Evaluation of the City of Waterford Water System. West
Yost & Associates, November 3, 2004.).
Effective: June 2005 3-1City of Waterford Draft 2005 Urban Water Management Plan Chapter 3 Water Supply
DRAFT
3.2 Current Supply Determination
The City does not currently supply any water. The areas within the Primary Sphere and River Pointe are
currently supplied by MID (agricultural use) and private wells (agricultural and residential use, i.e.
farms). Though MID and private wells will continue to supply undeveloped areas, the City will begin
supplying water to all new urban development within the area as it is converted from agricultural use.
When buildout is reached, the City will supply the entire Primary Sphere and River Pointe areas. This
section outlines the analysis that was performed to determine the amounts of water currently being
supplied by MID and private wells within the Primary Sphere and River Pointe areas.
Demand estimates found in the Groundwater Management plan for the Modesto Subbasin (quoted below)
were used to estimate the ratio of surface supply (MID) verses groundwater supplies (private wells)
utilized to meet the current demand.
“The water demand for the Modesto groundwater Subbasin was estimated at 590,000 acre-feet for
water year 2000 (Burow et al. 2004). Surface water deliveries accounted for about 65%, or
360,000 acre-feet, of the total water supply. Groundwater accounted for about 35%, or about
200,000 acre-feet, of the total supply. Of the approximately 530,000 acre-feet used to meet
irrigation demand, 68% was surface water and 32% was groundwater. Of the approximately
56,000 acre-feet used to meet urban demand, 42% was supplied by surface water and 58% was
supplied by groundwater. Although two thirds of the wells in the study area are domestic wells,
the amount of water pumped has not been quantified.” (Page 71; STRGBA, 2005)
Based on the above information, it was assumed that of the 4,591 AFY of current agricultural demand
(detailed in Section 4.1.1), 68% (3,122 AFY) is supplied by surface water, and 32% (1,469 AFY) is
supplied by groundwater. One hundred percent of the current residential demand in the Primary Sphere
(34 AFY) and River Pointe demand (321 AFY; discussed in Section 4.1.2) is currently met by private
groundwater supplies. Therefore, the total current demand of 4,946 AFY is supplied by 3,122 AFY from
surface water (MID) and 1,824 AFY from groundwater (private wells).
3.3 Future Supply
The City will initially use groundwater to supply development growth within the service area. It is
anticipated that the MRWTP will be expanded in 2018, and the City will be able to purchase surface
water treated by MID at the MRWTP for potable use. An agreement with MID will be required to secure
this future surface water supply. MID water can be used only in the areas within the Primary Sphere that
are also within the MID service area. Since MID water cannot be distributed for use outside of their
service area, a small portion of groundwater supply will need to be available as development occurs
outside the MID service area (see Figure 2-2).
Figure 3-1 shows the current and projected supply scenario. Figure 3-1 shows that as development grows
within the service area, supplies will be made available as needed either through groundwater pumping or
treated surface water. As agricultural groundwater demands decrease, groundwater supplies become
available to meet urban demands.
Effective: June 2005 3-2City of Waterford Draft 2005 Urban Water Management Plan Chapter 3 Water Supply
DRAFT
Figure 3-1: Current and Projected Water Supplies to Meet Demand in the Service Area
7000
6000
Volume of Available Supply (AF)
5000
4000
Available Groundwater (City)
Available Surface Water (City)
3000
2000
1000
0
2000 2005 2010 2015 2020 2025 2030
Year
2018: Anticipated Water Treatment Plant Expansion
Table 3-1 summarizes the future available water supply scenario for the service area.
Table 3-1: Supply by Source Summary
2000 2005 2010 2015 2020 2025 2030
Supply Type (AFY) (AFY) (AFY) (AFY) (AFY) (AFY) (AFY)
City Surface Water
Supply Available (MID) 0 0 0 0 1873 2498 3122
City Groundwater Supply
Available 0 0 1397 2405 2699 2993 3286
Total Available Supply 0 0 1397 2405 4572 5490 6408
3.4 Exchange or Transfer Opportunities
Waterford not only lies within an area with significant agricultural consumption, but is proximate to other
service providers such as the Turlock Irrigation District (TID). Given these factors, exchange or transfer
opportunities do exist. At this time, when there is currently no development in the service area, these
opportunities are not necessary, but could be evaluated in the future.
3.5 Desalination
Due to a lack of proximate saline supplies and the prohibitive cost of conveyance, there are no
opportunities for the development of desalinated water in the City. Therefore, the City will not utilize
desalination as a source of supply available to meet its demands.
Effective: June 2005 3-3City of Waterford Draft 2005 Urban Water Management Plan Chapter 3 Water Supply
DRAFT
3.6 Wholesale Supplies
As the City begins supplying water to its service area, MID will be the sole wholesaler supplier. The
projected MID supplies available from MID to the City are shown below in Table 3-2. These projected
demands have been provided to MID.
Table 3-2: Available Wholesaler Supplies (Current and Projected) to the City (AFY)
Wholesaler 2005 2010 2015 2020 2025 2030
MID 0 0 0 1873 2498 3122
3.7 Summary of Supply
The City will supply new development within the service area with groundwater until 2018 when the
anticipated expansion of the MRWTP is complete. At this time the City will supply the areas within the
MID service area (approximately 86% of the service area) with treated surface water from the MRWTP.
The areas outside of the MID service area will be supplied by the City with groundwater. At buildout, the
City’s projected available surface water and groundwater supplies will be approximately 3,122 AFY and
3,286 AFY, respectively. The total available supply at buildout is estimated to be 6,408 AFY within the
service area.
Effective: June 2005 3-4City of Waterford Draft 2005 Urban Water Management Plan Chapter 4 Water Demand
DRAFT
Chapter 4 Water Demand
This chapter describes the urban water demands that will need to be met by the City’s supplies described
in Chapter 3. These demands are first described as current and future, and then broken down by land use
type (agriculture, residential, industrial and commercial). A summary of all demands is given in Section
4.5.
4.1 Current Water Demand
Although not supplied by the City, current agricultural demands within the service area were developed as
part of a Draft Technical Memorandum authored by RMC in October 2005 (RMC, 2005b). These
calculations were used as a basis for determining potential supplies available to the City through MID, but
are not considered to be a part of the service area urban demand.
The current urban water demand for the service area was estimated by determining the agricultural
demand and then summing those demands with the current residential demands. Currently in the service
area there are no demands for other land use types such as industrial, commercial, institutional, or
recreational. This is also true for past demands (Year 2000). For the purposes of this UWMP, the current
urban water demand within the service area is considered to be zero.
4.2 Future Water Demand Analysis
The following sections describe the methodologies used to estimate projected water demand for the
planned urban water use sectors of residential, industrial, and commercial use. It is anticipated that
development within River Pointe and the Primary Sphere will consist of low density residential,
industrial, and commercial users. Once again, any previously existing irrigation and residential demands
are excluded as they are not agricultural uses met by the City’s urban supply system.
4.2.1 Residential Demand
Population Projections – Primary Sphere and River Pointe Development
Population projections were based on current population (estimated from MetroScan data) and projecting
linearly to buildout. The population projections are shown in Table 2-4, in Section 2.4.2.
Water Demand Projections – Primary Sphere and River Pointe Development
Residential water demand was projected based on estimated development dwelling unit projections in
Table 2-3.
New development in similar parts of the state with large houses on small yards with water efficient
plumbing fixtures, have a water consumption of approximately 0.5 AFY/unit. In future revisions, actual
consumption rates based on data collected between 2005 and 2010 will be used. Therefore, for this
UWMP, dwelling unit estimates were multiplied by the assumed water consumption of 0.5 AFY/unit to
develop total projected water demands.
Table 4-1 shows the resulting projected residential water demand from 2005 to 2030 in 5-year increments.
The DWR 2005 UWMP Guidebook requests past water demand estimates. As previously stated, no water
was served by the City prior to 2005, however there was a residential demand of 34 AFY and the water
park (formerly located in the River Pointe area) demand of 321 AFY (355 AFY current total demand) in
2000. Demands in Table 4-1 include the water park for 2005. Following 2005, water park demands are
reduced to zero.
Effective: June 2005 4-1City of Waterford Draft 2005 Urban Water Management Plan Chapter 4 Water Demand
DRAFT
Table 4-1: Residential Water Demand in Service Area – Current and Projected
2000(1) 2005(2) 2010 2015 2020 2025 2030
Water Demand Total (AFY) 355 355 654 1273 1893 2512 3132
Water Demand within MID Service Area (AFY) 350 350 562 1095 1628 2161 2694
Water Demand outside of MID Service Area
(AFY) 5 5 92 178 265 352 438
1. 2000 water demands were met by MID surface water and private wells.
2. Water park demands are included for 2000-2005, but are zero in subsequent years.
Table 4-1 also differentiates between demands within and outside of the MID service area, as shown in
Figure 2-2. The majority of the City’s service area is within the MID service area, with the exception of
approximately 205 acres. This distinction is important when assessing supply alternatives to meet these
demand areas because MID water cannot be used to supply demands outside of the MID service area
(Chapter 3). Water demand was allocated proportionally according to total acreage. Of the total Waterford
service area, 14% (205 acres out of 1,490 acres; RMC 2005) was outside MID service area, so the
demand for this area was assumed to be 14% of the total residential demand for the entire Waterford
service area at buildout.
4.2.2 Industrial and Commercial Demand
At buildout, 7% of the total acreage is expected to be industrial land use and 3% of the total acreage is
expected to be commercial (RMC 2005). Currently there are no industrial or commercial water demands
in the Primary Sphere or River Pointe areas. Therefore, only future industrial and commercial demands
have been estimated.
Future Industrial and Commercial Demand
Industrial and commercial demands were estimated for buildout conditions. Once the industrial and
commercial buildout demands were determined, a linear relationship was used to calculate demand in five
year intervals from 2005-2030. The buildout demands were based on the estimated acreage of these land
uses at buildout. For industrial and commercial uses, estimates of 126 acres and 48 acres, respectively,
were used (RMC 2005).
Water use factors for industrial and commercial demands were based on estimates used for similar
development areas (MWH 2002). For industrial demands, a water use of 2.65 AFY/acre (2,366 gallons
per day (gpd/acre) was used (MWH 2002). For commercial demands, a water use factor of 2.91 AFY/acre
(2,600 gpd/acre) was used (MWH 2002).
Calculated water demand for industrial and commercial values are shown in Table 4-2. For the year 2000,
the demand is assumed to be equal to the current demand (0 AFY).
Table 4-2: Industrial and Commercial Water Demand – Current and Projected
2000 2005 2010 2015 2020 2025 2030
Industrial (AFY) 0 0 67 134 200 267 334
Commercial (AFY) 0 0 28 56 84 112 140
Total (AFY) 0 0 95 190 284 379 474
4.3 Sales to Other Agencies
The City does not currently sell water to other agencies, nor does it anticipate sales to other agencies in
the future.
Effective: June 2005 4-2City of Waterford Draft 2005 Urban Water Management Plan Chapter 4 Water Demand
DRAFT
4.4 Other Water Uses
Other water uses including saline barriers, groundwater recharge, conjunctive use, raw water, and
recycled water have not been identified for the service area at this time. Currently there is no water
service in the service area therefore system losses are 0%. As infrastructure is constructed a system loss of
5% is expected and will be evaluated in future plan updates.
4.5 Future Water Demand Summary
The future water demands for agricultural, residential, industrial and commercial uses, as well as total
demand for the service area are shown in Figure 4-1. Since the City is only responsible for residential,
industrial and commercial demands, agricultural demands are zero within the City.
Figure 4-1: Total Projected Water Demand by Sector within the Service Area
6000
Volume of Demand (AF)
Overall Demand
5000
4000 Residential Demand
3000
Industrial and Commercial
2000 Demand
Agricultural Demand
1000
0
2000 2005 2010 2015 2020 2025 2030
Year
Currently, there is a demand of 355 AFY for residential uses, and zero demand for industrial and
commercial uses. These demands are expected to increase as agricultural land is converted to urban uses.
As development commences, MID will continue to supply the agricultural demands within its service
area. For this reason, this UWMP only addresses demand generated by development (residential,
industrial and commercial demand).
The future total urban water demand for the City to meet is shown in Figure 4-2 and Table 4-3. Since the
current residential demand of 355 AFY is not supplied by the City, this demand is zero in the figure and
table. The remaining demands not met by the City will be supplied by existing private wells.
Effective: June 2005 4-3City of Waterford Draft 2005 Urban Water Management Plan Chapter 4 Water Demand
DRAFT
Figure 4-2: Total Projected Water Demand to be met by City within the Service Area
4000
Volume of Demand (AF)
3500
3000 Total Demand
2500
Residential Demand
2000
1500
Industrial and Commercial
1000 Demand
500
0
2000 2005 2010 2015 2020 2025 2030
Year
Table 4-3: Past, Current, and Future Water Demand Summary in Service Area
Water Use Single Multi- Comm- Ind- Land-
Sectors Family Family ercial1 ustrial2 Inst/Gov scape Total
Accounts 0 0 0 0 0 0 0
Metered Deliveries
(AFY) 0 0 0 0 0 0 0
2000
Accounts 0 0 0 0 0 0 0
Unmetered Deliveries
(AFY) 0 0 0 0 0 0 0
Accounts 0 0 0 0 0 0 0
Metered Deliveries
(AFY) 0 0 0 0 0 0 0
2005
Accounts 0 0 0 0 0 0 0
Unmetered Deliveries
(AFY) 0 0 0 0 0 0 0
Accounts 1308 0 11 1 0 0 1320
Metered Deliveries
(AFY) 654 0 28 67 0 0 749
2010
Accounts 0 0 0 0 0 0 0
Unmetered Deliveries
(AFY) 0 0 0 0 0 0 0
Accounts 2546 0 21 2 0 0 2569
Metered Deliveries
(AFY) 1273 0 56 134 0 0 1463
2015
Accounts 0 0 0 0 0 0 0
Unmetered Deliveries
(AFY) 0 0 0 0 0 0 0
Effective: June 2005 4-4City of Waterford Draft 2005 Urban Water Management Plan Chapter 4 Water Demand
DRAFT
Water Use Single Multi- Comm- Ind- Land-
Sectors Family Family ercial1 ustrial2 Inst/Gov scape Total
Accounts 3786 0 32 3 0 0 3821
Metered Deliveries
(AFY) 1893 0 84 200 0 0 2177
2020
Accounts 0 0 0 0 0 0 0
Unmetered Deliveries
(AFY) 0 0 0 0 0 0 0
Accounts 5024 0 42 3 0 0 5069
Metered
Deliveries 2512 0 112 267 0 0 2891
2025 Accounts 0 0 0 0 0 0 0
Unmetered Deliveries
(AFY) 0 0 0 0 0 0 0
Accounts 6264 0 53 4 0 0 6321
Metered Deliveries
(AFY) 3132 0 140 334 0 0 3606
2030
Accounts 0 0 0 0 0 0 0
Unmetered Deliveries
(AFY) 0 0 0 0 0 0 0
1. The number of commercial accounts was based on 2.65 AFY (2,357 gpd) per account.
2. The number of industrial accounts was based on 83 AFY (73,554 gpd) per account.
In summary, it was determined that the current water demand was 34 AFY for the Primary Sphere, and
321 AFY for the River Pointe area. Residential areas (with a population of 204) make up 34 AFY, and the
current water park demand makes up the other 321 AFY. At buildout, assumed to be in 2030, residential
demand is projected to increase to 3,132 AFY for a population of 18,792 within the service area.
Industrial and commercial demands are projected to increase from 0 AFY currently to 474 AFY in 2030.
Therefore the total demand at buildout for all land uses (residential, industrial and commercial) is
projected to be 3,606 AFY.
Effective: June 2005 4-5City of Waterford Draft 2005 Urban Water Management Plan Chapter 5 Demand
Management and
Chapter 5 Demand Management and Conservation
5.1 Demand Management Measures
Table 5-1 summarizes the Demand Management Measures (DMMs) discussed in this section.
Table 5-1: Demand Management Measures Implemented by the City
DMM Implemented
Number Demand Management Measure or Planned
Water survey programs for single-family residential and
1 multi-family residential customers 9
2 Residential plumbing retrofit 9
3 System water audits, leak detection, and repair 9
Metering with commodity rates for all new connections and
4 retrofit for existing connections 9
5 Large landscape conservation programs and incentives 9
6 High-efficiency washing machine rebate programs 9
7 Public information programs 9
8 School education programs 9
Conservation programs for commercial, industrial, an
9 institutional accounts 9
10 Wholesale agency programs 9
11 Conservation pricing 9
12 Water conservation coordinator 9
13 Water waste prohibition 9
14 Residential ultra-low-flush toilet replacement programs 9
Each of the following DMMs includes a brief description of the proposed program, the implementation
schedule through 2030, and methods that will be used to evaluate effectiveness.
5.1.1 DMM 1: Water Survey Programs for Single-Family Residential and Multi-Family
Residential Customers
Description
The City will implement a water survey program for residential units. The surveys will be available for
single-family homes (there are no multiple-family homes planned for the service area). The surveys will
be conducted by trained water surveyors who will evaluate the efficiency of home plumbing systems,
water usage on the property both indoors and outdoors, and will offer water savings measures. The indoor
survey will include checks for leaks at toilets, faucets, and meters, and flow-rate measurements from
showerheads and toilets. The surveyor will also offer suggestions regarding the replacement of
inefficient/high-flow devices. The outdoor survey will include inspection of the irrigation system and
control timers, along with a review of the irrigation schedule.
The surveys will be conducted to target high-use accounts, performed by customer request. The City will
allocate funds for approximately 2 surveys per year between 2005 and 2010.
Effective: June 2005 5-1City of Waterford Draft 2005 Urban Water Management Plan Chapter 5 Demand
Management and
Conservation
DRAFT
Implementation Schedule
The City will start providing the opportunity for water surveys to residents as move into the service area.
Effectiveness Evaluation
The effectiveness of DMM 1 will be measured by monitoring the number of requested and completed
surveys.
Conservation Savings
This DMM is not currently being implemented since no water is being served and therefore no actual
expenditures and savings can be determined. Projected expenditures by the City are $140 for a single-
family residence (CUWA 2004). The projected savings is approximately 14 gpd per survey at single-
family residences (CUWA 2004), and therefore a total projected of savings of 28 gpd per year for the
program. The savings decay rate is assumed to average approximately 15% per year due to equipment
failure, customer use error, and customer turnover (CUWA 2004). The City will discuss the concept of
working with other local water purveyors to streamline the program.
5.1.2 DMM 2: Residential Plumbing Retrofit
Description
The planned residences within the service area have not been constructed prior to 2005. The Energy
Policy and Conservation Act passed by the State in 1992 requires the installation of ultra-low-flow toilets
in all new homes. This relates to the plumbing retrofit in that there are zero (0) pre-1992 single- or multi-
family homes. This DMM will be implemented as homes are constructed. The new homes to be
constructed in the service area will be constructed with brand new plumbing so it is assumed that retrofits
will not be necessary for some time.
Implementation Schedule
Concurrent with development, DMM 2 will be implemented as housing construction begins. Construction
begins in mid 2005.
Effectiveness Evaluation
There are zero (0) pre-1992 single- or multiple-family homes in the annexation area. All homes planned
for construction will use brand new plumbing.
Conservation Savings
There will be no water savings since there is no old plumbing to retrofit2.
5.1.3 DMM 3: System Water Audits, Leak Detection, and Repair
Description
Water system audits, and leak detection and repair, will be implemented by the City. This measure will
detect inconsistencies including leaks, faulty meters and unauthorized water users. Currently, there is no
infrastructure upon which to conduct inspections. As infrastructure is constructed (approximately 27
miles planned – RMC 2005d), system water audits will begin taking place on an annual basis. Based on
2
If there were retrofits, projected expenditures by the City are approximately $65.56 per toilet (CUWA).
The projected savings is approximately 7 gpd per high-efficiency showerhead and aerators and a 23.6 gpd
per ultra-low-flow toilet installed (CUWA 2004).
Effective: June 2005 5-2City of Waterford Draft 2005 Urban Water Management Plan Chapter 5 Demand
Management and
Conservation
DRAFT
audit results, leak detection surveys will take place if water loss greater than 5% is identified. In addition
to annual audits, users will be expected to report leaks so repairs can be made as necessary. Leakage is
not expected to be significant, given that all infrastructure was constructed post-2004.
Implementation Schedule
The City will conduct annual water system audits and, as necessary, leak detection surveys. All water
pipes are inspected for leaks upon completion of construction.
Effectiveness Evaluation
The effectiveness of this DMM will be measured by the reduction in loss rates within the water
distribution system.
Conservation Savings
This DMM is not currently being implemented since no water is being served, and therefore no actual
expenditures and savings can be determined. The benefit for this DMM is typically a reduction in system
losses. Given the age of the infrastructure, the system loss rate is expected to be very low (City of Waterford Draft 2005 Urban Water Management Plan Chapter 5 Demand
Management and
Conservation
DRAFT
Conservation Savings
This DMM is currently being implemented with each new building. Actual expenditures are zero since
the building owner pays for the meter. Savings cannot be calculated since no pre-meter data is available.
5.1.5 DMM 5: Large Landscape Conservation Programs and Incentives
Description
The service area does not currently have any open space areas to be served by the City. As the area is
developed, any large landscape areas will be installed with dual pipes for irrigation to allow for the
potential future use of recycled water. Although recycled water supplies are not currently available, the
City anticipates its future development. In addition to dual plumbing, the City will conduct irrigation
water audits on landscape areas greater than 5 acres every three years. Landscaping staff will be expected
to report on and repair irrigation issues that will lead to increased water efficiency.
Implementation Schedule
As landscaped areas are developed, dual plumbing irrigation pipelines and fixtures will be installed.
Irrigation audits will be conducted as described above in order to detect water use inefficiencies.
Effectiveness Evaluation
Given that there are no large landscape areas currently within the service area, no savings can be
determined at this time. A reduction in water usage is expected in the future with the implementation of
water audits, and recycled water utilization.
Conservation Savings
This DMM is not currently being implemented because no water is being served and therefore no actual
expenditures and savings can be determined.
5.1.6 DMM 6: High-Efficiency Washing Machine Rebate Programs
Description
The City will offer a rebate for every high-efficiency washing machine installed in a residential home in
the service area by the home owner. The rebate will be set at $25 per high-efficiency washing machine. A
maximum of 40 rebates will be issued every year.
Implementation Schedule
The City will begin implementing the rebate program in 2008.
Effectiveness Evaluation
The number of rebates provided will measure the effectiveness of this DMM.
Conservation Savings
This DMM is not currently being implemented and therefore no actual expenditures and savings can be
determined. Projected expenditures by the City are expected to be $1500 per year ($1000 for rebates, and
$500 for administration).
Effective: June 2005 5-4You can also read