Characterization of the m6A- Associated Tumor Immune Microenvironment in Prostate Cancer to Aid Immunotherapy
←
→
Page content transcription
If your browser does not render page correctly, please read the page content below
ORIGINAL RESEARCH
                                                                                                                                          published: 31 August 2021
                                                                                                                                   doi: 10.3389/fimmu.2021.735170

                                          Characterization of the m6A-
                                          Associated Tumor Immune
                                          Microenvironment in Prostate
                          Edited by:      Cancer to Aid Immunotherapy
                         Peter Sims,
   Columbia University, United States
                                          Zezhen Liu 1†, Jiehui Zhong 1†, Jie Zeng 2†, Xiaolu Duan 1, Jianming Lu 2, Xinyuan Sun 1,
                       Reviewed by:       Qinwei Liu 1, Yingke Liang 2, Zhuoyuan Lin 3, Weide Zhong 2, Wenzheng Wu 3, Chao Cai 1*
                         Jiangbo Wei,     and Guohua Zeng 1*
 University of Chicago, United States
                          Kunqi Chen,     1 Department of Urology, Minimally Invasive Surgery Center, Guangdong Key Laboratory of Urology, Guangzhou Urology
               University of Liverpool,   Research Institute, The First Affiliated Hospital of Guangzhou Medical University, Guangzhou Medical University, Guangzhou,
                     United Kingdom       China, 2 Department of Urology, Guangdong Key Laboratory of Clinical Molecular Medicine and Diagnostics, Guangzhou
                 *Correspondence:         First People’s Hospital, School of Medicine, South China University of Technology, Guangzhou, China, 3 Department of
                      Guohua Zeng         Urology, The Second Affiliated Hospital of Guangzhou Medical University, Guangzhou Medical University, Guangzhou, China
         2008690094@gzhmu.edu.cn
                          Chao Cai
             chaocai85@hotmail.com
                                          The aim of this study was to elucidate the correlation between m6A modification and the
     †
      These authors have contributed
                                          tumor immune microenvironment (TIME) in prostate cancer (PCa) and to identify the m6A
                 equally to this work     regulation patterns suitable for immune checkpoint inhibitors (ICIs) therapy. We evaluated
                                          the m6A regulation patterns of PCa based on 24 m6A regulators and correlated these
                   Specialty section:
         This article was submitted to
                                          modification patterns with TIME characteristics. Three distinct m6A regulation patterns
                Systems Immunology,       were determined in PCa. The m6A regulators cluster with the best prognosis had
               a section of the journal   significantly increased METTL14 and ZC3H13 expression and was characterized by
              Frontiers in Immunology
                                          low mutation rate, tumor heterogeneity, and neoantigens. The m6A regulators cluster with
            Received: 05 July 2021
         Accepted: 16 August 2021         a poor prognosis had markedly high KIAA1429 and HNRNPA2B1 expression and was
         Published: 31 August 2021        characterized by high intratumor heterogeneity and Th2 cell infiltration, while low Th17 cell
                              Citation:   infiltration and Macrophages M1/M2. The m6Ascore was constructed to quantify the m6A
Liu Z, Zhong J, Zeng J, Duan X, Lu J,
Sun X, Liu Q, Liang Y, Lin Z, Zhong W,
                                          modification pattern of individual PCa patients based on m6A-associated genes. We
     Wu W, Cai C and Zeng G (2021)        found that the low-m6Ascore group with poor prognosis had a higher immunotherapeutic
          Characterization of the m6A-    response rate than the high-m6Ascore group. The low-m6Ascore group was more likely
           Associated Tumor Immune
 Microenvironment in Prostate Cancer      to benefit from ICIs therapy. This study was determined that immunotherapy is more
                to Aid Immunotherapy.     effective in low-m6Ascore PCa patients with poor prognosis.
          Front. Immunol. 12:735170.
    doi: 10.3389/fimmu.2021.735170        Keywords: m6A, Tumor Immune Microenvironment, Immunotherapy, PCa, prognosis

Frontiers in Immunology | www.frontiersin.org                                    1                                       August 2021 | Volume 12 | Article 735170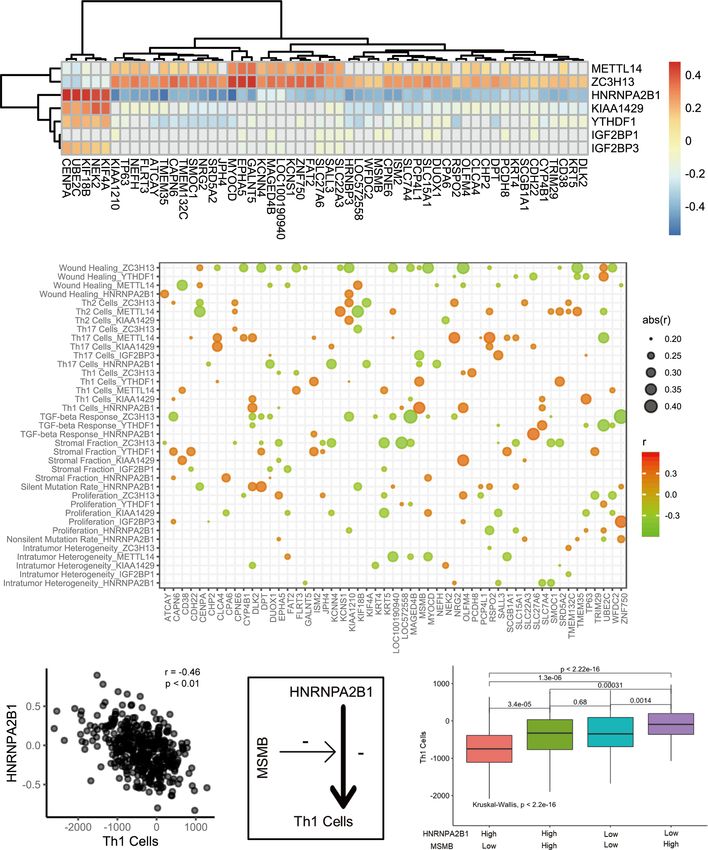
Liu et al.                                                                                                         m6A Modification and Efficacy of ICIs for PCa

INTRODUCTION                                                                          then perform a specific biological function (12). Accumulating
                                                                                      evidence shows that m6A RNA methylation has an outsize effect
Prostate cancer (PCa) is a serious threat to men around the world                     on RNA production/metabolism and participates in the
with mortality that is second only to lung cancer (1, 2). Radical                     pathogenesis of multiple diseases, including cancers (5). In a
surgery and radiation therapy are effective treatment methods for                     variety of tumors, there is a clear correlation between m6A
early PCa. Many people lack awareness of the need for PCa                             regulatory factors and patient prognostication, among which the
screening. Most patients are in advanced or late metastasis stages                    results of some tumor studies show that m6A regulatory factors
at the time of diagnosis. As a result, endocrine therapy has                          are related to tumor treatment (13). However, its mechanism of
become the preferred treatment. However, PCa is likely to enter                       action has yet to be further studied.
the drug-resistant stage from the hormone-sensitive stage after                           A large number of studies have found and confirmed that m6A
approximately 18 months of endocrine therapy. There is still no                       regulators play an important role in regulating the immune
effective treatment for PCa. Immunotherapy provides a new                             microenvironment of tumors. Fat mass and obesity-associated
paradigm in cancer treatment. Marked advances have been made                          protein (FTO) plays a role in immune evasion. Ruisu et al.
in the field of tumor treatment by immune checkpoint inhibitors                        reported two potent small-molecule FTO inhibitors that exhibit
(ICIs). However, recent phase II clinical trials (NCT02601014,                        strong antitumor effects in multiple types of cancers (14). FTO has
NCT02787005) revealed that ICIs are only effective for certain                        a similar antitumor effect on melanoma as a factor in anti-PD-1
patients, and the disease control rate does not exceed 20% in PCa                     resistance (13). The researchers proposed that the combination
(3, 4). Therefore, improving the defects of ICIs to increase their                    therapy of FTO inhibitors and anti-PD-1 blockade is beneficial to
clinical efficacy is an urgent problem to be solved.                                   attenuate resistance to immunotherapy in melanoma patients.
    To date, 172 kinds of RNA modifications have been identified.                       More attention has been recently paid to the function of m6A
The most common chemical modifications involve N6-                                     modification in the regulation of circRNAs. Researchers have
methyladenosine (m6A), N1-methyladenosine (m1A) and 5-                                revealed that YTHDF2, as an m6A reader, sequesters m6A-
methylcytosine (m5C). m6A is one of the most abundant                                 circRNA and plays an important role in suppressing innate
modifications in most eukaryotic mRNAs (5, 6). The m6A                                 immunity (15). m6A modification, as a reversible epigenetic
modification is the methylation of the sixth position of the                           modification, should be considered in the field of tumor therapy
nitrogen atom of adenosine, with the cellular methyltransferase                       (16). Dali Han et al. showed that YTHDF1 plays an antitumor role
substrate S−adenosylmethionine serving as the methyl donor for                        through mRNA m6A methylation in dendritic cells (DCs). Studies
m6A formation (7). The most prevalent RNA methylation, m6A,                           have shown that the antigen-specific CD8+ T cell antitumor
is a reversible RNA posttranscriptional modification (8, 9). A                         response in YTHDF1-deficient mice is significantly enhanced.
previous study revealed that m6A modification only occurs on                           The therapeutic efficacy of PD-L1 checkpoint blockade has been
mRNA; however, with the development of detection technology,                          markedly improved (17). In melanoma and colorectal cancer,
m6A methylation has been widely found in other types of RNAs                          ALKBH5 produces high levels of lactic acid in the tumor
such as transport RNA (tRNA) and ribosomal RNA (rRNA) (10).                           microenvironment (TME) and promotes the infiltration of
Similar to the modification of DNA, m6A modification is a kind of                       tumor-infiltrating Tregs and myeloid-derived suppressor cells.
dynamic reversible process that is regulated by methyltransferases,                   Inhibiting ALKBH5 could be conducive to antitumor
demethylases and binding proteins, also known as “writers”,                           immunotherapy (18). The malignancy, prognosis and antitumor
“erasers” and “readers”. Methyltransferases, also known as                            immune response in breast cancer are markedly correlated with
writers, promote m6A methylation modification in RNA (11).                             the expression pattern of m6A regulators (19).
The m6A writers include CBLL1, KIAA1429 (VIRMA),                                          In the field of PCa, research on m6A regulators is just
METTL14, METTL3, RBM15, RBM15B, WTAP, and ZC3H13.                                     beginning. Among them, the functions of FTO, YTHDF2, and
Demethylases (also known as erasers), including FTO and                               METTL3 have received special attention. Research on m6A will
ALKBH5, remove m6A methyl groups from RNA. Binding                                    further reveal the mechanisms of PCa occurrence, progression,
proteins (also known as readers), including YTHDF1, YTHDF2,                           and drug resistance. Unlike other cancer types, PCa is a slowly
YTHDF3, YTHDC1, YTHDC2, RBMX, LRPPRC, IGF2BP3,                                        progressing malignancy. The TME plays a substantial role in
IGF2BP2, IGF2BP1, HNRNPC, HNRNPA2B1, FMR1, and                                        influencing tumor progression (20). The purpose of this study
ELAVL1, can bind to the M6A methylation site in RNA and                               was to elucidate the relationships among 24 m6A regulatory
                                                                                      factors, the immune microenvironment and immunotherapy in
                                                                                      PCa and provide a research foundation for the influence of m6A-
Abbreviations: CNV, Copy number variation; DC, Dendritic cell; DEGs,                  related epigenetics on the immune microenvironment of PCa.
Differentially expressed genes; EMT, Epithelial-mesenchymal transition; GDC,
Genomic Data Commons; GSEA, Gene set enrichment analysis; ICB,
Immunological checkpoint blockade; ITH, Intratumor heterogeneity; m6A, N6-
methyladenosine; MSigDB, Molecular Signatures Database; NK cell, Natural killer
cell; PFS, Progression-free survival; PCA, Principal component analysis; SNV,         RESULTS
Single nucleotide variant; ssGSEA, Single-sample gene-set enrichment analysis;
TIME, Tumor immune microenvironment; PSA, Prostate-specific antigen; PCa,
Prostate cancer; ICIs, Immune checkpoint inhibitors; TME, Tumor
                                                                                      Landscape of 24 m6A Regulators in PCa
microenvironment; GS, Gleason score; CR, Complete remission; PR, Partial              A total of 24 m6A regulators, including 8 writers, 2 erasers, and
remission; SD, Stable disease; PD, Progressive disease.                               14 readers, were finally identified in this study. The differential

Frontiers in Immunology | www.frontiersin.org                                     2                                 August 2021 | Volume 12 | Article 735170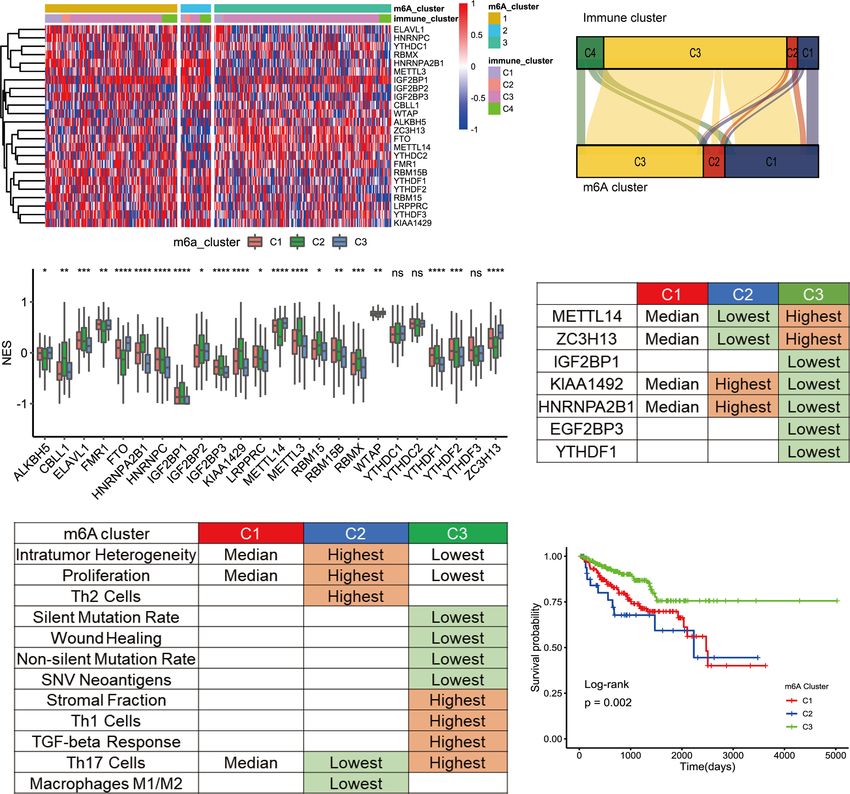
Liu et al.                                                                                             m6A Modification and Efficacy of ICIs for PCa

mRNA expression of m6A regulators between PCa tissues and                  visualized in Figure 2B. The results of the chi-square test
normal tissues was analyzed (Figure 1A). Compared to that in               suggested that there were significant differences among
normal prostate tissues, the expression level of each eraser (FTO,         different immune types in the 3 kinds of m6A regulation
ALKBH5) was significantly decreased in PCa tissues. Among all               patterns (chi-square test, p
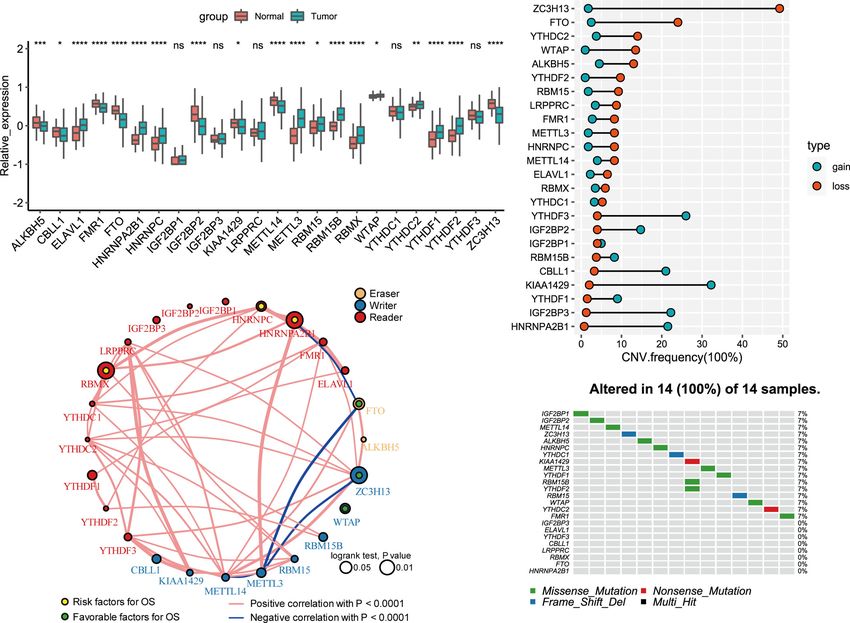
Liu et al.                                                                                         m6A Modification and Efficacy of ICIs for PCa

The Relationship Between the Key Genes                                 mutation frequency (Figure S5E, C2 versus C3; Figure S5F, C1
and Immune Functions of the Three                                      versus C3).
m6A Subtypes                                                               The m6A methylation modification patterns and TME
The above analysis identified the key genes and immune                  immune infiltration were closely related to the prognosis of
characteristics of the three m6A regulators clusters. We sought        PCa patients. To further investigate CEGs regulated by m6A
to determine whether these key gene markers were associated            methylation modification, we calculated the differential genes
with the immune phenotypes of tumors among three m6A                   among the m6A regulators clusters (p2).
regulators clusters (Figure 3A). We then examined the specific          The key DEGs were obtained by taking the intersection of the
correlation between 12 immune signature scores and 7 m6A               three groups of DEGs. Unsupervised clustering analyses were
regulators using Spearman’s correlation analyses (Figure 3B).          performed to further validate the m6A modification model based
The results suggested that key m6A genes were involved in              on CEGs. PCa patients were classified into three expression
multiple immune-associated signatures, including the TGF-beta          patterns again. We termed these patterns gene cluster 1, gene
response signature, Th1 cell signature, Th17 cell signature, Th2       cluster 2 and gene cluster 3 (Figure S6A). PCA confirmed that a
cell signature and ITH signature. We found that METTL14 and            significant distinction existed in the m6A transcriptional profiles
ZC3H13 were positively correlated with Th1 cell signature, Th17        of the three different gene clusters (Figure S6B). As prognostic
cell signature, and Th2 cell signature. YTHDF1, HNRNPA2B1,             analysis showed, gene cluster 3 was markedly related to poorer
KIAA1429, IGF2BP1, and IGF2BP3 showed significant negative              survival, while gene cluster 1 and gene cluster 2 were
correlations. Thus, the effect of METTL14 and ZC3H13 was               characterized by prolonged survival (Figure S6C). Next, we
opposite to that of YTHDF1, HNRNPA2B1, KIAA1429, IGF2BP1,              sought to determine whether there was a relationship between
and IGF2BP3 in immunity. Notably, the HNRNPA2B1 and Th1                m6A regulators clusters and gene clusters. The results showed
cell signatures (r=-0.46, p
Liu et al.                                                                                                                     m6A Modification and Efficacy of ICIs for PCa

             A                                                                                       B

             C

                                                                                                     D

  FIGURE 1 | Landscape of genetic and expression variation of 24 m6A regulators in prostate cancer. (A) The expression of 24 m6A regulators between normal
  tissues and prostate cancer tissues. Tumor, red; Normal, blue. The upper and lower ends of the boxes represented interquartile range of values. The lines in the
  boxes represented median value, and black dots showed outliers. The asterisks represented the statistical p value (*P < 0.05; **P < 0.01; ***P < 0.001; ****P <
  0.0001); ns, Not Statistically significant. (B) The CNV variation frequency of m6A regulators in TCGA database. The width of the Dumbbell Chart represented the
  alteration frequency. The deletion frequency, blue dot; The amplification frequency, red dot. (C) The interaction between m6A regulators in gastric cancer. The circle
  size represented the effect of each regulator on the prognosis, and the range of values calculated by Log-rank test was p < 0.01, p < 0.05, respectively. Yellow dots
  in the circle, risk factors of prognosis; Green dots in the circle, protective factors of prognosis. The lines linking regulators showed their interactions, and thickness
  showed the correlation strength between regulators. Negative correlation was marked with blue and positive correlation with red. The regulator type Eraser, Writer,
  Reader was marked with yellow, blue, red respectively. (D) The waterfall plot of tumor somatic mutation established for 24 m6a regulators. Each column represented
  individual patients. The number on the right indicated the mutation frequency in each gene. The down bar plot showed the proportion of each variant type.

Th1 cells (Figure 4D). The patients were divided into high and                            based on these phenotype-related genes, we constructed a set of
low groups according to the median expression levels of                                   scoring systems to quantify the m6A modification pattern of
HNRNPA2B1 and MSMB. Four groups were classified by                                         individual patients with PCa, which was termed the m6Ascore.
pairwise combination. In the high HNRNPA2B1 group, the                                    The cluster of m6A regulators and the CEGs were classified into
Th1 cell signature score was elevated when MSMB was                                       three categories, but two distinct prognoses were demonstrated
overexpressed. Similarly, in the low HNRNPA2B1 group, the                                 by survival analysis. We sought to determine whether there was a
Th1 cell signature score was also elevated when MSMB was                                  potential link between gene expression modification and
overexpressed (Figure 4E). This result was consistent with the                            prognostic classification. Therefore, PCA of CEGs was used to
heatmap results. In conclusion, MSMB is a potential factor by                             distinguish high and low m6Ascore. Then, clinical characteristics
which HNRNPA2B1 inhibits Th1 cell infiltration.                                            and prognosis were investigated. Kaplan-Meier survival analysis
                                                                                          indicated that the high-m6Ascore group had a better prognosis
m6A Score Construction                                                                    than the low-m6Ascore group (Figure 5A). We analyzed the
The above analyses were based on m6A methylation                                          relationships among the m6A regulators clusters, immune
modification and could accurately reflect the expression                                    clusters, gene clusters and m6Ascore groups (Figure 5B). A
pattern of m6A regulators in PCa. Considering the need for                                total of 95.83% of patients in m6A regulators cluster 3, with good
more accurate and clear models for immunotherapy prediction,                              prognosis, were included in the high-m6Ascore group. A total of

Frontiers in Immunology | www.frontiersin.org                                         5                                         August 2021 | Volume 12 | Article 735170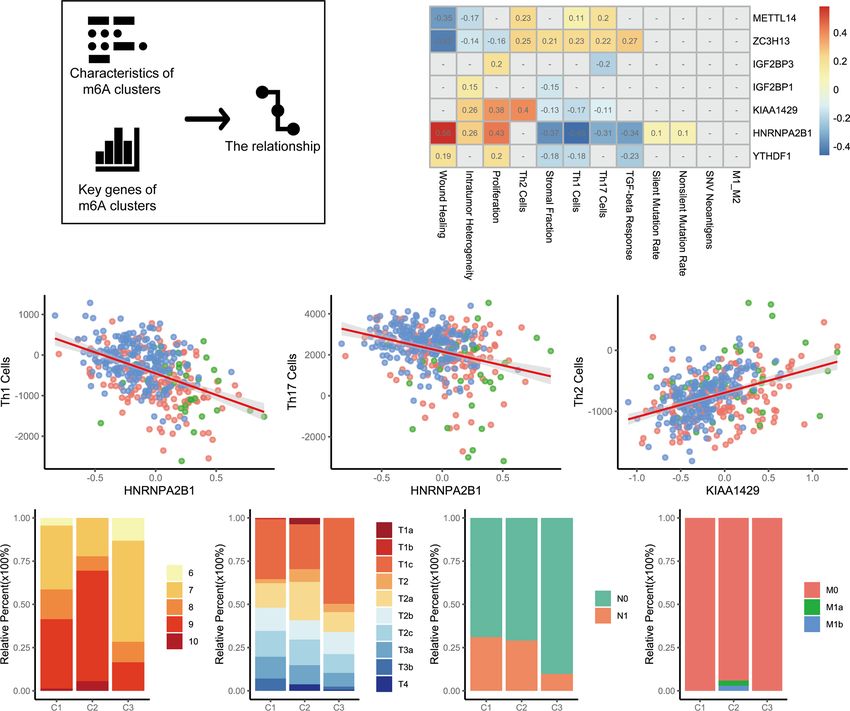
Liu et al.                                                                                                                  m6A Modification and Efficacy of ICIs for PCa

             A                                                                                             B

             C                                                                                         D

             E                                                                                         F

  FIGURE 2 | TME cell infiltration characteristic of m6A regulation patterns. (A) The cluster was used to identify three expression patterns of 24 m6A regulators in 498
  prostate cancers. Standardize the expression of each gene. (B) Alluvial diagram showing the changes of m6A regulators clusters and immune clusters of the
  prostate cancer samples. (C) The expression of 24 m6A regulators in three clusters. cluster1, red. cluster2, green, cluster3, blue. The upper and lower ends of the
  boxes represented interquartile range of values. The lines in the boxes represented median value, and black dots showed outliers. The asterisks represented the
  statistical p value (*P
Liu et al. m6A Modification and Efficacy of ICIs for PCa
plot reflects the difference in m6A regulators (Figure S7A), group was higher than that in the low-m6Ascore group
CEGs (Figure S7B) and immune-associated signatures (Figure (p=0.0005, Fisher’s exact test) (Figure 5I). The prostate-
S7C) between the high- and low-m6Ascore groups. specific antigen (PSA) concentration in the high-m6Ascore
There were significant differences in the clinical group was lower than that in the low-m6Ascore group
characteristics between the two groups. The proportion of less (Figure 5J). Furthermore, tumor-associated biological
invasive lesions (T1 and T2 stage) was significantly higher in the functions were compared (Figure 5K). In summary, the
high-m6Ascore group (p=0.01499, Fisher’s exact test) m6Ascore reflects not only the m6A modification model but
(Figure 5F). The percentage of lymph node metastasis was also PCa prognosis. Therefore, it is a concise and explicit
lower in the high-m6Ascore group (p=0.00014, Pearson’s chi- scoring system.
squared test) (Figure 5G). Distant metastasis of PCa occurred in
only the low-m6Ascore group (p=0.1278, Fisher’s exact test) The Role of m6A Regulation Patterns in
(Figure 5H). The Gleason score (GS) is an established predictor Anti-PD-1/L1 Immunotherapy
of progression risk in treated and untreated PCa patients. Immunotherapy is a major breakthrough in cancer therapy.
Subgroup analysis for the GS of PCa showed that the Based on the relationship between m6A modification and
proportion of low-grade cancer (GS ≤ 7) in the high-m6Ascore immune cell infiltration in PCa, we further investigated
A B
C D E
F G H I
FIGURE 3 | The relationship between m6A genes and characteristics among three m6A regulators clusters. (A) The schematic diagram. (B) The heatmap shown
that correlation between 7 m6A genes and characteristics of m6A regulators clusters. Positive correlation was marked with red. Negative correlation was marked
with blue. The correlation coefficient was showed in square box. “NA” means p>0.05. (Spearman test). (C–E). Scatter diagram were showed the correlation between
Th1 cells and HNRNPA2B1, Th17 Cells and HNRNPA2B1, Th2 Cells and KIAA1429. (F) Differences in Gleason score among three m6A regulators clusters. (p=0.009).
(G) Differences in distant metastasis among three m6A regulators clusters. (p=0.008) (H) Differences in regional lymph node metastasis among three m6A regulators
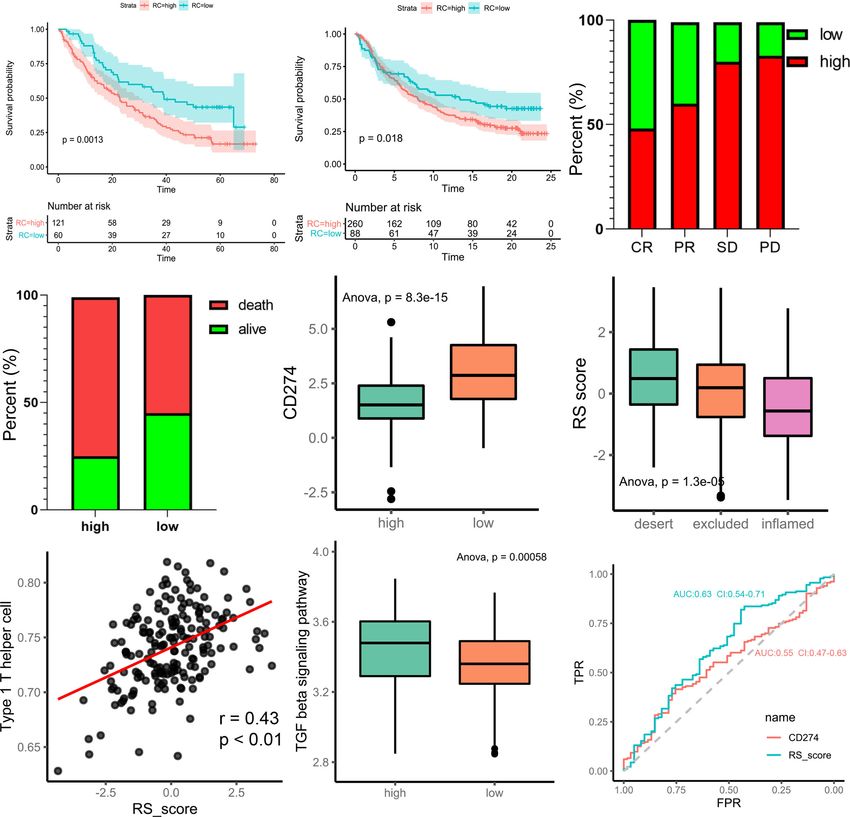
clusters. (pLiu et al. m6A Modification and Efficacy of ICIs for PCa whether m6A modification is related to the effect of tumor ICI therapy. Our findings will contribute to individualized immunotherapy. Two immunotherapy datasets were used for immunotherapy for patients with PCa. analysis (IMvigor210 and GSE78220). Interestingly, similar m6A regulators are highly involved in cancer progression, results were obtained from the two datasets, in which patients including tumorigenesis (24), angiogenesis (25), and metastasis treated with ICIs in the low-m6Ascore group showed better (26). Accumulating evidence indicates that m6A modification survival outcomes (IMvigor210, Figure 6A; GSE78220, often plays a dual role (27, 28). On the one hand, aberrant m6A Figure 6B). This finding is contrary to previous results methylation may result in both the upregulation of oncogenes showing that patients with a high m6A score have a better and the silencing of tumor suppressor genes, which fosters prognosis. Taking IMvigor210 as an example, we further cancer progression. On the other hand, m6A RNA methylation analyzed the response to immunotherapy. The response rate of can be regulated by the expression of m6A regulators and the immunotherapy in the low-m6Ascore group was significantly activity of m6A enzymes, thereby further affecting tumor higher than that in the high-m6Ascore group. The proportions of progression. Based on the interactions among m6A regulators patients with a high m6Ascore who achieved complete remission in PCa, we revealed the trends of m6A readers, writers and (CR), partial remission (PR), stable disease (SD), and progressive erasers. The expression levels of all erasers were decreased, while disease (PD) were 48%, 60%, 80%, and 83%, respectively (p < the expression levels of a majority of readers were significantly 0.0001, chi-square test) (Figure 6C). The prognosis of increased. This trend indicates that the m6A RNA methylation immunotherapy showed a marked difference between the high- process was enhanced in PCa. Furthermore, these factors and low-m6Ascore groups (p
Liu et al.                                                                                                             m6A Modification and Efficacy of ICIs for PCa

                A

                B

                C                                          D                                  E

  FIGURE 4 | The correlation of m6A regulators, immune cells and m6A associated genes. (A) The heatmap represented the correlation between key m6A regulators
  and key m6A associated genes. positive correlation was marked with red. negative correlation was marked with green. grey means p>0.05. (B) Bubble shown mean
  of correlation coefficient among m6A regulators, immune cells and m6A associated genes. The text on the left indicated the m6A regulators and immune cells. The
  text on the low represent m6A associated genes. mean of correlation coefficient were marked with size and color of circle. (C) The correlation between Th1 Cells
  and HNRNPA2B1. (D) The schematic diagram. (E) The median split was used to compare the effects of HNRNPA2B1 and MSMB on Th1 infiltration.

were highly expressed in m6A regulators cluster 2, which was linked                  PCa and impacts disease progression. At present, there are few
to worse clinical outcomes. KIAA1429 has been indicated to be an                     studies on HNRNPA2B1-mediated m6A modification in PCa;
oncogene in liver cancer (33), breast cancer (34), gastric cancer (35),              however, the effect of HNRNPA2B1 on immune cell infiltration
and osteosarcoma (36). HNRNPA2B1 is significantly upregulated in                      has gradually been noticed.

Frontiers in Immunology | www.frontiersin.org                                    9                                      August 2021 | Volume 12 | Article 735170
Liu et al. m6A Modification and Efficacy of ICIs for PCa
A B
C D E
F G H I
J K
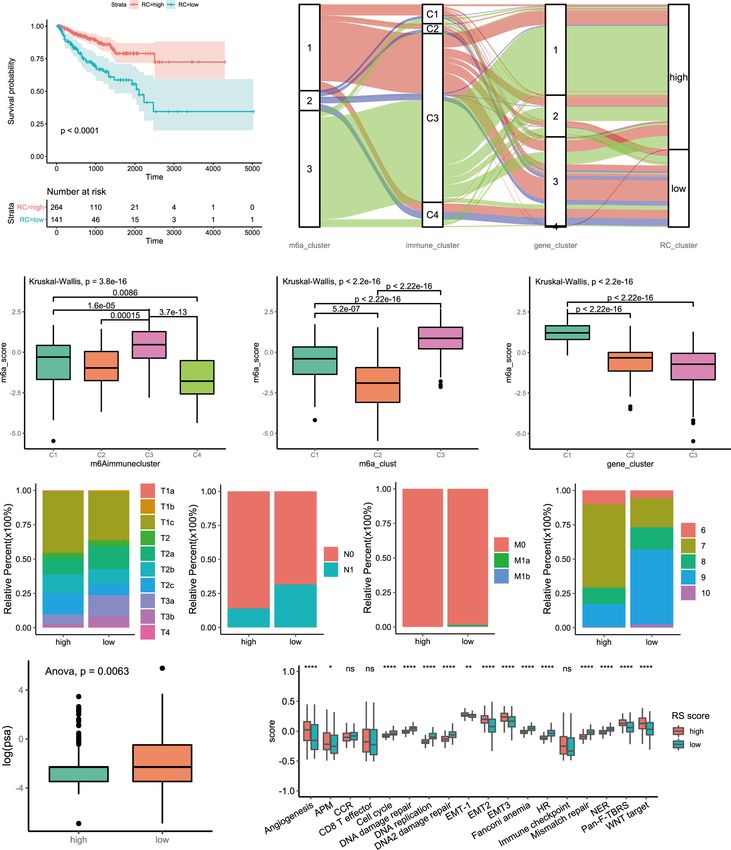
FIGURE 5 | Construction of m6A signatures. (A) Survival analyses for low (264 cases) and high (141 cases) m6A risk score patient groups using Kaplan-Meier
curves (P < 0.0001, Log-rank test). High risk score group is better than low risk score group. low risk scoring group has a higher risk. (B) Alluvial diagram represented
the changes of m6A regulators clusters, immune clusters, differential genes clusters and risk score clusters of the prostate cancer samples. (C) Differences in m6Ascore among
different immune subtypes. (D) Differences in m6Ascore among different m6A regulators clusters. (E) Differences in m6Ascore among different m6A associated difference genes
clusters. (F) Differences in primary tumor stage between high and low risk score groups. (p=0.015) (G) Differences in regional lymph node metastasis between high and low risk
score groups. (p=0.001) (H) Differences in distant metastasis between high and low risk score groups. (p=0.1652) (I) Differences in Gleason score between high and low risk
score groups. (p=0.005) (J) Differences in PSA between high and low risk score groups. (p=0.001) (K) The score of tumors associated signature between high and low risk
scores groups. high risk score group, red. low risk score group, green. The upper and lower ends of the boxes represented interquartile range of values. The lines in the boxes
represented median value, and black dots showed outliers. The asterisks represented the statistical p value (*PLiu et al. m6A Modification and Efficacy of ICIs for PCa
This study synthetically analyzed the TME immune cell patients. Therefore, m6Ascore was used to not only distinguish
infiltration characterization of distinct m6A methylation the m6A expression patterns but also directly reflect prognosis.
modification patterns and the m6A transcriptional profile. m6A Our results revealed that the m6Ascore was related to the effect
regulators cluster 3, with high expression of METTL14 and of immunotherapy. Among those who did not receive
ZC3H13, was characterized by increased Th1 cells, Th17 cells, immunotherapy, the high m6Ascore group had a better
stromal fraction and TGF-beta response. Among them, an increase prognosis. In comparison, patients who received immunotherapy
in stromal fraction indicates less malignancy. Antitumor immune who were in the low m6Ascore group also had a better survival
responses are triggered by Th1 cells. Th17 cells are a favorable outcome. The potential cause of this result was the higher mutation
prognostic indicator in PCa (37). Additionally, Th17 cells are rate of the low m6Ascore group, accompanied by the release of SNV
related to the efficacy of PD-1 blockade treatment in PCa (38). neoantigens and ITH. The higher the mutation rate in tumor tissue
Here, the survival analysis results suggested that patients with is, the more accumulated immunogenicity is released, and the better
high Th17 infiltration showed a significantly better prognosis in the treatment efficacy (45, 46). As important tumor antigens for the
PCa. We speculated that the infiltration of Th1 cells and Th17 cells human immune system, neoantigens have emerged from studies of
contributes to the good clinical outcomes of m6A regulators cluster novel ICIs targeting CTLA4 and PD1, which are expressed by
3. However, the TGF-beta response that is also upregulated in m6A activated T cells (47, 48). Bojan Losic et al. found that the area with
regulators cluster 3 deserves closer attention. Shiping Jiao et al. the lowest tumor purity level is the area with the highest extent of
found that TGF-beta can inhibit the Th1 response, thus reducing immune infiltration. The degree of immune infiltration correlates
the effect of ICIs (39–41). Surprisingly, this is consistent with our well with ITH in liver cancer (49). This is consistent with our
results regarding the efficacy of immunotherapy. m6A regulators observation in PCa. However, they also found an inverse association
cluster 3 was mainly involved in the high m6Ascore group, which between ITH and the immune checkpoint response in liver cancer.
was related to better, marked treatment outcomes. This might be a Conversely, we concluded that patients with high tumor
pivotal reason for poor responses to immunotherapy in m6A heterogeneity responded better to immunotherapy. A few possible
regulators cluster 3. reasons may explain this. On the one hand, tumor heterogeneity
Recent findings have shown that m6A regulators play responds differently to immunoreactivity (50–52). On the other
important and diverse biological functions by directly or hand, the immunotherapy response is not solely determined by
indirectly regulate expression of downstream. The downstream tumor heterogeneity.
reflect the biological function of m6A regulators. To better In conclusion, our work demonstrated three m6A regulation
understand the role of m6A regulators in prostate cancer we patterns for PCa and identified the characteristics of the
performed the analysis of downstream. Results reveal that transcriptome and immune infiltration in individual m6A
HNRNPA2B1 and ZC3H13 play an essential role. Multiple regulation patterns. This study not only describes the functions
studies have confirmed that HNRNPA2B1 closed related to of m6A regulators but also reveals the underlying causes of
prostate cancer progression (42–44). Whereas, the two have different clinical outcomes and immunotherapy responses in
opposite effects on downstream. Th1 signaling and survival distinct m6A regulation patterns. A comprehensive evaluation
analysis were consistent with this finding in our study. Further of individual m6A regulation patterns will contribute to
analysis found that MSMB is a key intermediate factor. Currently, enhancing our deep understanding of immune-cell
the relationship between HNRNPA2B1 and ZC3H13 is unclear. characterization of PCa and help us to develop personalized
These results suggested that the two may be balanced with each immunotherapy strategies to manage PCa patients.
other to act on downstream genes to jointly regulate prostate
cancer progression. The detailed mechanisms need further
exploring and investigating in the future. METHOD
This study conducted cluster analysis of multiple dimensions
in PCa, including m6A regulators clusters, immune clusters and PCa Dataset Source
CEGs clusters. The expression of 24 m6A regulators was The workflow of our study is shown in Figure S1. The RNA
classified into three distinct m6A regulation patterns. The sequencing (RNA-seq) (https://tcga.xenahubs.net/download/
interactions among m6A regulators could carry out the TCGA.BRCA.sampleMap/HiSeqV2_PANCAN.gz), gene
function of m6A methylation or demethylation. The m6A mutation and clinical data of 495 PCa patients were extracted
regulators clusters indicated that tumor cells regulate their from The Cancer Genome Atlas (TCGA) dataset (http://
function in different RNA regulation patterns. The CEGs cancergenome.nih.gov/). The copy number variation (CNV)
clusters were assessed to explore potential regulatory factors data were downloaded from Broad GDAC Firehose (https://
that exert their biological functions in different m6A gdac.broadinstitute.org/). Immune cell fraction data were
expression patterns. In other words, the CEGs clusters reflect downloaded from CIBERSORT (https://cibersort.stanford.edu/).
the biological functions related to m6A regulator expression
patterns. Survival differences in distinct patterns suggest that Unsupervised Clustering of 24
m6A regulation patterns have a significant effect on the survival m6A Regulators
of PCa patients. However, the classification of three m6A The 24 m6A regulators included 8 writers (WTAP, KIAA1429,
regulators clusters cannot clearly reflect the prognosis of CBLL1, RBM15, RBM15B, ZC3H13, METTL3, and METTL14),
Frontiers in Immunology | www.frontiersin.org 11 August 2021 | Volume 12 | Article 735170Liu et al. m6A Modification and Efficacy of ICIs for PCa
A B C
D E F
G H I
FIGURE 6 | m6A regulation patterns in the potential role of anti-PD-1/L1 immunotherapy. (A) Survival analyses for low-risk scores (60 cases) and high-risk scores
(121 cases) using Kaplan-Meier curves (patients with Advanced ccRCC enrolled in prospective clinical trials of treatment with PD-1 blockade. P = 0.0013, Log-rank
test). The prognosis of immunotherapy in high-risk scores cohort is poor. (B) Survival analyses for low-risk scores (88 cases) and high-risk scores (260 cases) using
Kaplan-Meier curves (IMvigor210 cohort. P = 0.018, Log-rank test). (C) Differences of m6Ascore among CR, PR, SD, PD. (CR, complete response. SD, stable disease.
PD, progressive disease. PR, partial response.) (D) Proportion of deaths difference between high and low risk scores. (Chi-square test, pLiu et al. m6A Modification and Efficacy of ICIs for PCa
other two groups, with significant differences. P value less than patients. In the formula, “i” represents m6A phenotype-related
0.05 was regarded as a significant difference. genes.
Gene Set Enrichment Analysis (GSEA) and m6score = o(PC1i + PC2i )
Biological Function Analysis
To better understand the different biological functions of m6A Multiple Co-Expression Analysis
modifications, GSEA was performed to functionally annotate The relationship between m6A regulators and the characteristics
genes (18). The gene sets of “h.all.v7.2.symbols.gmt” were of the tumor immune microenvironment (TIME) in PCa was
downloaded from the Molecular Signatures Database confirmed in our study. To further investigate the influence of
(MSigDB) for GSEA (https://www.gsea-msigdb.org/gsea/index. the co-expression genes (CEGs) of the 24 m6A regulators on the
jsp). The GSEA R package was used to compute the enrichment relationship between m6A regulators and the characteristics of
scores and simulated enrichment scores. Adjusted P values less the TIME, multiple co-expression analysis was performed.
than 0.05 were considered statistically significant. The m6A modification model-associated m6A regulators and
m6A modification model-associated immune signature were
Analysis of Somatic Mutations obtained from the characteristics of distinct m6A regulators
Somatic mutation data were downloaded from the GDC data clusters. The m6A regulators included METTL14, ZC3H13,
portal (https://portal.gdc.cancer.gov/). The “Masked Somatic IGF2BP1, KIAA1429, HNRNPA2B1, IGF2BP3, and YTHDF1.
Mutation” data were selected. The maftools R package provides The signatures included Th2 cells, silent mutation rate, wound
multiple analysis modules to perform the visualization healing, intratumor heterogeneity (ITH), non-silent mutation
process (19). rate, proliferation, single-nucleotide variant (SNV) neoantigens,
stromal fraction, Th1 cells, TGF-beta response, Th17 cells, and
Estimation of TME Cell Infiltration macrophage I/macrophage II (m1_m2). The overlapping genes
CIBERSORT is a deconvolution algorithm for quantifying cell that were extracted from the DEGs of three m6A regulators
fractions from bulk tissue gene expression profiles that was clusters (54 genes) were regarded as CEGs.
reported by Newman et al. (20). CIBERSORT can accurately The procedures for multiple co-expression analysis were as
estimate the immune composition of a tumor biopsy. The follows. Step 1: 60% of the 405 samples were randomly selected
relative abundances of immune cells and immune-associated for subsequent analysis. Step 2: the correlations between the
signatures were quantified by Thorsson et al. with CIBERSORT. expression of 7 regulators and signature scores were calculated
The CIBERSORT results were derived from the website (https:// using Spearman correlation analysis. P values less than 0.05 were
gdc.cancer.gov/about-data/publications/panimmune) (21). The considered relevant. The correlation coefficient was recorded as
relative abundance of Th1/Th2/Th17 cell infiltration in the r1. The median expression levels of the m6A-associated genes
PCa microenvironment was calculated by the single-sample were calculated for further analysis. Step 3: 100 medians and r1s
gene set enrichment analysis (ssGSEA) algorithm. The relative were obtained by repeating step 1 and step 2 100 times. The
abundance of TME cell infiltration was used to estimate the correlation coefficients and P values between the 100 medians
relationship between immune cells and progression-free survival and r1s were calculated with Spearman correlation.
(PFS) or overall survival (OS) by univariate Cox analysis and
differential expression among m6A subclusters.
Statistical Analysis
Generation of the m6Ascore For quantitative data, comparisons between two groups were
To identify the most suitable evaluation index of m6A regulation analyzed by t-test, Student’s t-test or the Wilcoxon signed-rank
patterns in PCa, we constructed multiple evaluation criteria, test. The Kruskal-Wallis test and ANOVA were used for the
including m6A regulators clusters, gene clusters and the assessment of multiple groups. The chi-square test was performed
m6Ascore. The m6A regulators clusters and gene clusters were to analyze qualitative data. Spearman’s correlation was calculated for
obtained from unsupervised clustering. The gene clusters were the correlation of different mRNA and protein expression levels.
identified to verify the stability of the m6A regulators clusters by The survminer R package was used to determine the cut-off
the consensus clustering algorithm. The m6Ascore is a set of point of each dataset subgroup. The “surv-cutpoint” function,
scoring systems to evaluate the m6A regulation patterns of which repeatedly tests all potential cut points to find the
individual patients with PCa. The procedures for the maximum rank statistic, was applied to dichotomize the
construction of the m6A gene signature were as follows. The m6Ascore. Then, the patients were divided into high- and low-
differentially expressed genes (DEGs) of individual m6A m6Ascore groups based on the maximally selected log-rank
regulators clusters were screened using the limma R package. statistics to decrease the batch effect of the calculation. The
Overlapping genes that were extracted from three different m6A Kaplan-Meier method and log-rank test were used to generate
regulators clusters were identified as key DEGs. Principal the survival curves of the prognostic analysis. The specificity and
component analysis (PCA) was used to construct the sensitivity of the m6Ascore were assessed through receiver
m6Ascore with the key DEGs. Both principal components 1 operating characteristic (ROC) curves, and the area under the
and 2 were selected as signature scores. This method makes it curve (AUC) was quantified using the pROC R package. All the
easier to evaluate m6A regulation patterns in individual PCa tests were two sided, and P < 0.05 was regarded as statistically
Frontiers in Immunology | www.frontiersin.org 13 August 2021 | Volume 12 | Article 735170Liu et al. m6A Modification and Efficacy of ICIs for PCa
significant. All of the analyses were performed with R software Supplementary Figure 1 | Flowchart depicting the workflow of this study.
(version 4.01, http://www.R-project.org).
Supplementary Figure 2 | Table shown that relationship between m6A
regulators clusters and immune clusters in the prostate cancer. colnames are
immune clusters. rownames are m6A regulators clusters.
DATA AVAILABILITY STATEMENT
The original contributions presented in the study are included in Supplementary Figure 3 | The histogram shows the comparison of 12
characteristic scores among three m6A regulators clusters.
the article/Supplementary Material. Further inquiries can be
directed to the corresponding authors.
Supplementary Figure 4 | (A) Venn Diagram showed that 9 hallmarks were
obtained from the intersection. C1_C2 represent the different hallmark between
cluster1 and cluster2. C1_C3 represent the different hallmark between cluster1 and
AUTHOR CONTRIBUTIONS cluster3. C2_C3 represent the different hallmark between cluster2 and cluster3.
(B) GSEA analysis of 50 hallmarkers.
ZZL and JHZ designed this work. ZZL, JHZ, XD, and YL
integrated and analyzed the data. ZZL and JZ wrote this Supplementary Figure 5 | (A) Cluster1. The first column represented tumor
manuscript. ZZL, CC, XD, JL, XS, QL, YL, ZYL, WZ, and GZ associate signaling pathway. The second column shown the number and
edited and revised the manuscript. All authors contributed to the proportion of mutated genes in signaling pathway. The third column indicated
mutation patients. (B) Cluster2. (C) Cluster3. (D) The Cluster3 is compared with the
article and approved the submitted version.
Cluster1. Forest plot shown differences of mutation genes among three m6A
regulators clusters. median column represented gene mutation frequencies.
(** pLiu et al. m6A Modification and Efficacy of ICIs for PCa
14. Su R, Dong L, Li Y, Gao M, Han L, Wunderlich M, et al. Targeting FTO 33. Lan T, Li H, Zhang D, Xu L, Liu H, Hao X, et al. KIAA1429 Contributes to
Suppresses Cancer Stem Cell Maintenance and Immune Evasion. Cancer Cell Liver Cancer Progression Through N6-Methyladenosine-Dependent Post-
(2020) 38:79–96 e11. doi: 10.1016/j.ccell.2020.04.017 Transcriptional Modification of GATA3. Mol Cancer (2019) 18:186.
15. Zhang L, Hou C, Chen C, Guo Y, Yuan W, Yin D, et al. The Role of N(6)- doi: 10.1186/s12943-019-1106-z
Methyladenosine (M(6)A) Modification in the Regulation of circRNAs. Mol 34. Qian JY, Gao J, Sun X, Cao MD, Shi L, Xia TS, et al. KIAA1429 Acts as an
Cancer (2020) 19:105. doi: 10.1186/s12943-020-01224-3 Oncogenic Factor in Breast Cancer by Regulating CDK1 in an N6-
16. Huang H, Weng H, Chen J. M(6)A Modification in Coding and Non-Coding Methyladenosine-Independent Manner. Oncogene (2019) 38:6123–41.
RNAs: Roles and Therapeutic Implications in Cancer. Cancer Cell (2020) doi: 10.1038/s41388-019-0861-z
37:270–88. doi: 10.1016/j.ccell.2020.02.004 35. Miao R, Dai CC, Mei L, Xu J, Sun SW, Xing YL, et al. KIAA1429 Regulates
17. Han D, Liu J, Chen C, Dong L, Liu Y, Chang R, et al. Anti-Tumour Immunity Cell Proliferation by Targeting C-Jun Messenger RNA Directly in Gastric
Controlled Through mRNA M(6)A Methylation and YTHDF1 in Dendritic Cancer. J Cell Physiol (2020) 235:7420–32. doi: 10.1002/jcp.29645
Cells. Nature (2019) 566:270–4. doi: 10.1038/s41586-019-0916-x 36. Li J, Rao B, Yang J, Liu L, Huang M, Liu X, et al. Dysregulated M6a-Related
18. Li N, Kang Y, Wang L, Huff S, Tang R, Hui H, et al. ALKBH5 Regulates Anti- Regulators Are Associated With Tumor Metastasis and Poor Prognosis in
PD-1 Therapy Response by Modulating Lactate and Suppressive Immune Cell Osteosarcoma. Front Oncol (2020) 10:769. doi: 10.3389/fonc.2020.00769
Accumulation in Tumor Microenvironment. Proc Natl Acad Sci U S A (2020) 37. Zhang Q, Liu S, Ge D, Cunningham DM, Huang F, Ma L, et al. Targeting
117:20159–70. doi: 10.1073/pnas.1918986117 Th17-IL-17 Pathway in Prevention of Micro-Invasive Prostate Cancer in a
19. He X, Tan L, Ni J, Shen G. Expression Pattern of M(6)A Regulators is Mouse Model. Prostate (2017) 77:888–99. doi: 10.1002/pros.23343
Significantly Correlated With Malignancy and Antitumor Immune Response 38. Dulos J, Carven GJ, van Boxtel SJ, Evers S, Driessen-Engels LJ, Hobo W, et al.
of Breast Cancer. Cancer Gene Ther (2020) 28:188–96. doi: 10.1038/s41417- PD-1 Blockade Augments Th1 and Th17 and Suppresses Th2 Responses in
020-00208-1 Peripheral Blood From Patients With Prostate and Advanced Melanoma
20. Kusne Y, Carrera-Silva EA, Perry AS, Rushing EJ, Mandell EK, Dietrich JD, Cancer. J Immunother (2012) 35:169–78. doi: 10.1097/CJI.0b013e318247a4e7
et al. Targeting aPKC Disables Oncogenic Signaling by Both the EGFR and the 39. Jiao S, Subudhi SK, Aparicio A, Ge Z, Guan B, Miura Y, et al. Differences in
Proinflammatory Cytokine TNFalpha in Glioblastoma. Sci Signal (2014) 7: Tumor Microenvironment Dictate T Helper Lineage Polarization and
ra75. doi: 10.1126/scisignal.2005196 Response to Immune Checkpoint Therapy. Cell (2019) 179:1177–1190 e13.
21. Zhang B, Wu Q, Li B, Wang D, Wang L, Zhou YL. M(6)A Regulator-Mediated doi: 10.1016/j.cell.2019.10.029
Methylation Modification Patterns and Tumor Microenvironment Infiltration 40. Lan Y, Zhang D, Xu C, Hance KW, Marelli B, Qi J, et al. Enhanced Preclinical
Characterization in Gastric Cancer. Mol Cancer (2020) 19:53. doi: 10.1186/ Antitumor Activity of M7824, a Bifunctional Fusion Protein Simultaneously
s12943-020-01170-0 Targeting PD-L1 and TGF-Beta. Sci Transl Med (2018) 10:1–15. doi: 10.1126/
22. Tang R, Zhang Y, Liang C, Xu J, Meng Q, Hua J, et al. The Role of M6a- scitranslmed.aan5488
Related Genes in the Prognosis and Immune Microenvironment of Pancreatic 41. Ravi R, Noonan KA, Pham V, Bedi R, Zhavoronkov A, Ozerov IV, et al.
Adenocarcinoma. PeerJ (2020) 8:e9602. doi: 10.7717/peerj.9602 Bifunctional Immune Checkpoint-Targeted Antibody-Ligand Traps That
23. Gao W, Cheng L, He S, Li W, Zhou C, Zhou B, et al. Multiomics Integrative Simultaneously Disable TGFbeta Enhance the Efficacy of Cancer
Analysis for Gene Signatures and Prognostic Values of M(6)A Regulators in Immunotherapy. Nat Commun (2018) 9:741. doi: 10.1038/s41467-017-02696-6
Pancreatic Adenocarcinoma: A Retrospective Study in The Cancer Genome 42. Ji G, Huang C, He S, Gong Y, Song G, Li X, et al. Comprehensive Analysis of
Atlas Project. Aging (Albany NY) (2020) 12:20587–610. doi: 10.18632/ M6a Regulators Prognostic Value in Prostate Cancer. Aging (2020) 12:14863–
aging.103942 84. doi: 10.18632/aging.103549
24. Chen Y, Peng C, Chen J, Chen D, Yang B, He B, et al. WTAP Facilitates 43. Cheng Y, Li L, Qin Z, Li X, Qi F. Identification of Castration-Resistant Prostate
Progression of Hepatoc. Mol Cancer (2019) 18:127. doi: 10.1186/s12943-019- Cancer-Related Hub Genes Using Weighted Gene Co-Expression Network
1053-8 Analysis. J Cell Mol Med (2020) 24:8006–17. doi: 10.1111/jcmm.15432
25. Panneerdoss S, Eedunuri VK, Yadav P, Timilsina S, Rajamanickam S, 44. Stockley J, Villasevil MEM, Nixon C, Ahmad I, Leung HY, Rajan P. The RNA-
Viswanadhapalli S, et al. Cross-Talk Among Writers, Readers, and Erasers Binding Protein Hnrnpa2 Regulates b-Catenin Protein Expression and is
of M(6)A Regulates Cancer Growth and Progression. Sci Adv (2018) 4: Overexpressed in Prostate Cancer. RNA Biol (2014) 11:755–65. doi: 10.4161/
eaar8263. doi: 10.1126/sciadv.aar8263 rna.28800
26. Yue B, Song C, Yang L, Cui R, Cheng X, Zhang Z, et al. METTL3-Mediated 45. Germano G, Lamba S, Rospo G, Barault L, Magri A, Maione F, et al.
N6-Methyladenosine Modification is Critical for Epithelial-Mesenchymal Inactivation of DNA Repair Triggers Neoantigen Generation and Impairs
Transition and Metastasis of Gastric Cancer. Mol Cancer (2019) 18:142. Tumour Growth. Nature (2017) 552:116–20. doi: 10.1038/nature24673
doi: 10.1186/s12943-019-1065-4 46. Hellmann MD, Nathanson T, Rizvi H, Creelan BC, Sanchez-Vega F, Ahuja A,
27. Yang G, Sun Z, Zhang N. Reshaping the Role of M6a Modification in Cancer et al. Genomic Features of Response to Combination Immunotherapy in
Transcriptome: A Review. Cancer Cell Int (2020) 20:353. doi: 10.1186/s12935- Patients With Advanced Non-Small-Cell Lung Cancer. Cancer Cell (2018)
020-01445-y 33:843–852 e4. doi: 10.1016/j.ccell.2018.03.018
28. Zheng W, Dong X, Zhao Y, Wang S, Jiang H, Zhang M, et al. Multiple 47. Snyder A, Makarov V, Merghoub T, Yuan J, Zaretsky JM, Desrichard A, et al.
Functions and Mechanisms Underlying the Role of METTL3 in Human Genetic Basis for Clinical Response to CTLA-4 Blockade in Melanoma. N Engl
Cancers. Front Oncol (2019) 9:1403. doi: 10.3389/fonc.2019.01403 J Med (2014) 371:2189–99. doi: 10.1056/NEJMoa1406498
29. Cai J, Yang F, Zhan H, Situ J, Li W, Mao Y, et al. RNA M(6)A 48. Rizvi NA, Hellmann MD, Snyder A, Kvistborg P, Makarov V, Havel JJ, et al.
Methyltransferase METTL3 Promotes The Growth Of Prostate Cancer By Cancer Immunology. Mutational Landscape Determines Sensitivity to PD-1
Regulating Hedgehog Pathway. Onco Targets Ther (2019) 12:9143–52. Blockade in non-Small Cell Lung Cancer. Science (2015) 348:124–8.
doi: 10.2147/OTT.S226796 doi: 10.1126/science.aaa1348
30. Yuan Y, Du Y, Wang L, Liu X. The M6A Methyltransferase METTL3 49. Losic B, Craig AJ, Villacorta-Martin C, Martins-Filho SN, Akers N, Chen X,
Promotes the Development and Progression of Prostate Carcinoma via et al. Intratumoral Heterogeneity and Clonal Evolution in Liver Cancer. Nat
Mediating MYC Methylation. J Cancer (2020) 11:3588–95. doi: 10.7150/ Commun (2020) 11:291. doi: 10.1038/s41467-019-14050-z
jca.42338 50. Alkema NG, Wisman GB, van der Zee AG, van Vugt MA, de Jong S. Studying
31. Li E, Wei B, Wang X, Kang R. METTL3 Enhances Cell Adhesion Through Platinum Sensitivity and Resistance in High-Grade Serous Ovarian Cancer:
Stabilizing Integrin b1 mRNA via an M6a-HuR-Dependent Mechanism in Different Models for Different Questions. Drug Resist Updat (2016) 24:55–69.
Prostatic Carcinoma. Am J Cancer Res (2020) 10:1012–25. doi: 10.1016/j.drup.2015.11.005
32. Zhu D, Zhou J, Zhao J, Jiang G, Zhang X, Zhang Y, et al. ZC3H13 Suppresses 51. Wolf Y, Bartok O, Patkar S, Eli GB, Cohen S, Litchfield K, et al. UVB-Induced
Colorectal Cancer Proliferation and Invasion via Inactivating Ras-ERK Tumor Heterogeneity Diminishes Immune Response in Melanoma. Cell
Signaling. J Cell Physiol (2019) 234:8899–907. doi: 10.1002/jcp.27551 (2019) 179:219–35 e21. doi: 10.1016/j.cell.2019.08.032
Frontiers in Immunology | www.frontiersin.org 15 August 2021 | Volume 12 | Article 735170Liu et al. m6A Modification and Efficacy of ICIs for PCa
52. Dhodapkar KM. Role of Tissue-Resident Memory in Intra-Tumor this article, or claim that may be made by its manufacturer, is not guaranteed or
Heterogeneity and Response to Immune Checkpoint Blockade. Front endorsed by the publisher.
Immunol (2018) 9:1655. doi: 10.3389/fimmu.2018.01655
Copyright © 2021 Liu, Zhong, Zeng, Duan, Lu, Sun, Liu, Liang, Lin, Zhong,
Conflict of Interest: The authors declare that the research was conducted in the Wu, Cai and Zeng. This is an open-access article distributed under the terms of
absence of any commercial or financial relationships that could be construed as a the Creative Commons Attribution License (CC BY). The use, distribution or
potential conflict of interest. reproduction in other forums is permitted, provided the original author(s) and
the copyright owner(s) are credited and that the original publication in this
Publisher’s Note: All claims expressed in this article are solely those of the authors journal is cited, in accordance with accepted academic practice. No use,
and do not necessarily represent those of their affiliated organizations, or those of distribution or reproduction is permitted which does not comply with
the publisher, the editors and the reviewers. Any product that may be evaluated in these terms.
Frontiers in Immunology | www.frontiersin.org 16 August 2021 | Volume 12 | Article 735170You can also read