Identification of useful genes from multiple microarrays for ulcerative colitis diagnosis based on machine learning methods
←
→
Page content transcription
If your browser does not render page correctly, please read the page content below
www.nature.com/scientificreports

                OPEN             Identification of useful genes
                                 from multiple microarrays
                                 for ulcerative colitis diagnosis
                                 based on machine learning
                                 methods
                                 Lin Zhang1,6, Rui Mao1,6, Chung Tai Lau2, Wai Chak Chung2, Jacky C. P. Chan3, Feng Liang2,
                                 Chenchen Zhao4, Xuan Zhang2,5* & Zhaoxiang Bian2,5*

                                 Ulcerative colitis (UC) is a chronic relapsing inflammatory bowel disease with an increasing incidence
                                 and prevalence worldwide. The diagnosis for UC mainly relies on clinical symptoms and laboratory
                                 examinations. As some previous studies have revealed that there is an association between gene
                                 expression signature and disease severity, we thereby aim to assess whether genes can help to
                                 diagnose UC and predict its correlation with immune regulation. A total of ten eligible microarrays
                                 (including 387 UC patients and 139 healthy subjects) were included in this study, specifically with six
                                 microarrays (GSE48634, GSE6731, GSE114527, GSE13367, GSE36807, and GSE3629) in the training
                                 group and four microarrays (GSE53306, GSE87473, GSE74265, and GSE96665) in the testing group.
                                 After the data processing, we found 87 differently expressed genes. Furthermore, a total of six
                                 machine learning methods, including support vector machine, least absolute shrinkage and selection
                                 operator, random forest, gradient boosting machine, principal component analysis, and neural
                                 network were adopted to identify potentially useful genes. The synthetic minority oversampling
                                 (SMOTE) was used to adjust the imbalanced sample size for two groups (if any). Consequently, six
                                 genes were selected for model establishment. According to the receiver operating characteristic,
                                 two genes of OLFM4 and C4BPB were finally identified. The average values of area under curve for
                                 these two genes are higher than 0.8, either in the original datasets or SMOTE-adjusted datasets.
                                 Besides, these two genes also significantly correlated to six immune cells, namely Macrophages
                                 M1, Macrophages M2, Mast cells activated, Mast cells resting, Monocytes, and NK cells activated
(P 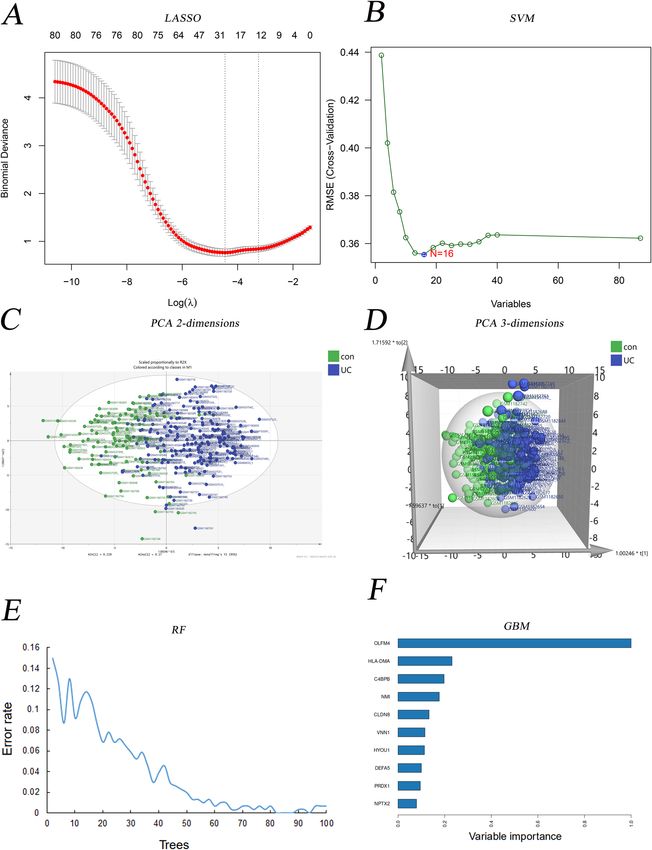
www.nature.com/scientificreports/
NN Neural network
PCA Principal component analysis
DEGs Differential expression genes
GO Gene ontology
KEGG Kyoto encyclopedia of genes and genomes
DO Disease ontology
GSEA Gene set enrichment analysis
MF Molecular function
BP Biological process
CC Cellular components
ROC Receiver operating characteristic
AUC Area under curve
Ulcerative colitis (UC), one type of inflammatory bowel disease (IBD, another is Crohn’s Disease), is character-
ized as inflammation and ulceration in the rectum and colon, which may eventually affect the whole colon if
left untreated1. The clinical manifestation of UC mainly includes bloody diarrhea, frequent bowel movement,
abdominal discomfort, pain, weight loss, fever, and fatigue2. Unfortunately, UC is deemed as an incurable dis-
ease despite plenty of therapeutic options available depending on the disease severity. UC patients are often
suffering from alternating conditions of clinical relapse and remission that severely deteriorate their quality of
life3. The incidence of UC is previously more prevalent in high-income countries of Europe and North America
has shifted towards industrialized countries such as Asia. As a result, it has become a global refractory disease
with worldwide shifting epidemiological characteristics. Previous studies have found that immune dysfunction
contributes to the progression of U C4. Specifically, in B cells, UC patients showed an increasing percentage of
CD23 B naive cells than the normal individuals, while intestinal CD11b + B Cells relieve colitis by secreting
immunoglobulin A5, 6.
Generally, the diagnosis criteria of different UC stages are mainly based on clinical symptoms and the endo-
scope and biochemical examinations7. There are some standard methods, such as Mayo score, Ulcerative Colitis
Disease Activity Index (UCDAI), etc., which were widely used to identify the remission or active stage of U C 8.
Additionally, several other factors, including IL-6, TNF-α, and hs-CRP, were also helpful for the diagnosis of
UC9. Besides, some scholars have compared the transcriptomic data of rectum biopsy in UC patients and healthy
subjects, and high heterogeneity in the gene expression was observed in the UC group10. Particularly, genes with
positive correlations were enriched among biological processes, including inflammatory response, neutrophil
chemotaxis, and immune regulation11. Compared to other immune diseases (e.g., HLA-B27 related to Ankylos-
ing Spondylitis), few studies have analyzed the diagnosis or transcriptome differences between UC patients and
healthy individuals12. Moreover, although previous studies had reported the role of genes in the diagnosis of
UC, the results were not satisfactory due to the database with only two microarrays or the area under the curve
(AUC) were unstable13, 14. Thus, it is necessary to develop a predictive model for UC diagnosis with stable AUC
based on multiple microarrays.
Machine learning (ML), based on a series of complex algorithms process, is recently commonly used to
identify biomarkers and to predict a wide range of diseases. For example, Random Forest (one type of ML) was
used to forecast Crohn’s disease and UC with higher prediction accuracy (more than 90%), even exceeding the
traditional prediction model15. Among various ML methods, Support Vector Machine (SVM) has advantages in
the diagnosis research through feature classification of disease and iconography transcriptomic datasets. It has
been tested in the studies of various diseases, including cancer, schizophrenia, and postpartum hemorrhage16–20.
Regarding UC, the characteristics of high stability and prediction accuracy of the SVM method have also been
proven in previous r eports21, 22. Another method of ML, the Least Absolute Shrinkage and Selection Operator
(LASSO) analysis, is commonly used in the biomarker identification of various carcinoma diseases23–25. Previ-
ous studies reported that various MLs could be used for the diagnosis prediction of UC, such as PCA a nalysis26
for metabolomics, the GBM a nalysis27 for microbiota, RF a nalysis28 for gene diagnosis, and NN a nalysis29 for
immune-related signature. However, no studies identified the useful genes for UC diagnosis prediction based on
the comparison among different ML t echniques30. It is highly recommended to combine or compare different
methods to increase the accuracy of classification and prediction for the diagnosis r esearch31–33.
Therefore, according to the gene expression omnibus (GEO) database, we aim to select multiple microarrays
(including healthy control and UC patients) and to identify the potential useful genes in terms of UC diagnosis
through comparing the results from multiple MLs. If applicable, we will further explore the relationship between
selected genes and immune cells.
Methods
Data collection. Gene Expression Omnibus (GEO, http://www.ncbi.nlm.nih.gov/geo/) is a publicly accessi-
ble functional genomics database. We initially searched the keyword of “Ulcerative Colitis”, and then screened the
data based on the following criteria: (1) inclusion criteria (i) diagnosed as UC in humans; (ii) derived from colon
tissue with transcriptome; (iii) included the healthy control (derived from the UC microarrays with no diseases).
(2) exclusion criteria (i) suspected carcinoma or other diseases; (ii) included pharmacological intervention(s)
for the treatment of UC patients. The sva R package (version 3.36) was used to bias control and to minimize the
batch effect among the included various microarrays. After that, we randomly grouped the microarrays as the
training set and testing set according to the classic statistical ratio of 6:4. The training data was used to develop
the predictive model, while the testing data was used to verify the results of the model.
Scientific Reports | (2022) 12:9962 | https://doi.org/10.1038/s41598-022-14048-6 2
Vol:.(1234567890)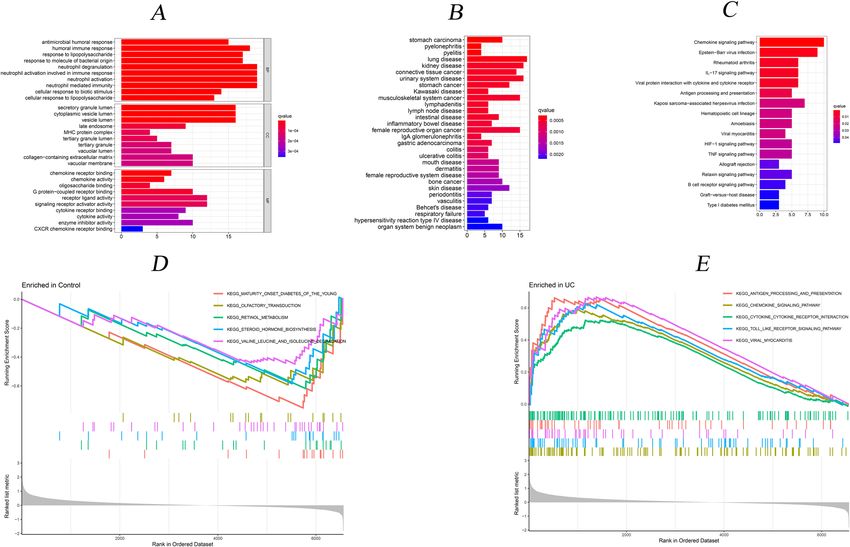
www.nature.com/scientificreports/
Data processing. Based on the training and testing groups, we further analyzed the data. Firstly, we used
R package preprocessCore (version 1.56.0) for quantile normalization. This process was composed of (1) trans-
ferred the primary dataset into a fixed data type of "matrix"; and (2) the function of "normalize. quantiles" was
used for quantile normalization. Secondly, we screened the differently expressed genes (DGEs) in both UC
patients and healthy subjects of the training set. Then, the functional analysis of DGEs was conducted through
Gene Ontology (GO), Kyoto Encyclopedia of Genes and Genomes (KEGG) pathway analysis, Disease Ontology
(DO) enrichment analysis, and Gene Set Enrichment Analysis (GSEA). Moreover, six machine-learning algo-
rithms, namely LASSO, SVM, NN, GBM, RF, and PCA, were used to establish the models. Regarding the testing
group, we divided two subgroups for verification, including one individualized set and all datasets of the testing
group. Finally, a correlation analysis between identified genes and immune cells was performed.
General statistical consideration. Statistical analysis was conducted with R software (version 4.1.0;
https://www.r-project.org/) and the basement of RStudio (version 1.4.1717). For continuous variables, the inde-
pendent Student’s t-test was adopted if the variables met Gaussian distribution, if not, the Wilcoxon test was
used. For categorical variables, the chi-square test was used, and the Wilcoxon test was used for signed-rank
variables. The Pearson or Spearman coefficients were adopted in the correlation analysis. A two-sided p value <
0.05 was considered as significant criteria.
Identify DEGs. The limma R package (version 3.44) was used to identify the DEGs. The raw data was pro-
cessed as log2 transformation after the quantile normalization. The p value was adjusted to control the false
discovery rate (FDR) based on the method of Benjamini and Hochberg. The DEGs were filtered with the criteria
of the absolute value of fold change > 1 (|logFC| > 1) and FDR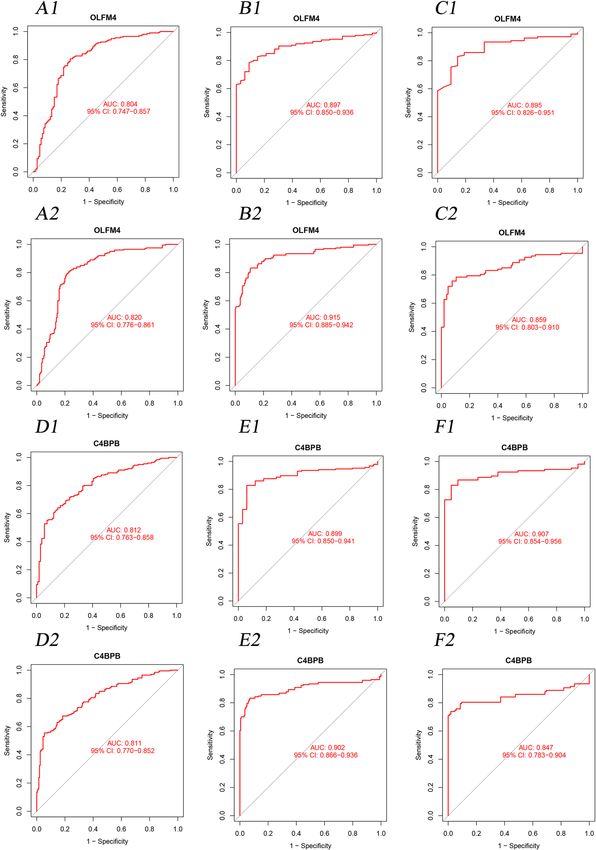
www.nature.com/scientificreports/
Figure 1. The workflow of the analysis steps.
GSE74265, and GSE96665, and further tested the results of the model. In addition, as the microarray GSE87473
included the largest sample size in the testing set, we also selected it as a separate group for the model testing.
With the datasets, we further processed the following analysis just shown in the workflow (Fig. 1).
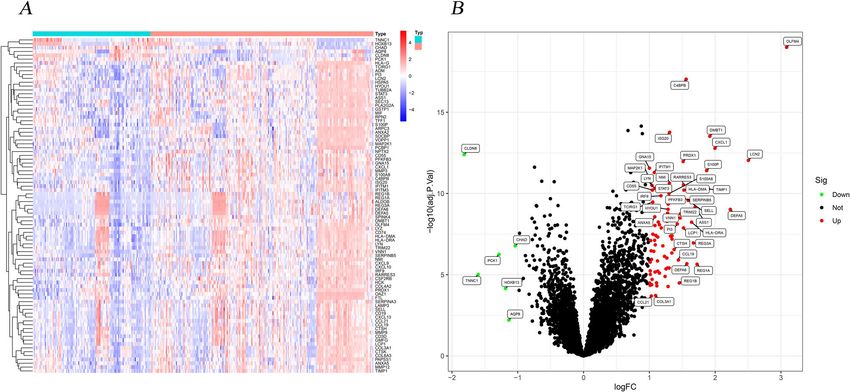
Identify DEGs. Among the training group, we identified a total of 87 DEGs with biological significance.
Details are provided in Appendix 1. Compared to the healthy control, there are 81 genes presented as up-reg-
ulated and 6 genes shown as down-regulated in the UC patients. Generally, the bigger absolute value of LogFC
and adjusted P value of Log10 indicates a greater difference between the two groups. Therefore, OLFM4, C4BPB,
and CLDN8 distributed in the margin of the heatmap indicated an obvious difference between the two groups
(Fig. 2).
Functional enrichment analysis. In both UC patients and healthy subjects, we have identified the top
10 GO terms, top 30 DO terms, 17 significant KEGG pathways, and the top 5 single cohorts of GSEA (Fig. 3).
Regarding 10 GO terms, the top 3 presented the significant enrichments in the antimicrobial humoral response,
humoral immune response, and response to lipopolysaccharide. Regarding 30 DO terms, the top 3 presented
the significant enrichments in the stomach carcinoma, pyelonephritis, and pyelitis, respectively. Among KEGG
pathways, the top 3 presented the significant enrichments in the Chemokine signaling pathway, Epstein–Barr
virus infection, and Rheumatoid arthritis. In terms of GESA among the healthy group, the top 3 also presented
the significant enrichments in the Maturity Onset Diabetes Of The Young, Olfactory Transduction, and Retinol
Metabolism. Compared to the GESA of the UC group, the top 3 presented significant enrichments in the Anti-
gen Processing And Presentation, Chemokine Signaling Pathway, and Cytokine Cytokine Receptor Interaction.
Six machine‑learning algorithms for candidate genes. In this study, six predictive models, includ-
ing LASSO, SVM, PCA, RF, NN, and GBM were successfully established, respectively (Fig. 4). We identified 27
candidate genes through the 10-fold cross-validations of binomial deviance (Fig. 4A) and minimum lambda
0.01162648 of the LASSO algorithm (Appendix 2). In comparison, 16 candidate genes were identified based on
the SVM algorithm (Fig. 4B) with svmRadial function. Furthermore, the PCA analysis (Fig. 4C-D) indicated
that the two groups of UC patients and healthy control were distributed in different quadrants with obvious
discrimination among 2 and 3 dimensions (Fig. 4C,D). With the increasing trees of RF analysis, the error rate
presented decreased (Fig. 4E). In GBM (Fig. 4F), the various important genes indicated that OlFM4, HLA-DMA,
and C4BPB showed a dominant weight proportion.
As four MLs (SVM, RF, NN, and GBM) were used for classification, we adopted the calculated error rate for
model evaluation. The SVM presented the lowest value among the four MLs (Table 1). Moreover, we calculated
the top 20 weighted genes in a total of six MLs (Table 2). According to the criteria of counts frequency > 4, there
Scientific Reports | (2022) 12:9962 | https://doi.org/10.1038/s41598-022-14048-6 4
Vol:.(1234567890)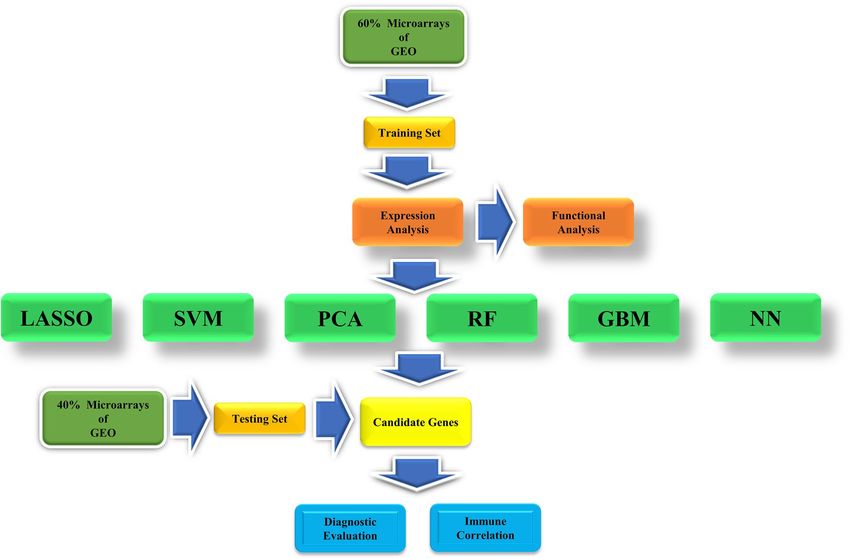
www.nature.com/scientificreports/
Figure 2. The 87 DEGs distributed in both UC group and healthy group. (A. Heatmap; B. Volcano diagram.).
Note: R software (version 4.1.0; https://www.r-project.org/) was used to create the maps, including R package
pheatmap (version 1.0.12; https://cran.r-project.org/web/packages/pheatmap/index.html) for heatmap and
ggplot2 (version 3.35; https://cran.r-project.org/web/packages/ggplot2/index.html) for volcano plot, respectively.
Figure 3. Functional enrichment analysis. (A. The top 10 most significantly enriched GO terms; B. The top 30
most significantly enriched DO terms; C. The 17 significantly enriched KEGG pathways; D. The top 5 GSEA-
KEGG enrichment in healthy group; E. The top 5 GSEA-KEGG enrichment in UC group).
Scientific Reports | (2022) 12:9962 | https://doi.org/10.1038/s41598-022-14048-6 5
Vol.:(0123456789)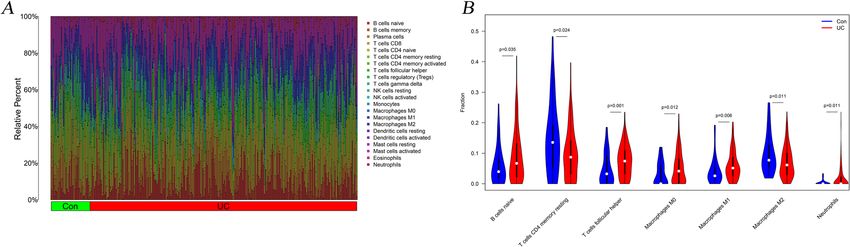
www.nature.com/scientificreports/

                                           Figure 4.  Six MLs for DGEs comparison. (A. LASSO for 27 prognostic DGEs; B. SVM for 16 prognostic DGEs;
                                           C. PCA for classification in 2 dimensions; D. PCA for classification in 3 dimensions; E. The error rate of RF with
                                           100 trees; F. The top 10 weighted genes in GBM).

          Scientific Reports |   (2022) 12:9962 |               https://doi.org/10.1038/s41598-022-14048-6                                                  6

Vol:.(1234567890)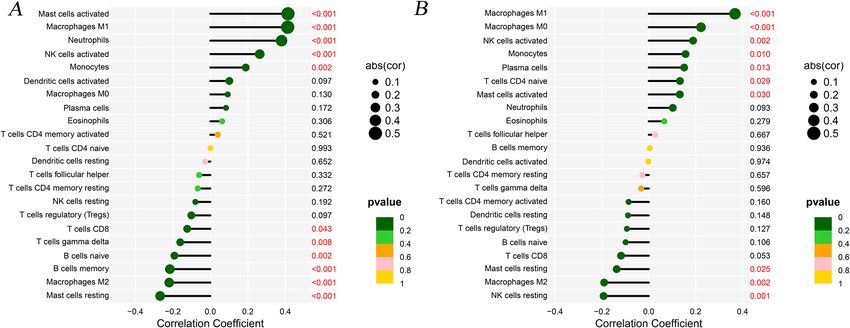
www.nature.com/scientificreports/

                                      Machine-learning                                     Error rate (%)
                                      SVM                                                  0.16
                                      RF                                                   0.65
                                      GBM                                                  0.98
                                      NN                                                   0.17

                                      Table 1.  Error rate in different machine learnings. SVM, Support Vector Machine; RF, Random forest; GBM,
                                      Gradient boosting machine; NN, Neural network. Bold value indicates the lowest value.

LASSO                        PCA                         GBM                     RF                         NN                  SVM
Genes           Weight       Genes           Weight      Genes        Weight     Genes            Weight    Genes      Weight   Genes        Weight
S100P              0.52      C4BPA           1.85        OLFM4        1          OLFM4            3.89      TUBB2A     − 2.39   OLFM4        8.87
RARRES3            0.42      RIPK2           1.85        HLA-DMA      0.23       C4BPB            3.7       TIMP1        2.25   C4BPB        3.37
IFITM3           − 0.31      PYY             1.85        C4BPB        0.2        ISG20            1.63      CCL19      − 2.25   NMI          2.13
CD19               0.29      REG3A           1.85        NMI          0.18       DMBT1            2.43      DEFA6      − 2.01   HLA-DMA      1.96
CHAD             − 0.28      DUSP10          1.85        CLDN8        0.13       CXCL1            1.08      CD55         1.87   VNN1         1.78
NMI                0.24      CNTNAP2         1.84        VNN1         0.12       CLDN8            2.46      CXCL9        1.77   DEFA5        1.78
PLA2G2A          − 0.24      ATP2C2          1.84        HYOU1        0.11       LCN2             0.69      IFITM1       1.7    S100P        1.77
C4BPB              0.19      LRRN2           1.84        DEFA5        0.1        PRDX1            2.67      PCBP1        1.65   PRDX1        1.65
HYOU1              0.19      CHI3L2          1.83        PRDX1        0.1        GNA15            1.01      AQP8         1.64   CLDN8        1.55
VNN1               0.18      TRIM22          1.83        NPTX2        0.08       S100P            2.44      FTL          1.48   REG3A        1.38
NPTX2              0.18      ALOX5           1.83        S100P        0.08       IFITM1           2.03      ASS1         1.4    IRF9         1.34
DMBT1              0.17      OAZ1            1.83        RARRES3      0.08       NMI              3.47      HSPA5        1.34   HYOU1        1.32
OLFM4              0.15      ZNF189          1.82        CXCL1        0.07       RARRES3          1.96      ADM        − 1.34   CXCL1        1.2
CSF2RB             0.15      STAT3           1.82        DEFA6        0.05       MAP2K1           0.93      C4BPB        1.33   NPTX2        1.14
COL6A3           − 0.12      ZNF143          1.82        REG3A        0.05       LYN              1.54      ISG20        1.31   CD55         1.1
PCK1             − 0.11      GPR161          1.82        CHAD         0.05       STAT3            1.35      SDCBP        1.25   RARRES3      0.94
SERPINA3         − 0.08      SWAP70          1.82        VOPP1        0.04       TIMP1            1.23      REG1B      − 1.19   ISG20        0.86
CLDN8            − 0.05      ME1             1.82        CD19         0.04       CD55             1.45      TRIM22     − 1.17   CD19         0.86
COL4A2             0.04      BIRC3           1.82        PCK1         0.04       HLA-DMA          2.11      SERPINA3     1.09   HLA-DRA      0.85
SPINK4           − 0.04      ADRA2A          1.81        HLA-DRA      0.04       S100A8           0.64      CTSK         1.07   SELL         0.81

                                      Table 2.  The top 20 weighted genes selected from different machine-learnings. LASSO, Least Absolute
                                      Shrinkage and Selection Operator; PCA, principal component analysis; GBM, Gradient boosting machine; RF,
                                      Random forest; NN, Neural network, SVM, Support Vector Machine. Different MLS process different weights,
                                      and negative weights in LASSO and NN that we sort the weighted genes with absolute value.

                                      were six genes finally selected, including C4BPB, OLFM4, NMI, CLDN8, S100P, and RARRES3. All of them
                                      presented significance in UC group and healthy group (Fig. 5).

                                      Evaluation of the models. We adopted the ROC curve and AUC values to assess the diagnosis value of the
                                      model. When we set the 6 genes (as mentioned above) into the ROC curve (Appendix 3), the results showed that
                                      the AUC values of OLFM4 and C4BPB were higher than 0.8 in the training group, testing group, and individual
                                      GSE87473 testing group (Fig. 6A1-F1). In addition, aim to reduce the potential bias from imbalanced sample
                                      size in different groups, we selected the SMOTE technique for our analysis. For the training group, we expanded
                                      the 1:1 ratio for the UC patients (n=201) and healthy controls (n=201), while in the testing group, we have 197
                                      UC patients vs 198 healthy controls. Regarding the GSE87473, we expanded to 107 patients and 105 healthy
                                      controls. As indicated in Fig. 6A2-F2, both the primary datasets and SMOTE datasets showed a good AUC >0.8.

                                      Correlation analysis. To analyze the relationship between ten microarrays and 22 immune cells, we dem-
                                      onstrated the relative percentage of immune cells among 526 samples of ten microarrays (Fig. 7A). Then, the
                                      significant immune proportions of the UC and healthy groups indicated that there were 7 types of immune cells,
                                      including B cells naive, T cells CD4 memory resting, T cells follicular helper, Macrophages M0, Macrophages
                                      M1, and Macrophages M2, Neutrophils (Fig. 7B).
                                          Moreover, we analyzed the correlations between 22 immunize cells and the two important genes of OLFM4
                                      and C4BPB through the Spearman analysis (Appendix 4). The significant results were presented in the following
                                      6 types of immune cells, including Macrophages M1, Macrophages M2, Mast cells activated, Mast cells resting,
                                      Monocytes, and NK cells activated (Fig. 8).

Scientific Reports |      (2022) 12:9962 |                  https://doi.org/10.1038/s41598-022-14048-6                                                7

                                                                                                                                              Vol.:(0123456789)
www.nature.com/scientificreports/
Figure 5. Results comparison of 6 DGEs in testing groups.
Discussion
In this study, we included ten microarrays with 526 samples for data analysis, and further selected a total of 87
DEGs. Based on the six MLs, we successfully established the predictive models and identified two useful genes in
the diagnosis of UC, namely OLFM4 and C4BPB. The AUC values of C4BPB (average 0.873) were 0.812, 0.899,
and 0.907 in the training group, testing group, and individual GSE87473 testing group, respectively. Compared
to the previous studies, C4BPB presented the diagnosis value in Crohn’s d isease34. But this study extended its
scope to UC. Additionally, the AUC values of OLFM4 (average 0.865) were 0.804, 0.897, and 0.895 in the train-
ing group, testing group, and individual GSE87473 testing group, respectively. In previous studies, OLFM4, as
a cancer stemness gene induced by IL-22, was highly distributed in primary sclerosing cholangitis-associated
ulcerative colitis35. It was also overexpressed in the active I BD36. In this study, we added a new result in terms of
diagnosis values of OLFM4 for UC patients.
Regarding the correlations analysis, these two genes (e.g., OLFM4 and C4BPB) presented significant associa-
tions with 6 types of immune cells, including Macrophages M1, Macrophages M2, Mast cells activated, Mast
cells resting, Monocytes, and NK cells activated. Some scholars have found that the UC patients presented an
increasing percentage of CD23 B naive cells, compared to the normal individuals5. Regulatory T cells were
also a key factor that exacerbated UC through immune i mbalance37. Compared to Crohn’s disease, the colonic
mucosa samples in UC patients showed the expansion of IL17A+ CD161+ effector memory T cells and IL17A+
T-regulatory cells, expansion of HLA-DR+CD56+ granulocytes, and reductions in type 3 innate lymphoid c ells38.
The regulation of T cells for UC patients based on Bcl-6 and IL-21 could help to avoid the occurrence and devel-
opment of I BD39. In a previous survey that included a global immune cell landscape of UC patients’ tissue, the
results identified the increasing number of neutrophils, T CD4 memory-activated cells, active dendritic cells,
and M0 macrophages, and decreasing number of T CD8, Tregs, B memory, and M2 m acrophages40.
Through the functional enrichment analysis, we found three pathways, including Chemokine signaling path-
way, Epstein–Barr virus infection pathways, and Rheumatoid arthritis pathways, might be closely related to the
progress of UC. The previous study had emphasized the potential role of the Chemokine signaling pathway in
the up-regulation of UC patients and further proposed the CXCL8-CXCR137 (a type of chemokine) in the treat-
ment of U C41. Although Epstein–Barr virus infection might trigger several immune dysfunctions, such as natural
killer/T cell lymphoma arising, hemophagocytic lymphohistiocytosis, and malignancies, few studies focused on
UC previously41–43. Furthermore, Epstein Barr Virus might be useful in the development of vaccines and immune
cell therapy for EBV-Associated diseases, especially for several immune-related d iseases44. The prognosis of
Epstein–Barr virus infection in UC was less paid attention t o45. In this study, the KEGG pathways results indicated
that more studies of the Epstein–Barr virus infection pathway in UC could be conducted46. Particularly, IBD
patients have a higher risk to develop autoimmune and inflammatory diseases, such as rheumatoid arthritis47.
Actually, there are many limitations to using machine learning in a clinical setting. As MLs include multiple
factors, especially in statistics, clinical practice, and bioinformatics. To improve the study design and to facilitate
the explanation of results from ML analysis, it is recommended to include a variety of experts of authors/research-
ers in a study. Individuals with rich clinical experience and MLs technique background are also conducive to
Scientific Reports | (2022) 12:9962 | https://doi.org/10.1038/s41598-022-14048-6 8
Vol:.(1234567890)www.nature.com/scientificreports/
Figure 6. The ROC curve of OLFM4 and C4BPB between two groups. (A1. The ROC curve of OLFM4 in
training group; A2. The ROC curve of OLFM4 in SMOTE-training group; B1. The ROC curve of OLFM4 in
the testing group; B2. The ROC curve of OLFM4 in SMOTE-testing group; C1. The ROC curve of OLFM4 in
GSE87473 group; C2. The ROC curve of OLFM4 in SMOTE-GSE87473 group; D1. The ROC curve of C4BPB in
training group; D2. The ROC curve of C4BPB in SMOTE-training group; E1. The ROC curve of C4BPB in the
testing group; E2. The ROC curve of C4BPB in the SMOTE-testing group; F1. The ROC curve of C4BPB in the
GSE87473 group; F2. The ROC curve of C4BPB in the SMOTE-GSE87473 group).
Scientific Reports | (2022) 12:9962 | https://doi.org/10.1038/s41598-022-14048-6 9
Vol.:(0123456789)www.nature.com/scientificreports/
Figure 7. The immune correlation landscape for the ten microarrays. (A. Barplot for the 22 immune cells; B.
Violin plot among two groups in 7 immune cells).
Figure 8. The lollipop figure in the immune correlation of C4BPB and OLFM4. (A. The immune correlation in
C4BPB; B. The immune correlation in OLFM4).
playing an important role in clinical MLs studies. In this study, there are some limitations. Firstly, insufficient
verification is a common type of limitation in bioinformatics studies. Although we designed testing groups
to assess the stability of the predictive model based on AUC values, and included ten microarrays to increase
the sample size in this study, more research works, either in clinical trials or animal experiments, should be
conducted to obtain solid verifications for these predictive results. Secondly, the machine-learning model itself
includes some limitations, such as the black box phenomenon48, particularly in the NN method which includes
many layers, such as an input layer, an output layer, and hidden layers (count fluctuating)49, 50. Among them, the
characteristics of the hidden layers are hard to identify51. Thirdly, we have limited information about the clinical
features, such as the patient’s age30, ethnicity and race52, 53 and stage of UC. Generally, some detailed information
impacts the algorithm bias. Thus, further subgroup analysis could be included to identify more useful results
in future research.
Conclusion
In this study, we found two useful genes of OLFM4 and C4BPB which may help to identify UC patients. Further
verification studies could be conducted.
Data availability
The datasets generated and analysed during the current study are available in the Gene Expression Omni-
bus (GEO) (https://www.ncbi.nlm.nih.gov/geo/), and all the multiple micorarrays of GSE48634, GSE6731,
GSE114527, GSE13367, GSE36807, GSE3629, GSE53306, GSE87473, GSE74265, and GSE96665 were derived
from this database.
Received: 18 March 2022; Accepted: 31 May 2022
Scientific Reports | (2022) 12:9962 | https://doi.org/10.1038/s41598-022-14048-6 10
Vol:.(1234567890)www.nature.com/scientificreports/
References
1. Kornbluth, A. & Sachar, D. B. Ulcerative colitis practice guidelines in adults: American College Of Gastroenterology, Practice
Parameters Committee. Am. J. Gastroenterol. 105, 501–523; quiz 524. https://doi.org/10.1038/ajg.2009.727 (2010).
2. Harbord, M. et al. Corrigendum: Third European evidence-based consensus on diagnosis and management of ulcerative colitis.
Part 2: Current management. J. Crohns Colitis. 11, 1512. https://doi.org/10.1093/ecco-jcc/jjx105 (2017).
3. Tian, M., Ma, P., Zhang, Y., Mi, Y. & Fan, D. Ginsenoside Rk3 alleviated DSS-induced ulcerative colitis by protecting colon barrier
and inhibiting NLRP3 inflammasome pathway. Int. Immunopharmacol. 85, 106645. https://doi.org/10.1016/j.intimp.2020.106645
(2020).
4. Ma, C. et al. Systematic review: Disease activity indices for immune checkpoint inhibitor-associated enterocolitis. Aliment. Phar-
macol. Ther. 55, 178–190. https://doi.org/10.1111/apt.16718 (2022).
5. Rabe, H. et al. Distinct patterns of naive, activated and memory T and B cells in blood of patients with ulcerative colitis or Crohn’s
disease. Clin. Exp. Immunol. 197, 111–129. https://doi.org/10.1111/cei.13294 (2019).
6. Fu, Y. et al. Intestinal CD11b(+) B cells ameliorate colitis by secreting immunoglobulin A. Front. Immunol. 12, 697725. https://
doi.org/10.3389/fimmu.2021.697725 (2021).
7. Choi, C. H. et al. Second Korean guidelines for the management of ulcerative colitis. Intest. Res. 15, 7–37. https://doi.org/10.5217/
ir.2017.15.1.7 (2017).
8. Peyrin-Biroulet, L. et al. Etrolizumab as induction and maintenance therapy for ulcerative colitis in patients previously treated
with tumour necrosis factor inhibitors (HICKORY): A phase 3, randomised, controlled trial. Lancet Gastroenterol. Hepatol. 7,
128–140. https://doi.org/10.1016/s2468-1253(21)00298-3 (2022).
9. Ko, C. W. et al. AGA clinical practice guidelines on the management of mild-to-moderate ulcerative colitis. Gastroenterology 156,
748–764. https://doi.org/10.1053/j.gastro.2018.12.009 (2019).
10. Lai, L., Li, H., Feng, Q., Shen, J. & Ran, Z. Multi-factor mediated functional modules identify novel classification of ulcerative
colitis and functional gene panel. Sci. Rep. 11, 5669. https://doi.org/10.1038/s41598-021-85000-3 (2021).
11. Zhang, D., Yan, P., Han, T., Cheng, X. & Li, J. Identification of key genes and biological processes contributing to colitis associated
dysplasia in ulcerative colitis. PeerJ 9, e11321. https://doi.org/10.7717/peerj.11321 (2021).
12. Kim, S. H. et al. Effectiveness and drug retention of biologic disease modifying antirheumatic drugs in Korean patients with late
onset ankylosing spondylitis. Sci. Rep. 11, 21555. https://doi.org/10.1038/s41598-021-01132-6 (2021).
13. Lu, J. et al. Identification of diagnostic signatures in ulcerative colitis patients via bioinformatic analysis integrated with machine
learning. Hum. Cell. 35, 179–188. https://doi.org/10.1007/s13577-021-00641-w (2022).
14. Su, S., Kong, W., Zhang, J., Wang, X. & Guo, H. Integrated analysis of DNA methylation and gene expression profiles identified
S100A9 as a potential biomarker in ulcerative colitis. Biosci. Rep. https://doi.org/10.1042/bsr20202384 (2020).
15. Gubatan, J. et al. Artificial intelligence applications in inflammatory bowel disease: Emerging technologies and future directions.
World J. Gastroenterol. 27, 1920–1935. https://doi.org/10.3748/wjg.v27.i17.1920 (2021).
16. Kraszewski, S., Szczurek, W., Szymczak, J., Reguła, M. & Neubauer, K. Machine learning prediction model for inflammatory bowel
disease based on laboratory markers working. Model in a Discovery Cohort Study. J. Clin. Med. https://doi.org/10.3390/jcm10
204745 (2021).
17. Akazawa, M., Hashimoto, K., Katsuhiko, N. & Kaname, Y. Machine learning approach for the prediction of postpartum hemor-
rhage in vaginal birth. Sci. Rep. 11, 22620. https://doi.org/10.1038/s41598-021-02198-y (2021).
18. Cruz-Martinez, C., Reyes-Garcia, C. A. & Vanello, N. A novel event-related fMRI supervoxels-based representation and its appli-
cation to schizophrenia diagnosis. Comput. Methods Programs Biomed. 213, 106509. https://doi.org/10.1016/j.cmpb.2021.106509
(2022).
19. Stryker, S., Kapadia, A. J. & Greenberg, J. A. Application of machine learning classifiers to X-ray diffraction imaging with medically
relevant phantoms. Med0 Phys. 49, 532–546. https://doi.org/10.1002/mp.15366 (2022).
20. Xv, Y. et al. Machine learning-based CT radiomics approach for predicting WHO/ISUP nuclear grade of clear cell renal cell car-
cinoma: An exploratory and comparative study. Insights Imaging 12, 170. https://doi.org/10.1186/s13244-021-01107-1 (2021).
21. Al-Harazi, O., Kaya, I. H., El Allali, A. & Colak, D. A network-based methodology to identify subnetwork markers for diagnosis
and prognosis of colorectal cancer. Front. Genet. 12, 721949. https://doi.org/10.3389/fgene.2021.721949 (2021).
22. Khorasani, H. M., Usefi, H. & Peña-Castillo, L. Detecting ulcerative colitis from colon samples using efficient feature selection and
machine learning. Sci. Rep. 10, 13744. https://doi.org/10.1038/s41598-020-70583-0 (2020).
23. Ding, H. et al. In vivo analysis of mucosal lipids reveals histological disease activity in ulcerative colitis using endoscope-coupled
Raman spectroscopy. Biomed. Opt. Express 8, 3426–3439. https://doi.org/10.1364/boe.8.003426 (2017).
24. Fujii, T., Maehara, K., Fujita, M. & Ohkawa, Y. Discriminative feature of cells characterizes cell populations of interest by a small
subset of genes. PLoS Comput. Biol. 17, e1009579. https://doi.org/10.1371/journal.pcbi.1009579 (2021).
25. Jun, H. & ZeXin, Z. Screening of pyroptosis-related genes influencing the therapeutic effect of dehydroabietic acid in liver cancer
and construction of a survival nomogram. Biochem. Biophys. Res. Commun. 585, 103–110. https://doi.org/10.1016/j.bbrc.2021.
11.027 (2021).
26. Williams, H. R. et al. Characterization of inflammatory bowel disease with urinary metabolic profiling. Am. J. Gastroenterol. 104,
1435–1444. https://doi.org/10.1038/ajg.2009.175 (2009).
27. Bakir-Gungor, B. et al. Inflammatory bowel disease biomarkers of human gut microbiota selected via different feature selection
methods. PeerJ 10, e13205. https://doi.org/10.7717/peerj.13205 (2022).
28. Olsen, J. et al. Diagnosis of ulcerative colitis before onset of inflammation by multivariate modeling of genome-wide gene expres-
sion data. Inflamm. Bowel Dis. 15, 1032–1038. https://doi.org/10.1002/ibd.20879 (2009).
29. Chen, X. et al. Artificial neural network analysis-based immune-related signatures of primary non-response to infliximab in
patients with ulcerative colitis. Front. Immunol. 12, 742080. https://doi.org/10.3389/fimmu.2021.742080 (2021).
30. Kalkan, I. H., Dağli, U., Oztaş, E., Tunç, B. & Ulker, A. Comparison of demographic and clinical characteristics of patients with
early vs. adult vs. late onset ulcerative colitis. Eur. J. Intern. Med. 24, 273–277. https://doi.org/10.1016/j.ejim.2012.12.014 (2013).
31. Zhuge, L. et al. A novel model based on liquid–liquid phase separation—related genes correlates immune microenvironment
profiles and predicts prognosis of lung squamous cell carcinoma. J Clin Lab Anal. 36, e24135. https://doi.org/10.1002/jcla.24135
(2022).
32. Chen, X. et al. MRI-based radiomics model for distinguishing endometrial carcinoma from benign mimics: A multicenter study.
Eur J Radiol. 146, 110072. https://doi.org/10.1016/j.ejrad.2021.110072 (2022).
33. Yu, Y. X. et al. Value of the application of enhanced CT radiomics and machine learning in preoperative prediction of microvascular
invasion in hepatocellular carcinoma. Zhonghua Yi Xue Za Zhi 101, 1239–1245. https://doi.org/10.3760/cma.j.cn112137-20200
820-02425 (2021).
34. Dobre, M. et al. Differential intestinal mucosa transcriptomic biomarkers for Crohn’s disease and ulcerative colitis. J. Immunol.
Res. 2018, 9208274. https://doi.org/10.1155/2018/9208274 (2018).
35. Neyazi, M. et al. Overexpression of cancer-associated stem cell gene OLFM4 in the colonic epithelium of patients with primary
sclerosing cholangitis. Inflamm. Bowel Dis. 27, 1316–1327. https://doi.org/10.1093/ibd/izab025 (2021).
36. Gersemann, M. et al. Olfactomedin-4 is a glycoprotein secreted into mucus in active IBD. J. Crohns Colitis. 6, 425–434. https://
doi.org/10.1016/j.crohns.2011.09.013 (2012).
Scientific Reports | (2022) 12:9962 | https://doi.org/10.1038/s41598-022-14048-6 11
Vol.:(0123456789)www.nature.com/scientificreports/
37. Hanai, H. et al. A new paradigm in ulcerative colitis: Regulatory T cells are key factor which induces/exacerbates UC through an
immune imbalance. Mol. Immunol. 54, 173–180. https://doi.org/10.1016/j.molimm.2012.11.015 (2013).
38. Mitsialis, V. et al. Single-cell analyses of colon and blood reveal distinct immune cell signatures of ulcerative colitis and Crohn’s
disease. Gastroenterology 159, 591-608.e510. https://doi.org/10.1053/j.gastro.2020.04.074 (2020).
39. Yang, Y. et al. Case report: IL-21 and Bcl-6 regulate the proliferation and secretion of Tfh and Tfr cells in the intestinal germinal
center of patients with inflammatory bowel disease. Front Pharmacol. 11, 587445. https://doi.org/10.3389/fphar.2020.587445
(2020).
40. Penrose, H. M. et al. Ulcerative colitis immune cell landscapes and differentially expressed gene signatures determine novel regula-
tors and predict clinical response to biologic therapy. Sci. Rep. 11, 9010. https://doi.org/10.1038/s41598-021-88489-w (2021).
41. Linggi, B. et al. Meta-analysis of gene expression disease signatures in colonic biopsy tissue from patients with ulcerative colitis.
Sci. Rep. 11, 18243. https://doi.org/10.1038/s41598-021-97366-5 (2021).
42. Zhu, Y. et al. CXCL8 chemokine in ulcerative colitis. Biomed. Pharmacother. 138, 111427. https://doi.org/10.1016/j.biopha.2021.
111427 (2021).
43. Santos, A. T., Tong, J., Steinberg, A. & Shemen, L. Epstein–Barr virus-induced natural killer/T cell lymphoma arising in tonsil and
cervical node tissue. BMJ Case Rep. https://doi.org/10.1136/bcr-2020-235100 (2021).
44. Xu, L., Guo, X. & Guan, H. Serious consequences of Epstein–Barr virus infection: Hemophagocytic lymphohistocytosis. Int. J. Lab
Hematol. 44, 74–81. https://doi.org/10.1111/ijlh.13736 (2022).
45. Bauer, M., Jasinski-Bergner, S., Mandelboim, O., Wickenhauser, C. & Seliger, B. Epstein–Barr virus-associated malignancies and
immune escape: The role of the tumor microenvironment and tumor cell evasion strategies. Cancers (Basel) https://doi.org/10.
3390/cancers13205189 (2021).
46. Cui, X. & Snapper, C. M. Epstein Barr virus: Development of vaccines and immune cell therapy for EBV-associated diseases. Front
Immunol. 12, 734471. https://doi.org/10.3389/fimmu.2021.734471 (2021).
47. Liu, Y. et al. Clinical features of intestinal ulcers complicated by Epstein–Barr virus infection: Importance of active infection. Dis
Markers 2021, 6627620. https://doi.org/10.1155/2021/6627620 (2021).
48. Regazzoni, F., Chapelle, D. & Moireau, P. Combining data assimilation and machine learning to build data-driven models for
unknown long time dynamics—applications in cardiovascular modeling. Int. J. Numer. Method Biomed. Eng. 37, e3471. https://
doi.org/10.1002/cnm.3471 (2021).
49. Peng, J. C., Ran, Z. H. & Shen, J. Seasonal variation in onset and relapse of IBD and a model to predict the frequency of onset,
relapse, and severity of IBD based on artificial neural network. Int. J. Colorectal Dis. 30, 1267–1273. https://doi.org/10.1007/
s00384-015-2250-6 (2015).
50. Kang, T., Ding, W., Zhang, L., Ziemek, D. & Zarringhalam, K. A biological network-based regularized artificial neural network
model for robust phenotype prediction from gene expression data. BMC Bioinform. 18, 565. https://doi.org/10.1186/s12859-017-
1984-2 (2017).
51. Ozawa, T. et al. Novel computer-assisted diagnosis system for endoscopic disease activity in patients with ulcerative colitis. Gas-
trointest. Endosc. 89, 416-421.e411. https://doi.org/10.1016/j.gie.2018.10.020 (2019).
52. Jiang, L. et al. Risk factors for ulcerative colitis in a Chinese population: An age-matched and sex-matched case-control study. J.
Clin. Gastroenterol. 41, 280–284. https://doi.org/10.1097/01.mcg.0000225644.75651.f1 (2007).
53. Yamamoto-Furusho, J. K. et al. Interleukin 1 β (IL-1B) and IL-1 antagonist receptor (IL-1RN) gene polymorphisms are associated
with the genetic susceptibility and steroid dependence in patients with ulcerative colitis. J. Clin. Gastroenterol. 45, 531–535. https://
doi.org/10.1097/MCG.0b013e3181faec51 (2011).
Acknowledgements
The authors acknowledge the financial support from Health@InnoHK Initiative Fund of the Hong Kong Special
Administrative Region Government (ITC RC/IHK/4/7).
Author contributions
X.Z. and L.Z. designed and wrote the manuscript. L.Z., R.M., C.T.L., W.C.C., J.C.P.C., F.L., and C.C.Z. collected,
double-checked and analyzed the data. Z.X.B. provided critical review and comments for the manuscript revision.
X.Z. revised and finalized the manuscript. All authors have read and approved the contents of the final version.
Funding
Health@InnoHK Initiative Fund of the Hong Kong Special Administrative Region Government (ITC RC/
IHK/4/7), and China Center for Evidence Based Traditional Chinese Medicine, CCEBTM (2020YJSZX-5). The
funders had no role in the design of the study, in the collection, analysis, and interpretation of data, nor in the
writing of the manuscript.
Competing interests
The authors declare no competing interests.
Additional information
Supplementary Information The online version contains supplementary material available at https://doi.org/
10.1038/s41598-022-14048-6.
Correspondence and requests for materials should be addressed to X.Z. or Z.B.
Reprints and permissions information is available at www.nature.com/reprints.
Publisher’s note Springer Nature remains neutral with regard to jurisdictional claims in published maps and
institutional affiliations.
Scientific Reports | (2022) 12:9962 | https://doi.org/10.1038/s41598-022-14048-6 12
Vol:.(1234567890)www.nature.com/scientificreports/
Open Access This article is licensed under a Creative Commons Attribution 4.0 International
License, which permits use, sharing, adaptation, distribution and reproduction in any medium or
format, as long as you give appropriate credit to the original author(s) and the source, provide a link to the
Creative Commons licence, and indicate if changes were made. The images or other third party material in this
article are included in the article’s Creative Commons licence, unless indicated otherwise in a credit line to the
material. If material is not included in the article’s Creative Commons licence and your intended use is not
permitted by statutory regulation or exceeds the permitted use, you will need to obtain permission directly from
the copyright holder. To view a copy of this licence, visit http://creativecommons.org/licenses/by/4.0/.
© The Author(s) 2022
Scientific Reports | (2022) 12:9962 | https://doi.org/10.1038/s41598-022-14048-6 13
Vol.:(0123456789)You can also read