Tropospheric warming over the northern Indian Ocean caused by South Asian anthropogenic aerosols: possible impact on the upper troposphere and ...
←
→
Page content transcription
If your browser does not render page correctly, please read the page content below
Research article
Atmos. Chem. Phys., 22, 7179–7191, 2022
https://doi.org/10.5194/acp-22-7179-2022
© Author(s) 2022. This work is distributed under
the Creative Commons Attribution 4.0 License.

       Tropospheric warming over the northern Indian Ocean
      caused by South Asian anthropogenic aerosols: possible
               impact on the upper troposphere and
                        lower stratosphere
           Suvarna Fadnavis1 , Prashant Chavan1 , Akash Joshi2 , Sunil M. Sonbawne1 , Asutosh Acharya3 ,
                   Panuganti C. S. Devara4 , Alexandru Rap5 , Felix Ploeger6 , and Rolf Müller6
            1 Indian Institute of Tropical Meteorology, Center for Climate Change Research, MoES, Pune, India
                                         2 Indian Institute of Technology, Kharagpur, India
                                      3 Indian Institute of Technology, Bhubneshwar, India
         4 Centre of Excellence in ACOAST/ACESH, Amity University Haryana (AUH), Gurugram 122413, India
                              5 School of Earth and Environment, University of Leeds, Leeds, UK
                                  6 Forschungszentrum Jülich GmbH, IEK-7, Jülich, Germany

                              Correspondence: Suvarna Fadnavis (suvarna@tropmet.res.in)

                              Received: 22 November 2021 – Discussion started: 1 December 2021
                            Revised: 29 April 2022 – Accepted: 2 May 2022 – Published: 3 June 2022

      Abstract. Atmospheric concentrations of South Asian anthropogenic aerosols and their transport play a key
      role in the regional hydrological cycle. Here, we use the ECHAM6-HAMMOZ chemistry–climate model to
      show the structure and implications of the transport pathways of these aerosols during spring (March–May).
      Our simulations indicate that large amounts of anthropogenic aerosols are transported from South Asia to the
      northern Indian Ocean and western Pacific. These aerosols are then lifted into the upper troposphere and lower
      stratosphere (UTLS) by the ascending branch of the Hadley circulation, where they enter the westerly jet. They
      are further transported to the Southern Hemisphere (∼ 15–30◦ S) and downward (320–340 K) via westerly ducts
      over the tropical Atlantic (5◦ S–5◦ N, 10–40◦ W) and Pacific (5◦ S–5◦ N, 95–140◦ E). The carbonaceous aerosols
      are also transported to the Arctic, leading to local heating (0.08–0.3 K per month, an increase by 10 %–60 %).
         The presence of anthropogenic aerosols causes a negative radiative forcing (RF) at the top of the
      atmosphere (TOA) (−0.90 ± 0.089 W m−2 ) and surface (−5.87 ± 0.31 W m−2 ) and atmospheric warming
      (+4.96 ± 0.24 W m−2 ) over South Asia (60–90◦ E, 8–23◦ N), except over the Indo-Gangetic Plain (75–83◦ E,
      23–30◦ N), where RF at the TOA is positive (+1.27 ± 0.16 W m−2 ) due to large concentrations of absorbing
      aerosols. The carbonaceous aerosols lead to in-atmospheric heating along the aerosol column extending from
      the boundary layer to the upper troposphere (0.1 to 0.4 K per month, increase by 4 %–60 %) and in the lower
      stratosphere at 40–90◦ N (0.02 to 0.3 K per month, increase by 10 %–60 %). The increase in tropospheric heating
      due to aerosols results in an increase in water vapor concentrations, which are then transported from the northern
      Indian Ocean–western Pacific to the UTLS over 45–45◦ N (increasing water vapor by 1 %–10 %).

Published by Copernicus Publications on behalf of the European Geosciences Union.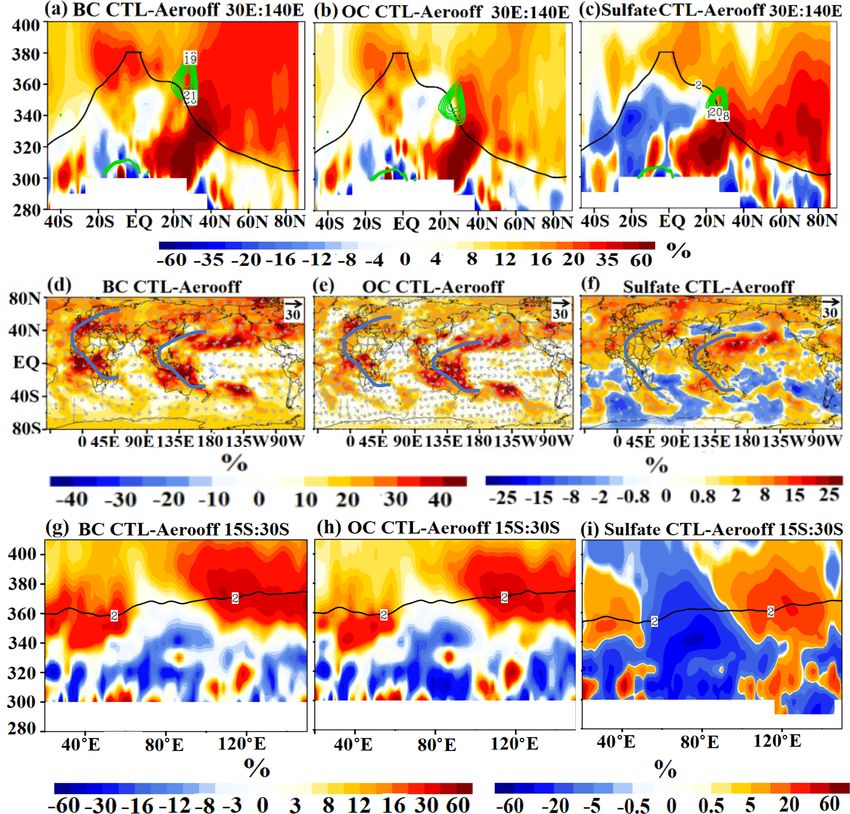
7180                                                      S. Fadnavis et al.: Tropospheric warming by South Asian aerosols

1   Introduction                                                 Indo-Gangetic Plain, these emissions show a peak in spring
                                                                 (Fig. 1d), with increases for BC of 0 %–3 %, OC of 0 %–
Understanding the variability of anthropogenic aerosol load-     8.7 %, and sulfate of 0 %–0.2 %, compared to annual means.
ing over the northern Indian Ocean is of utmost importance       This peak in emissions in spring is to a large extent driven
since (1) it regulates the Asian hydrological cycle via mod-     by springtime agricultural crop burning and biomass burning
ulating atmospheric convection, heating rates, and moisture      activity (Chavan et al., 2021).
transport (Ramanathan et al., 2005; Corrigan et al., 2008;          While the presence of sulfate aerosols leads to a cool-
Budhavant et al., 2018; Meehl et al., 2008) and (2) it leads     ing of the atmosphere below due to their strong scatter-
to adverse impacts on marine ecosystems (Mahowald et al.,        ing properties, carbonaceous aerosols produce atmospheric
2018; Collins et al., 2019). Several observations indicate       warming via absorption of solar radiation (Fadnavis et al.,
that the aerosol loading over the northern Indian Ocean dur-     2019; Penner et al., 1998). Previous studies showed that
ing the spring season is strongly influenced by South Asian      the doubling of carbonaceous aerosols loading over South
aerosols. Aircraft measurements during the Indian Ocean          Asia (10◦ S–50◦ N, 65–155◦ E) led to significant atmospheric
Experiment (INDOEX) (February–March 1999) showed the             warming (in-atmospheric radiative forcing (RF) 5.11 W m−2 ;
presence of a thick layer (surface to 3.2 km) of anthropogenic   Fadnavis et al., 2017b).
aerosols (black carbon (BC) ∼ 14 %, sulfate 34 %, ammo-             During spring, the prevailing convective instability over
nium 11 %) over the northern Indian Ocean (Dickerson et al.,     the Bay of Bengal and the Arabian Sea transports aerosol
2002; Mayol-Bracero et al., 2002) with sources over South        from the boundary layer to the upper troposphere (Ro-
Asia. Several other in situ observations, e.g., over the Mal-    matschke and Houze, 2011). Airborne observations during
dives during November 2014–March 2015, show that air             winter and spring, e.g., the Civil Aircraft for Regular Investi-
masses arising from the Indo-Gangetic Plain contain very         gation of the Atmosphere based on an Instrument Container
high amounts (97 %) of elemental carbon in the PM10 in           (CARIBIC) in March 1999 and January 2001 (Papaspiropou-
the fine mode. (Bhudhvant et al., 2018). Observations from       los et al., 2002) and the Indian Ocean Experiment (INDOEX)
the Geosphere-Biosphere Programme over the Bay of Ben-           in February–March 1999, show elevated aerosol amounts
gal during spring (March 2016) also show abundant anthro-        near 8–12 km over the Indian Ocean and South Asia (De
pogenic aerosols (sulfate and nitrate) having sources over the   Reus et al., 2001). Recently, using a set of model simula-
Indo-Gangetic Plain (Nair et al., 2017).                         tions, Chavan et al. (2021) reported the transport of biomass
   The aerosol loading over South Asia has been increas-         burning aerosols to the upper troposphere by convection in
ing at an alarming rate (rate of increase in aerosol opti-       spring 2013.
cal depth (AOD) 0.004 yr−1 during 1988–2013) (Babu et               Here, we investigate the source of the very large aerosol
al., 2013). For the last 2 decades, the AOD increase (by         loading over the Arabian Sea during spring and their ver-
12 %) over South Asia has been attributed to the strong in-      tical transport to the upper troposphere and lower strato-
crease in anthropogenic aerosols (sulfate, black carbon, and     sphere (UTLS). We show these aerosols produce atmo-
organic carbon), while natural aerosol remained unchanged        spheric warming, leading to enhanced water vapor that is
(Ramachandran et al., 2020a). The major sources of an-           transported to the UTLS. Once in the lower stratosphere,
thropogenic aerosols are the combustion of domestic fu-          aerosols and water vapor are transported to the Southern
els, industrial emissions, transportation, and open burning      Hemisphere (∼ 45◦ S), with implications for tropospheric
(Paliwal et al., 2016). The growth of the economy of In-         temperatures and stratospheric ozone concentrations. For this
dia led to a 41 % increase in BC and 35 % in organic car-        purpose, we performed a series of five simulations using the
bon (OC) from 2000 to 2010 (Lu et al., 2011). The emis-          ECHAM6-HAMMOZ model in order to investigate the im-
sions of sulfur dioxide (SO2 ) which leads to the production     pact of changes in anthropogenic aerosol over South Asia.
of sulfate aerosols have doubled during 2006–2017 (Fad-          The paper is structured as follows: the ECHAM6-HAMMOZ
navis et al., 2019). Figure 1a–c show the annual mean emis-      model simulations are provided in Sect. 2, and in Sect. 3 we
sion of BC, OC, and sulfate aerosols over South Asia in          discuss the results on the transport of South Asian aerosols
2016 from the AEROCOM-ACCMIP-II emission inventory               to the northern Indian Ocean, radiative forcing, transport into
(discussed in Sect. 2.1). It shows high emissions over the       the UTLS, and associated impacts on heating rates, while
Indo-Gangetic Plain (BC 7 × 10⁻¹² –17 × 10−12 kg m−2 s−1 ,       conclusions are summarized in Sect. 4.
OC: 25 × 10−12 –70 × 10−12 kg m−2 s−1 , sulfate: 2 × 10⁻¹² –
5 × 10⁻¹² kg m−2 s−1 ). Higher amounts of aerosols over the
                                                                 2     Model simulations
Indo-Gangetic Plain are associated with densely populated
regions and industrial and vehicular emissions (Karambelas       2.1    ECHAM6-HAMMOZ experimental setup
et al., 2018; Fadnavis et al., 2019). Past studies also show
substantially higher amounts of aerosols over northern In-       We use the state-of-the-art chemistry–climate model
dia compared to the rest of the Indian region (Ramachan-         ECHAM6-HAMMOZ. It comprises the general circulation
dran et al., 2020b; Fadnavis et al., 2013, 2017a, b). Over the   module ECHAM6, coupled to the aerosol and cloud micro-

Atmos. Chem. Phys., 22, 7179–7191, 2022                                           https://doi.org/10.5194/acp-22-7179-2022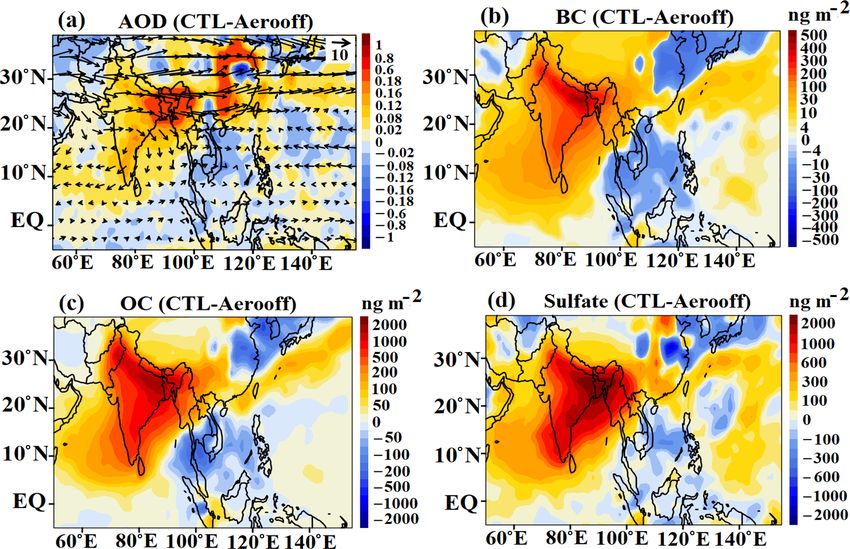
S. Fadnavis et al.: Tropospheric warming by South Asian aerosols                                                                    7181

Figure 1. Spatial distribution for the year 2016 annual mean total emission (kg m−2 s−1 ) of (a) BC, (b) OC, and (c) sulfate aerosols from
the AEROCOM-ACCMIP-II emission inventory and (d) time series of monthly departure from annual mean total emissions (%) of BC, OC,
and sulfate aerosols averaged over the Indo-Gangetic Plain (23–30◦ N, 78–90◦ E).

physics module Hamburg (HAM) (Stier et al., 2005; Tegen                hybrid σ -p levels from the surface up to 0.01 hPa (approx.
et al., 2019). HAM predicts the nucleation, growth, evolu-             80 km). The simulations have been carried out with a time
tion, and sinks of sulfate, black carbon (BC), organic car-            step of 20 min. Monthly varying Atmospheric Model Inter-
bon (OC), sea salt (SS), and mineral dust (DU) aerosols. The           comparison Project (AMIP) sea surface temperature (SST)
size distribution of the aerosol population is described by            and sea ice cover (SIC) (Taylor et al., 2000) were used as
seven log-normal modes (nucleation mode, soluble and in-               lower boundary conditions.
soluble Aitken, soluble and insoluble accumulation, and sol-              We performed five model experiments: (1) a control (CTL)
uble and insoluble coarse modes) (Stier et al., 2005; Zhang            simulation where all aerosol emissions are included and four
et al., 2012; Tegen et al., 2019). Moreover, HAM explic-               perturbed experiments where (2) all anthropogenic aerosol
itly simulates the impact of aerosol species on cloud droplet          emissions (black carbon, organic carbon, and sulfate) are
and ice crystal formation according to prescribed micro-               switched off over South Asia (75–100◦ E, 8–40◦ N; see
physical properties. Aerosol particles can act as cloud con-           Fig. 1) during the study period (2001–2016) (referred to
densation nuclei or as kernels for ice-nucleating particles.           as Aerooff), (3) only anthropogenic black carbon emissions
Other relevant cloud microphysical processes such as evapo-            (BC) are switched off during the study period (BCoff),
ration of cloud droplets, sublimation of ice crystals, ice crys-       (4) only anthropogenic organic carbon (OC) emissions are
tal sedimentation, and detrainment of ice crystals from con-           switched off (OCoff) during the study period, and (5) only
vective cloud tops are simulated interactively (Neubauer et            anthropogenic sulfate aerosol emissions are switched off
al., 2014). The anthropogenic and fire emissions of sulfate,           (Suloff) during the study period (see Table 1). All simu-
black carbon (BC), and organic carbon (OC) are based on                lations were performed from 1 January 2001 to Decem-
the AEROCOM-ACCMIP-II emission inventory. Other de-                    ber 2016 from stabilized initial fields created after a model
tails of the model and emissions are reported by Fadnavis et           integration for 1 year. Dust emission parameterization is
al. (2017a, 2019, 2021a, b).                                           the same in all the simulations and is based on Tegen et
   The model simulations are performed at a T63 spectral res-          al. (2002). The analysis is performed for spring (March–
olution, corresponding to 1.875◦ × 1.875◦ in the horizontal            May) averaged for the period 2001–2016. We compare the
dimension, while the vertical resolution is described by 47            CTL with Aerooff, BCoff, OCoff, and Suloff simulations to

https://doi.org/10.5194/acp-22-7179-2022                                                Atmos. Chem. Phys., 22, 7179–7191, 2022
7182                                                           S. Fadnavis et al.: Tropospheric warming by South Asian aerosols

Figure 2. Spatial distribution of (a) AOD anomalies averaged for spring during 2001–2016 (CTL-Aerooff) and anomalies of tropospheric
column of (b) BC, (c) OC, and (d) sulfate aerosols (ng m−2 ) (CTL-Aerooff). The vectors in Fig. 2a indicate winds (m s−1 ) at 850 hPa.

understand (1) transport pathways of South Asian anthro-                the dominance of anthropogenic aerosols having sources
pogenic aerosols and (2) their impact over the Indian region            over the Indian region (73 %) (Aswini et al., 2020). Anal-
and UTLS (340–400 K). We compare AOD from CTL simu-                     ysis of MODIS satellite observations (2003–2017) likewise
lations with MISR and MODIS data (Sect. S1 in the Supple-               shows that anthropogenic sources contributed ∼ 60 %–70 %
ment). The model performance against MISR and MODIS                     to the aerosol loading over the east coast and west coast of
(Kahn et al., 2007) for the spring season is discussed in               India (Jose et al., 2020).
Sect. S2 and Fig. S1 in the Supplement. We use the 2 PV                    The distribution of anomalies of the tropospheric column
contour in midlatitudes and the 380 K isentrope in the trop-            of BC, OC, and sulfate aerosols also indicates that these
ics as an estimate of the location of the dynamical tropopause          aerosols are transported from South Asia to the Bay of Ben-
(Holton et al., 1995). Note that the PV value at the dynamical          gal and the Arabian Sea (Fig. 2b–d). Enhancement of sul-
tropopause is often somewhat higher than 2 PV and exhibits              fate and OC aerosol (50–2000 ng m−2 ) is higher than BC (4–
a certain variability (Kunz et al., 2011).                              500 ng m−2 ) over the South Asian region (Fig. 2b–d). The
                                                                        total carbonaceous aerosol (BC and OC together) dominates
                                                                        over the sulfate aerosols. These anthropogenic aerosols over
3     Results and discussions
                                                                        the tropical Indian Ocean affect the radiation budget and
3.1    Transport of South Asian aerosols to the northern                cloud cover over the Indian Ocean (Satheesh et al., 2000;
       Indian Ocean                                                     McFarquhar and Wang, 2006).

The spatial distribution of AOD anomalies from the CTL-
                                                                        3.2   Radiative forcing
Aerooff simulation shows positive anomalies of AOD ex-
tending from South Asia to the Arabian Sea and the north-               Anthropogenic aerosols over the tropical Indian Ocean af-
ern Bay of Bengal (10–20◦ N) (Fig. 2a). The wind vectors                fect the radiation budget and cloud cover (McFarquhar and
indicate that these are transported from the Indo-Gangetic              Wang, 2006). Here, we discuss the impact of South Asian
Plain to the Arabian Sea, the Bay of Bengal, and the west-              anthropogenic aerosols on RF. Figure 3a–c show anoma-
ern Pacific. The transported aerosols enhanced the AOD by               lies in net RF at the top of the atmosphere (TOA), sur-
0.18 %–0.8 % (30 %–80 %) over the northern Bay of Bengal                face, and in-atmosphere (TOA–surface) for Aerooff simula-
and by 0.02 %–0.12 % (20 %–60 %) over the Arabian Sea.                  tions (CTL-Aerooff). The anthropogenic aerosols have pro-
This is consistent with previous studies where 50 %–60 % en-            duced a cooling at the TOA (except over the Indo-Gangetic
hancements in the AOD over the tropical Indian Ocean due to             Plain) and at the surface (see Fig. 3a–b). The simulated RF
anthropogenic aerosols have been reported (Satheesh et al.,             values over the Arabian Sea (55–70◦ E, 8–20◦ N), Bay of
2000; Jose et al., 2020). Chemical analysis of aerosols ob-             Bengal (88–92◦ E, 12–20◦ N), and Indo-Gangetic Plain (75–
served over the southeastern coastal Arabian Sea also shows             83◦ E, 26–30◦ N) are tabulated in Table S1 in the Supple-

Atmos. Chem. Phys., 22, 7179–7191, 2022                                                   https://doi.org/10.5194/acp-22-7179-2022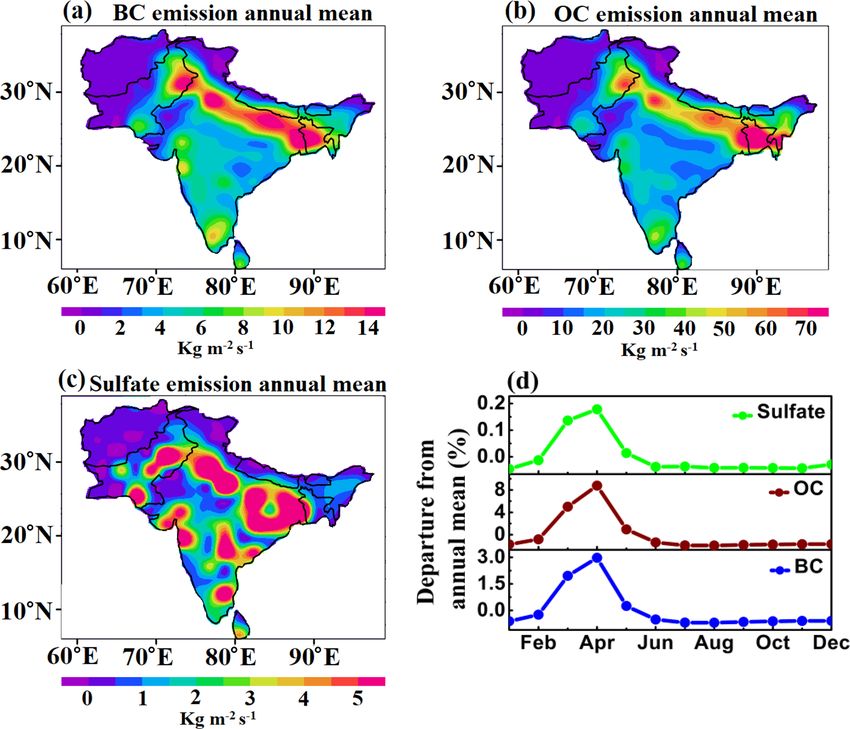
S. Fadnavis et al.: Tropospheric warming by South Asian aerosols 7183
Table 1. Details of ECHAM6-HAMMOZ model simulations performed in this study.
Experiment name Duration Aerosol species on/off Boundary conditions
CTL 2001–2016 All aerosols species globally, as per AEROCOM- AMIP sea surface temperature
ACCMIP-II emission inventory. and sea ice concentration.
Aerooff 2001–2016 Anthropogenic BC, OC, and sulfate aerosols switch AMIP sea surface temperature
off over South Asia during 2001–2016. and sea ice concentration.
BCoff 2001–2016 Anthropogenic BC aerosols switch off over South AMIP sea surface temperature
Asia during 2001–2016. and sea ice concentration.
OCoff 2001–2016 Anthropogenic OC aerosols switch off over South AMIP sea surface temperature
Asia during 2001–2016. and sea ice concentration.
Suloff 2001–2016 Anthropogenic sulfate aerosols switch off over AMIP sea surface temperature
South Asia during 2001–2016. and sea ice concentration.
ment. The RF estimates show that the aerosols have pro- l) aerosols have produced significant cooling at the
duced cooling at the TOA and surface over the Arabian Sea TOA (OC: −0.21 ± 0.13 to −0.44 ± 0.15 W m−2 ; sulfate:
(TOA: −0.72 ± 0.14 W m−2 , surface: −3.0 ± 0.28 W m−2 ), −1.55 ± 0.16 to −2.14 ± 0.17 W m−2 ) and surface (OC:
Bay of Bengal (TOA: −1.24 ± 0.15 W m−2 , surface: −0.49 ± 0.31 to −2.56 ± 0.45 W m−2 , sulfate: −1.19 ± 0.24
−5.14 ± 0.44 W m−2 ), and in-atmospheric warming over to −2.67 ± 0.36 W m−2 ) over the above regions (listed in
the above regions (Arabian Sea +2.27 ± 0.19 W m−2 ; Table S1). Figure 3d, g, and j further confirm our finding
Bay of Bengal: +3.89 ± 0.30 W m−2 ) (Fig. 3c). The that the positive anomalies of radiative forcing in the Indo-
Indo-Gangetic Plain shows positive anomalies of RF at Gangetic Plain are due to BC aerosols because of their ab-
the TOA (+1.27 ± 0.16 W m−2 ), negative at the surface sorbing property. All the aerosols produce in-atmospheric
(−11.16 ± 0.50 W m−2 ), and an atmospheric warming of warming over the Indian region (Fig. 3c, f, i, l) and the north-
+12.44 ± 0.42 W m−2 . In agreement with our results, pre- ern Indian Ocean (Fig. 3c, f, i). The atmospheric warming
vious studies have reported negative RF at the surface and over the Arabian Sea and Bay of Bengal is due to BC and
TOA and atmospheric warming over the northern Indian OC aerosols with larger contributions by the BC aerosols.
Ocean caused by enhanced anthropogenic aerosol. For ex-
ample, Pathak et al. (2020) reported negative aerosol RF at
3.3 Transport of Asian anthropogenic aerosols into the
the TOA (−2 to −4 W m−2 ) over the Bay of Bengal and the
UTLS
Arabian Sea during spring 2009–2013. The clear-sky aerosol
direct radiative forcing estimated from measurements dur- Further, we investigate the vertical distribution of aerosols
ing the INDOEX experiment (January to March in 1999) that are transported to the northern Indian Ocean. This anal-
over the northern Indian Ocean also show similar results ysis is performed on isentropic levels, since past studies
(TOA: −7 W m−2 , surface: −23 W m−2 , and in-atmosphere: show that air mass transport from the troposphere to the
+16 W m−2 ) (Ramanathan et al., 2001). There is a large vari- stratosphere occurs largely along quasi-isentropic surfaces
ation in the magnitude of RF (at the TOA, surface, and in- (Ploeger et al., 2017; Yan et al., 2021). In spring, Asian
atmosphere) reported from observations and our model sim- aerosols are transported partly to the Arabian Sea and Bay of
ulations. This may be due to different regions and different Bengal region and partly to the western Pacific (Fig. 2a–d).
time periods and the relatively coarse model resolution. The Hence the meridional section is shown over the Indian Ocean
observation-based studies attribute positive in-atmospheric and western Pacific region (30–140◦ E) (Fig. 4a–c). The ver-
radiative forcing to absorbing aerosols (especially black car- tical distribution of BC, OC, and sulfate aerosols indicates
bon) that lead to a heating of the atmosphere (Rajeev and that these aerosols are transported from the boundary layer
Ramanathan, 2001; Satheesh et al., 2002). (10–30◦ N) into the UTLS (340–400 K) (Figs. 4a–c and S2).
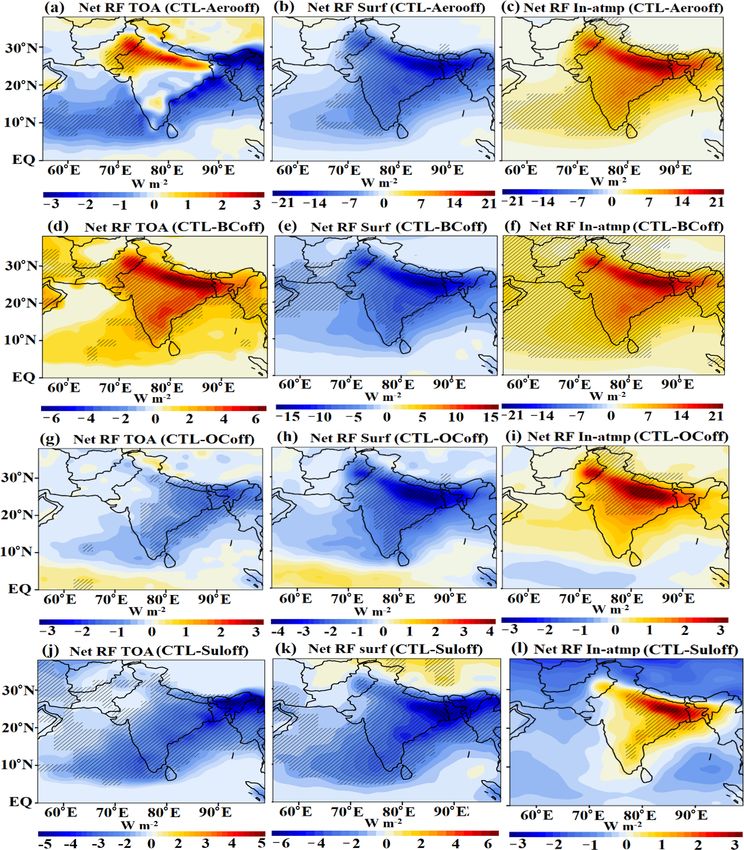
The analysis of the perturbed model experiments In the UTLS, at ∼ 350–390 K they are transported south-
indicates that anthropogenic BC aerosols (Fig. 3d–f) ward (∼ 30◦ S) and downward (∼ 320–340 K). The quasi-
have produced a warming at the TOA (Arabian Sea: isentropic transport occurs via two pathways: (1) over Africa
1.24 ± 0.13 W m−2 , Bay of Bengal: 1.54 ± 0.26 W m−2 , (20–60◦ E) and (2) over the East Indian Ocean and western
Indo-Gangetic Plain: 4.33 ± 0.17 W m−2 ) and cooling at Pacific (95–140◦ E) (Fig. 4d–f). The downward penetration
the surface (Arabian Sea: −2.56 ± 0.25 W m−2 , Bay of aerosols (BC, OC, and sulfate) in the Southern Hemi-
of Bengal: −3.70 ± 0.49 W m−2 , Indo-Gangetic Plain: sphere (15–30◦ S) to 320–340 K via the above-mentioned
−9.27 ± 0.37 W m−2 ). OC (Fig. 3g–i) and sulfate (Fig. 3j– two pathways is also evident in Fig. 4g–i.
https://doi.org/10.5194/acp-22-7179-2022 Atmos. Chem. Phys., 22, 7179–7191, 2022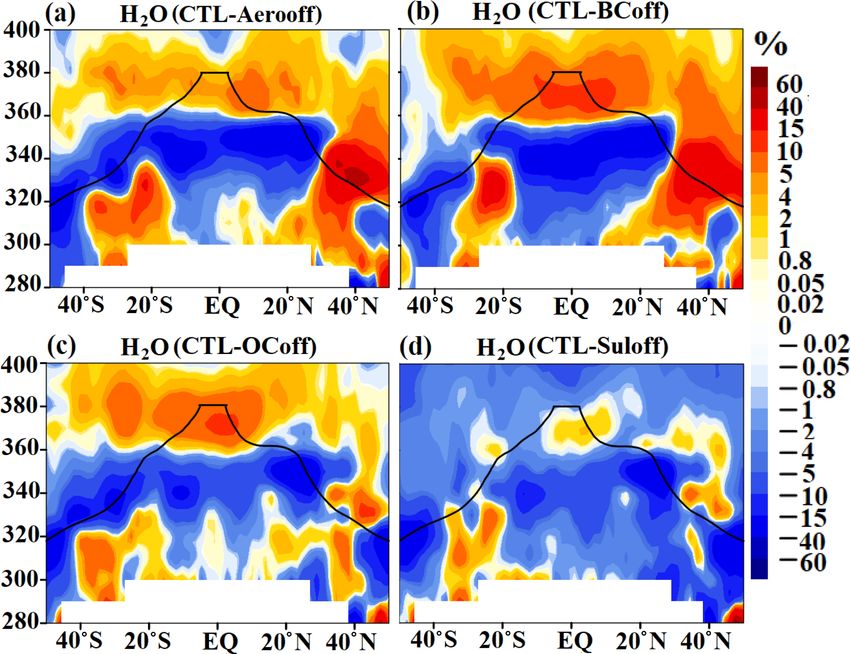
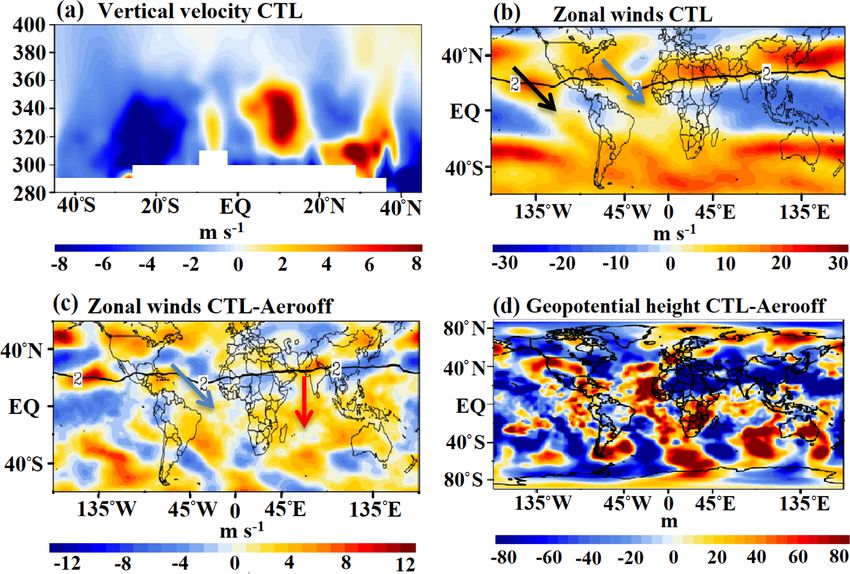
7184                                                            S. Fadnavis et al.: Tropospheric warming by South Asian aerosols

Figure 3. Spatial distribution of net aerosol radiative forcing (CTL-Aerooff) (W m−2 ) averaged for spring for the years 2001–2016 for
(a) TOA. (b) Same as (a) but for surface. (c) Same as (a) but for in-atmosphere (TOA–surface). (d) Spatial distribution of radiative forcing
at the TOA (CTL-BCoff) averaged for spring for the years 2001–2016. (e) Same as (d) but for surface. (f) Same as (d) but for in-atmosphere
(TOA–surface). (g) Spatial distribution of radiative forcing at the TOA (CTL-OCoff) averaged for spring during 2001–2016. (h) Same as
(g) but for surface. (i) Same as (h) but for in-atmosphere (TOA–surface). (j) Spatial distribution of radiative forcing at the TOA (CTL-Suloff)
averaged for spring during 2001–2016. (k) Same as (j) but for surface. (l) Same as (k) but for in-atmosphere (TOA–surface). The hatched
lines in (a–l) indicate 99 % confidence level for the mean differences.

   In the following, we further explore processes responsi-               Atlantic westerly ducts during the spring season. Figure 5c
ble for interhemispheric transport. Our analysis indicates that           shows that changes in South Asian aerosols concentrations
the Hadley circulation (Figs. 5a and S3) with its ascend-                 cause a shift in the Pacific duct. Thus interhemispheric trans-
ing branch over the Indian Ocean and adjoining region (60–                port occurs through (1) an Atlantic duct and (2) a slightly
140◦ E, 0–30◦ N) lifts the South Asian aerosols to the UTLS.              shifted Pacific duct (5◦ S–5◦ N, 50–140◦ E), i.e. over the In-
These aerosols enter the westerly jet (Fig. 4d–f).                        dian Ocean–western Pacific region (also see Fig. 4d–f). The
   The distribution of zonal winds in Fig. 5b shows trans-                shift in Pacific duct as a response to South Asian aerosol
port into the Southern Hemisphere preferentially in regions               changes is likely due to higher Rossby wave breaking near
of equatorial westerly winds, so-called “westerly duct” re-               South Asia. The geopotential (Fig. 5d) and potential vortic-
gions (Waugh and Polvani, 2000; Yan et al., 2021), where                  ity (Fig. S5) anomalies (CTL-Aerooff) show Rossby wave
Rossby wave breaking occurs (Figs. 5b and S4). This is con-               breaking near the Indian Ocean–western Pacific region that
sistent with findings from Frederiksen et al. (2018), who have            could lead to southern hemispheric transport through the In-
also shown interhemispheric transport of CO2 via Pacific and              dian Ocean–western Pacific region path (Fig. 5c–d). In addi-

Atmos. Chem. Phys., 22, 7179–7191, 2022                                                      https://doi.org/10.5194/acp-22-7179-2022
S. Fadnavis et al.: Tropospheric warming by South Asian aerosols                                                                     7185

Figure 4. Meridional cross-section over Indian Ocean–western Pacific (averaged 30–140◦ E and for the spring season for the years 2001–
2016) of anomalies (%) (CTL-Aerooff) of (a–c) BC, OC, and sulfate aerosols. Green contours in (a–c) indicate westerly jet. (d–f) Spatial
distribution of BC, OC, and sulfate aerosols averaged at 360–390 K isentropic levels and the spring season for the years 2001–2016. Vectors
in (d–f) indicate anomalies of winds (m s−1 ). (g–i) Zonal cross-section (averaged over 15–30◦ S and for the spring season for the years
2001–2016) and for the spring season for BC, OC, and sulfate aerosols. The black line of 2 PV (in a–c and g–i) indicates the dynamical
tropopause.

tion, the interhemispheric transport is also likely influenced          the aerosol changes; any changes in dynamical heating will
by the monthly migration and the strength of the Hadley cir-            be intrinsic. The vertical distribution of net heating rate
culation (Fig. S3).                                                     anomalies over the northern Indian Ocean and western Pa-
   Further, in the UTLS, South Asian aerosols are transported           cific region (30–140◦ E) indicates increase in heating rates
to the Arctic (Fig. 4a–c). There is an aerosol enhancement in           in the region of elevated anthropogenic aerosols in the tro-
the Arctic (BC: 10 % to 30 %, OC: 10 % to 20 %, sulfate:                posphere (0.15 to 0.4 K per month, 5 %–60 %) and UTLS
5 % to 30 %). Our analysis shows that transport to the Arctic           (0.02 to 0.3 K per month, 10 %–60 %) (Figs. 6a–d, 4, and S2).
occurs every year in the UTLS, which causes heating in the              Heating rate anomalies estimated over the northern Indian
lower stratosphere (380–400 K) (see Sect. 3.4).                         Ocean and western Pacific region from BC (CTL-BCoff),
                                                                        OC (CTL-OCoff), and sulfate (CTL-Suloff) show that BC
                                                                        and OC aerosols produce heating in the troposphere (280–
3.4   Impacts on the net heating rate and water vapor                   340 K) (10–40◦ N) (BC: 0.6 to 2 K per month, 10 %–50 %,
Carbonaceous aerosols absorb solar radiation, leading to at-            OC: 0.2 to 0.4 K per month, 0.5 %–4 %) and UTLS over the
mospheric heating, while predominately scattering aerosols              Northern Hemisphere (BC: 0.08 to 0.2 K per month, 30 %–
such as sulfate reflect and scatter back solar radiation, there-        45%, OC: 0.02 to 0.06 K per month, 0.2 %–1.5 %), while sul-
fore cooling the atmosphere below (Fadnavis et al., 2019).              fate aerosols produce atmospheric cooling in the troposphere
Here, we analyze net heating rates (shortwave + longwave)               and UTLS of −0.02 to −0.4 K per month (5 %–40 %) (280–
induced by all the anthropogenic Asian aerosols (CTL-                   400 K) (Fig. 6a–d). Black carbon aerosol produces higher
Aerooff). Changes in the net heating rates are induced by               heating than organic carbon aerosols. The shortwave heating

https://doi.org/10.5194/acp-22-7179-2022                                                 Atmos. Chem. Phys., 22, 7179–7191, 2022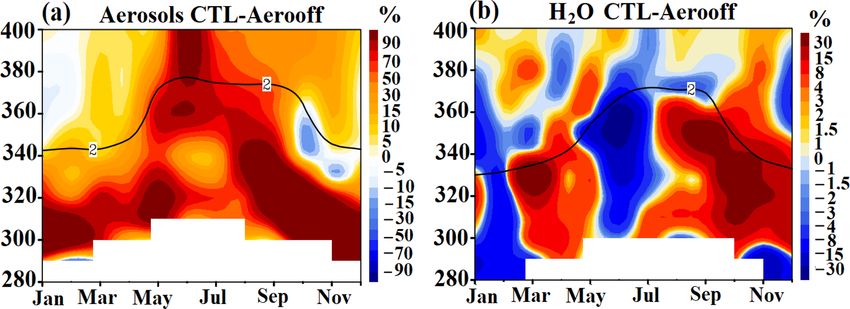
7186                                                           S. Fadnavis et al.: Tropospheric warming by South Asian aerosols

Figure 5. (a) Meridional cross-section of vertical velocities (m s−1 ) (averaged for 65–140◦ E and for spring season during 2001–2016).
Vertical velocities are scaled by 300. (b) Zonal winds at the 360 K isentropic level from CTL simulations, where a black arrow indicates the
Pacific duct, and a blue arrow indicates the Atlantic duct. (c) Anomalies (CTL-Aerooff) of zonal winds at the 360 K isentropic level. A blue
arrow indicates the Atlantic duct, and a red arrow indicates the duct over the Indian Ocean. (d) Anomalies (CTL-Aerooff) of geopotential
height (m) at the 340 K potential temperature level. The potential vorticity (2 PV) is indicated by the black contour in b–c.

Figure 6. Meridional cross-section of heating rates (K per month) over the Indian Ocean–western Pacific (averaged 30–140◦ E and for the
spring season for the years 2001–2016) (a) from the CTL-Aerooff simulation. (b) Same (a) but from the CTL-BCoff simulation. (c) Same
(a) but from the CTL-OCoff simulation. (d) Same (a) but from the CTL-Suloff simulation. Hatched lines in (a–d) indicate the 95 % signifi-
cance level. A black line in (a–d) indicates the dynamical tropopause.

due to BC aerosols is the major contributor to the total heat-          vapor enhancement by BC aerosols over the Indian Ocean–
ing. In general, these aerosols increase heating in the tropo-          western Pacific region is ∼ 1 %–15 % (Fig. 7b). The water
sphere extending to the lower stratosphere (400 K) over the             vapor enhancement by OC aerosols in the UTLS region is
South Asian region (Fig. 6a). There is enhancement in heat-             0.8 %–15 % (Fig. 7c) and by sulfate aerosols ∼ 0.2 %–1 % in
ing rates along the path of aerosols transported to the Arctic.         pockets (Fig. 7d).
   The vertical distribution of water vapor over the Indian                Although the focus of the paper is on the transport of
Ocean–western Pacific region (30–140◦ E) (CTL-Aerooff)                  aerosols during the spring season, it should be noted that
shows that water vapor concentrations are enhanced by 1 %–              anthropogenic South Asian aerosols are also transported to
10 % along the path of elevated aerosols (Figs. 7a and 4). In           the UTLS during the monsoon season (Shindell et al., 2008;
the UTLS, water vapor is transported to the Southern Hemi-              Fadnavis et al., 2013, 2017, 2019; Zheng et al., 2021). An-
sphere ∼ 45◦ S. This may be due to heating caused by the                nual distribution anomalies of aerosols (average of BC, OC,
Asian aerosols. The impact of BC (CTL-BCoff), OC (CTL-                  and sulfate) show the transport of aerosols into the UTLS
OCoff), and sulfate (CTL-Suloff) on the water vapor distri-             during the spring and monsoon season (April to September)
bution (Fig. 7b–d) shows that BC aerosols play a major role             from the South Asian region (Fig. 8a). In the lower strato-
in water vapor enhancement in the UTLS (Fig. 7b). Water                 sphere, these aerosols persist for a few months (Fig. 8a);

Atmos. Chem. Phys., 22, 7179–7191, 2022                                                    https://doi.org/10.5194/acp-22-7179-2022

S. Fadnavis et al.: Tropospheric warming by South Asian aerosols 7187
Figure 8. (a) Annual distribution of anomalies of aerosols (CTL-
Aerooff) (averaged of BC, OC and sulfate aerosols) (%) averaged
over the South Asian region (50–100◦ E, 20–40◦ N). (b) same as
(a) but for water vapor (%) over the northern Indian Ocean–western
Pacific (30–140◦ E, 20–40◦ N). A black line in (a–b) indicates the
dynamical tropopause.
vapor by 0.45 ppmv globally during 2003–2017 (Yue et al.,
Figure 7. (a) Meridional cross-section over the Indian Ocean– 2019). Thus the radiative forcing due to water vapor increase
western Pacific (averaged over 30–140◦ E) of anomalies of water (0.02–0.14 ppmv) in response to South Asian anthropogenic
vapor (%) (CTL-Aerooff) for the spring season for the years 2001–
aerosols is not negligible for surface warming globally. Fur-
2016. (b) Same as (a) but from CTL-BCoff simulations. (c) Same
as (a) but from CTL-OCoff simulations. (d) Same as (a) but from
ther, increasing stratospheric water vapor could also lead to
CTL-Suloff simulations. A black line in (a–d) indicates the dynam- ozone depletion (e.g., Shindell, 2001; Robrecht et al., 2019).
ical tropopause.
4 Conclusions
thus their effect will be seen for an extended time. These A series of ECHAM6-HAMMOZ chemistry–climate simu-
aerosols enhance tropospheric heating, thereby transporting lations for South Asian anthropogenic aerosols were used to
elevated water vapor into the lower stratosphere (Fig. 8b). understand the transport pathways of South Asian aerosols
Figure 8a also shows the transport of aerosols into the lower in spring and their impacts on the UTLS. The model simu-
stratosphere during spring and the monsoon seasons (March– lations show that large amounts of South Asian aerosols are
September). The aerosol-induced enhanced water vapor also transported during spring to the Arabian Sea (increases in
shows enhancement in the lower stratosphere during the AOD by 0.02–0.12 from CTL-Aerooff) and Bay of Bengal
same time (Fig. 8b). (increases in AOD by 0.16 to 0.8 from CTL-Aerooff) and
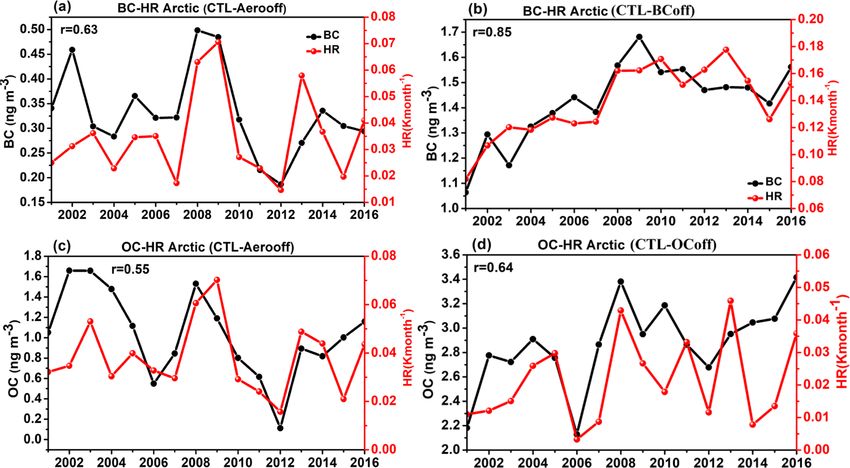
Further, we analyze the correlation between heating rates western Pacific (increases in AOD by 0.08 to 0.18). These
and carbonaceous aerosol amounts in the UTLS (380 K level) aerosols are further lifted up into the UTLS from the northern
in the Arctic during 2001–2016 (spring mean) (Fig. 9) from Indian Ocean and South Asia (10–30◦ N). In the UTLS, they
Aerooff, BCoff, and OCoff in comparison with CTL simula- are also transported to the Southern Hemisphere (15–30◦ S)
tions. The carbonaceous aerosols show a positive correlation and downward (320–340 K). The processes responsible for
(correlation coefficient r: 0.55 to 0.85) with the UTLS heat- interhemispheric transport are as follows:
ing rates, indicating that transported carbonaceous aerosols
enhance UTLS heating in the Arctic. It should be noted that 1. South Asian aerosols are lifted up to the UTLS by
increase in aerosols at the Arctic also occurs during the mon- the ascending branch of the Hadley circulation. In the
soon season (Fadnavis et al., 2017a, b, 2019; Zheng et al., UTLS, the aerosols enter the westerly jet.
2021), which may affect the dynamics and aerosol amounts
2. They are transported to the Southern Hemisphere via
in the spring of the next year in the UTLS.
the Atlantic westerly duct (5◦ S–5◦ N, 10–40◦ W) and
Importantly, South Asian aerosols enhance water vapor in
Pacific westerly duct (5◦ S–5◦ N, 50–140◦ E).
the lower stratosphere in the tropical and subtropical latitudes
(45◦ S–45◦ N). Water vapor, being a greenhouse gas, further 3. A shift in the Pacific westerly duct may be due to an
enhances the heating of the troposphere, leading to a posi- increase in Rossby wave breaking over the northern In-
tive feedback. The increase in water vapor in the stratosphere dian Ocean–western Pacific, induced by South Asian
also warms the Earth’s surface (Shindell, 2001; Solomon aerosols.
et al., 2010). Solomon et al. (2010) estimated that an in-
crease in stratospheric water vapor by 1 ppmv accounts for Anthropogenic aerosol produces significant radiative im-
0.24 W m−2 radiative forcing at the TOA. The SABER and pacts over the Indo-Gangetic Plain (RF anomalies estimated
MLS observations showed an increase in stratospheric water from CTL-Aerooff simulations, TOA: +1.27 ± 0.16 W m−2 ,
https://doi.org/10.5194/acp-22-7179-2022 Atmos. Chem. Phys., 22, 7179–7191, 20227188 S. Fadnavis et al.: Tropospheric warming by South Asian aerosols
Figure 9. (a) Time series of BC aerosols and heating rates averaged for spring in the UTLS (380 K) in the Arctic (65–85◦ N, 0–360◦ ) (from
CTL-Aerooff). (b) Same as (a) but from CTL-BCoff. (c) Same as (a) but for OC. (d) Same as (c) but from CTL-OCoff. The correlation
coefficient (r) between anomalies of BC / OC aerosols and heating rates is indicated in (a–d).
surface: −11.16 ± 0.50 W m−2 , in-atmosphere: Supplement. The supplement related to this article is available
+12.44 ± 0.42 W m−2 ) and the Arabian Sea (RF at the online at: https://doi.org/10.5194/acp-22-7179-2022-supplement.
TOA: −0.72 ± 0.14 W m−2 , surface: −3.00 ± 0.28 W m−2 ,
in-atmosphere: +2.27 ± 0.19 W m−2 ). Interestingly, RF
at the TOA over the Indo-Gangetic Plain is positive Author contributions. SF initiated the idea. AJ, SS, and AA per-
(+4.33 ± 0.17 W m−2 ) due to the emission of BC aerosols formed model analysis. RM and AR contributed to analysis and
alone. Anthropogenic aerosols enhance heating in the study design. All authors contributed to the writing and discussions
of the manuscript.
troposphere over the northern Indian Ocean (estimated from
CTL-Aerooff) by 0.15 to 0.4 K per month (4 %–60 %) and
the UTLS by 0.02 to 0.3 K per month (10 %–60 %).
Competing interests. At least one of the (co-)authors is a mem-
The heating of the troposphere by carbonaceous aerosol
ber of the editorial board of Atmospheric Chemistry and Physics.
(mainly BC) increases temperature and thereby tropospheric The peer-review process was guided by an independent editor, and
water vapor amounts over the northern Indian Ocean and ad- the authors also have no other competing interests to declare.
joining regions. The elevated water vapor is transported to
the UTLS from the northern Indian Ocean–western Pacific
region (30–40◦ E, 20–40◦ N). In the UTLS it is transported Disclaimer. Publisher’s note: Copernicus Publications remains
to the Southern Hemisphere at ∼ 45◦ S. BC aerosols play a neutral with regard to jurisdictional claims in published maps and
major role in water vapor enhancement in the lower strato- institutional affiliations.
sphere (increased water vapor by 0.8 %–5 %). As water vapor
is a greenhouse gas, this enhancement of stratospheric water
vapor could potentially amplify the warming of the tropo- Acknowledgements. The authors thank the staff of the High-
sphere and surface and cause a positive feedback (e.g., Shin- Performance Computing (HPC) system at the Indian Institute of
dell, 2001; Solomon et al., 2010). Tropical Meteorology, Pune, India. We thank the reviewers for their
valuable suggestions. We thank Jonathon Wright for useful discus-
sions and suggestions that improved the quality of the manuscript.
Data availability. The data used in this study are generated from
ECHAM6-HAMMOZ model simulations at the High-Performance
Computing system at the Indian Institute of Tropical Meteorol- Review statement. This paper was edited by Yves Balkanski and
ogy, Pune, India. The AOD data from MODIS Terra used here reviewed by Jonathon Wright and one anonymous referee.
can be downloaded from https://ladsweb.modaps.eosdis.nasa.gov/
archive/allData/61/MODATML2/ (last access: 1 November 2021,
NASA, 2021a) and MISR from https://misr.jpl.nasa.gov/getData/
accessData/ (last access: 1 November 2021, NASA, 2021b).
Atmos. Chem. Phys., 22, 7179–7191, 2022 https://doi.org/10.5194/acp-22-7179-2022S. Fadnavis et al.: Tropospheric warming by South Asian aerosols 7189
References Fadnavis, S., Roy, C., Sabin, T. P., Ayantika, D. C., and Ashok, K.:
Potential modulations of pre-monsoon aerosols during El Niño:
impact on Indian summer monsoon, Clim. Dynam., 49, 2279–
Aswini, A. R., Hegde, P., Aryasree, S., Girach, I. A., and 2290, https://doi.org/10.1007/s00382-016-3451-6, 2017a.
Nair, P. R.: Continental outflow of anthropogenic aerosols Fadnavis, S., Kalita, G., Kumar, K. R., Gasparini, B., and Li, J.-L.
over Arabian Sea and Indian Ocean during wintertime: F.: Potential impact of carbonaceous aerosol on the upper tropo-
ICARB-2018 campaign, Sci. Total Environ., 712, 135214, sphere and lower stratosphere (UTLS) and precipitation during
https://doi.org/10.1016/j.scitotenv.2019.135214, 2020. Asian summer monsoon in a global model simulation, Atmos.
Babu, S. S., Manoj, M. R., Moorthy, K. K., Gogoi, M. M., Nair, Chem. Phys., 17, 11637–11654, https://doi.org/10.5194/acp-17-
V. S., Kompalli, S. K., Satheesh, S. K., Niranjan, K., Ram- 11637-2017, 2017b.
agopal, K., Bhuyan, P. K., and Singh, D.: Trends in aerosol Fadnavis, S., Müller, R., Kalita, G., Rowlinson, M., Rap, A., Li,
optical depth over Indian region: Potential causes and im- J.-L. F., Gasparini, B., and Laakso, A.: The impact of recent
pact indicators, J. Geophys. Res.-Atmos., 118, 11794–11806, changes in Asian anthropogenic emissions of SO2 on sulfate
https://doi.org/10.1002/2013JD020507, 2013. loading in the upper troposphere and lower stratosphere and the
Budhavant, K., Bikkina, S., Andersson, A., Asmi, E., Back- associated radiative changes, Atmos. Chem. Phys., 19, 9989–
man, J., Kesti, J., Zahid, H., Satheesh, S. K., and Gustafs- 10008, https://doi.org/10.5194/acp-19-9989-2019, 2019.
son, Ö.: Anthropogenic fine aerosols dominate the wintertime Fadnavis, S., Sabin, T. P., Rap, A., Müller, R., Kubin, A., and
regime over the northern Indian Ocean, Tellus B, 70, 1–15, Heinold, B.: The impact of COVID-19 lockdown measures on
https://doi.org/10.1080/16000889.2018.1464871, 2018. the Indian summer monsoon, Environ. Res. Lett., 16, 074054,
Chavan, P., Fadnavis, S., Chakroborty, T., Sioris, C. E., Griessbach, https://doi.org/10.1088/1748-9326/ac109c, 2021a.
S., and Müller, R.: The outflow of Asian biomass burning car- Fadnavis, S., Müller, R., Chakraborty, T., Sabin, T. P., Laakso, A.,
bonaceous aerosol into the upper troposphere and lower strato- Rap, A., Griessbach, S., Vernier, J.-P., and Tilmes, S.: The role
sphere in spring: radiative effects seen in a global model, Atmos. of tropical volcanic eruptions in exacerbating Indian droughts,
Chem. Phys., 21, 14371–14384, https://doi.org/10.5194/acp-21- Sci. Rep., 11, 2714, https://doi.org/10.1038/s41598-021-81566-
14371-2021, 2021. 0, 2021b.
Corrigan, C. E., Roberts, G. C., Ramana, M. V., Kim, D., and Frederiksen, J. S. and Francey, R. J.: Unprecedented strength
Ramanathan, V.: Capturing vertical profiles of aerosols and of Hadley circulation in 2015–2016 impacts on CO2 inter-
black carbon over the Indian Ocean using autonomous un- hemispheric difference, Atmos. Chem. Phys., 18, 14837–14850,
manned aerial vehicles, Atmos. Chem. Phys., 8, 737–747, https://doi.org/10.5194/acp-18-14837-2018, 2018.
https://doi.org/10.5194/acp-8-737-2008, 2008. Holton, J. R., Haynes, P. H., McIntyre, M. E., Dou-
Collins, M., Sutherland, M., Bouwer, L., Cheong, S.-M., Frölicher, glass, A. R., Rood, R. B., and Pfister, L.: Stratosphere-
T. L., Jacot Des Combes, H., Roxy, M. K., Losada, I., McInnes, troposphere exchange, Rev. Geophys., 33, 403–439,
K. L., Ratter, B., Rivera-Arriaga, E., Susanto, R. D., Swinge- https://doi.org/10.1029/95RG02097, 1995.
douw, D., and Tibig, L.: Extremes, Abrupt Changes and Manag- Jose, S., Nair, V. S., and Babu, S. S.: Anthropogenic emis-
ing Risk, in: IPCC Special Report on the Ocean and Cryosphere sions from South Asia reverses the aerosol indirect ef-
in a Changing Climate, edited by: Pörtner, H.-O., Roberts, D. fect over the northern Indian Ocean, Sci. Rep., 10, 18360,
C., Masson-Delmotte, V., Zhai, P., Tignor, M., Poloczanska, https://doi.org/10.1038/s41598-020-74897-x, 2020.
E., Mintenbeck, K., Alegría, A., Nicolai, M., Okem, A., Pet- Karambelas, A., Holloway, T., Kinney, P. L., Fiore, A. M., De-
zold, J., Rama, B., and Weyer, N. M., Cambridge University fries, R., Kiesewetter, G., and Heyes, C.: Urban versus rural
Press, Cambridge, UK and New York, NY, USA, 589–655, health impacts attributable to PM2.5 and O3 in northern India,
https://doi.org/10.1017/9781009157964.008, 2019. Environ. Res. Lett., 13, 064010, https://doi.org/10.1088/1748-
De Reus, M., Krejci, R., Williams, J., Fischer, H., Scheele, R., and 9326/aac24d, 2018.
Ström, J.: Vertical and horizontal distributions of the aerosol Kahn, R. A., Garay, M. J., Nelson, D. L., Yau, K. K., Bull,
number concentration and size distribution over the northern M. A., Gaitley, B. J., Martonchik, J. V., and Levy, R. C.:
Indian Ocean, J. Geophys. Res.-Atmos., 106, 28629–28641, Satellite-derived aerosol optical depth over dark water from
https://doi.org/10.1029/2001JD900017, 2001. MISR and MODIS: Comparisons with AERONET and implica-
Dickerson, R. R., Andreae, M. O., Campos, T., Mayol-Bracero, O. tions for climatological studies, J. Geophys. Res., 112, D18205,
L., Neusuess, C., and Streets, D. G.: Analysis of black carbonand https://doi.org/10.1029/2006JD008175, 2007.
carbon monoxide observed over the Indian Ocean: Implications Kunz, A., Konopka, P., Müller, R., and Pan, L. L.: The
for emissions and photochemistry, J. Geophys. Res., 107, 8017, dynamical tropopause based on isentropic potential
doi:10.1029/2001JD000501, 2002. vorticity gradients J. Geophys. Res., 116, D01110,
Fadnavis, S. and Chattopadhyay, R.: Linkages of subtropi- https://doi.org/10.1029/2010JD014343,2011.
cal stratospheric intraseasonal intrusions with Indian sum- Lu, Z., Zhang, Q., and Streets, D. G.: Sulfur dioxide and
mer monsoon deficit rainfall, J. Climate, 30, 5083–5095, primary carbonaceous aerosol emissions in China and
https://doi.org/10.1175/JCLI-D-16-0463.1, 2017. India, 1996–2010, Atmos. Chem. Phys., 11, 9839–9864,
Fadnavis, S., Semeniuk, K., Pozzoli, L., Schultz, M. G., Ghude, https://doi.org/10.5194/acp-11-9839-2011, 2011.
S. D., Das, S., and Kakatkar, R.: Transport of aerosols into the Mahowald, N. M., Hamilton, D. S., Mackey, K. R. M., Moore, J. K.,
UTLS and their impact on the Asian monsoon region as seen in Baker, A. R., Scanza, R. A., and Zhang, Y.: Aerosol trace metal
a global model simulation, Atmos. Chem. Phys., 13, 8771–8786,
https://doi.org/10.5194/acp-13-8771-2013, 2013.
https://doi.org/10.5194/acp-22-7179-2022 Atmos. Chem. Phys., 22, 7179–7191, 20227190 S. Fadnavis et al.: Tropospheric warming by South Asian aerosols leaching and impacts on marine microorganisms, Nat. Commun., Asia as a result of changing content and composition, Sci. Rep., 9, 2614, https://doi.org/10.1038/s41467-018-04970-7, 2018. 10, 20091, https://doi.org/10.1038/s41598-020-76936-z, 2020a. Mayol-Bracero, O. L., Gabriel, R., Andreae, M. O., Kirchstetter, Ramachandran, S., Rupakheti, M., and Lawrence, M. G.: Black car- T. W., Novakov, T., Ogren, J., Sheridan, P., and Streets, D. G.: bon dominates the aerosol absorption over the Indo-Gangetic Carbonaceous aerosols over the Indian Ocean during the Indian Plain and the Himalayan foothills, Environ. Int., 142, 105814, Ocean Experiment (INDOEX): Chemical characterization, opti- https://doi.org/10.1016/j.envint.2020.105814, 2020b. cal properties, and probable sources, J. Geophys. Res.-Atmos., Ramanathan, V., Crutzen, P. J., Lelieveld, J., Mitra, A. P., Al- 107, 8030, https://doi.org/10.1029/2000JD000039, 2002. thausen, D., Anderson, J., Andreae, M. O., Cantrell, W., Cass, McFarquhar, G. M. and Wang, H.: Effects of aerosols on trade G. R., Chung, C. E., Clarke, A. D., Coakley, J. A., Collins, wind cumuli over the Indian Ocean: Model simulations, Q. J. R. W. D., Conant, W. C., Dulac, F., Heintzenberg, J., Heyms- Meteorol. Soc., 132, 821–843, https://doi.org/10.1256/qj.04.179, field, A. J., Holben, B., Howell, S., Hudson, J., Jayaraman, A., 2006. Kiehl, J. T., Krishnamurti, T. N., Lubin, D., McFarquhar, G., Meehl, G. A., Arblaster, J. M., and Collins, W. D.: Effects of black Novakov, T., Ogren, J. A., Podgorny, I. A., Prather, K., Priest- carbon aerosols on the Indian monsoon, J. Climate, 21, 2869– ley, K., Prospero, J. M., Quinn, P. K., Rajeev, K., Rasch, P., 2882, https://doi.org/10.1175/2007JCLI1777.1, 2008. Rupert, S., Sadourny, R., Satheesh, S. K., Shaw, G. E., Sheri- Nair, V. S., Babu, S. S., Manoj, M. R., Moorthy, K. K., and dan, P. and Valero, F. P. J.: Indian Ocean Experiment: An in- Chin, M.: Direct radiative effects of aerosols over South Asia tegrated analysis of the climate forcing and effects of the great from observations and modeling, Clim. Dynam., 49, 1411–1428, Indo-Asian haze, J. Geophys. Res.-Atmos., 106, 28371–28398, https://doi.org/10.1007/s00382-016-3384-0, 2017. https://doi.org/10.1029/2001JD900133, 2001. NASA: MODIS, [data set], https://ladsweb.modaps.eosdis.nasa. Ramanathan, V., Chung, C., Kim, D., Bettge, T., Buja, L., Kiehl, gov/archive/allData/61/MODATML2/, last access: 1 November J. T., Washington, W. M., Fu, Q., Sikka, D. R., and Wild, M.: 2021a. Atmospheric brown clouds: Impacts on South Asian climate and NASA: MISR, [data set], https://misr.jpl.nasa.gov/getData/ hydrological cycle, P. Natl. Acad. Sci. USA, 102, 5326–5333, accessData/, last access: 1 November 2021b. https://doi.org/10.1073/pnas.0500656102, 2005. Neubauer, D., Lohmann, U., Hoose, C., and Frontoso, M. G.: Im- Robrecht, S., Vogel, B., Grooß, J.-U., Rosenlof, K., Thornberry, pact of the representation of marine stratocumulus clouds on the T., Rollins, A., Krämer, M., Christensen, L., and Müller, R.: anthropogenic aerosol effect, Atmos. Chem. Phys., 14, 11997– Mechanism of ozone loss under enhanced water vapour con- 12022, https://doi.org/10.5194/acp-14-11997-2014, 2014. ditions in the mid-latitude lower stratosphere in summer, At- Paliwal, U., Sharma, M., and Burkhart, J. F.: Monthly and spa- mos. Chem. Phys., 19, 5805–5833, https://doi.org/10.5194/acp- tially resolved black carbon emission inventory of India: un- 19-5805-2019, 2019. certainty analysis, Atmos. Chem. Phys., 16, 12457–12476, Romatschke, U. and Houze, R. A.: Characteristics of precipitating https://doi.org/10.5194/acp-16-12457-2016, 2016. convective systems in the South Asian monsoon, J. Hydromete- Papaspiropoulos, G., Martinsson, B. G., Zahn, A., Brenninkmei- orol., 12, 3–26, https://doi.org/10.1175/2010JHM1289.1, 2011. jer, C. A. M., Hermann, M., Heintzenberg, J., Fischer, H., and Satheesh, S. K. and Ramanathan, V.: Large differences in tropical Van Velthoven, P. F. J.: Aerosol elemental concentrations in the aerosol forcing at the top of the atmosphere and Earth’s surface, tropopause region from intercontinental flights with the Civil Nature, 405, 60–63, https://doi.org/10.1038/35011039, 2000. Aircraft for Regular Investigation of the Atmosphere Based Satheesh, S. K., Ramanathan, V., Holben, B. N., Krishna Moor- on an Instrument Container (CARIBIC) platform, J. Geophys. thy, K., Loeb, N. G., Mating, H., Prospero, J. M., and Res.-Atmos., 107, 4671, https://doi.org/10.1029/2002JD002344, Savoie, D.: Chemical, microphysical, and radiative effects 2002. of Indian Ocean aerosols, J. Geophys. Res., 107, 4725, Pathak, H. S., Satheesh, S. K., Moorthy, K. K., and Nanjun- https://doi.org/10.1029/2002JD002463, 2002. diah, R. S.: Assessment of regional aerosol radiative effects un- Shindell, D. T.: Climate and ozone response to increased strato- der the SWAAMI campaign – Part 2: Clear-sky direct short- spheric water vapor, Geophys. Res. Lett., 28, 1551–1554, wave radiative forcing using multi-year assimilated data over https://doi.org/10.1029/1999GL011197, 2001. the Indian subcontinent, Atmos. Chem. Phys., 20, 14237–14252, Shindell, D. T., Chin, M., Dentener, F., Doherty, R. M., Faluvegi, https://doi.org/10.5194/acp-20-14237-2020, 2020. G., Fiore, A. M., Hess, P., Koch, D. M., MacKenzie, I. A., Penner, J. E., Chuang, C. C., and Grant, K.: Climate forcing by Sanderson, M. G., Schultz, M. G., Schulz, M., Stevenson, D. carbonaceous and sulfate aerosols, Clim. Dynam., 14, 839–851, S., Teich, H., Textor, C., Wild, O., Bergmann, D. J., Bey, I., https://doi.org/10.1007/s003820050259, 1998. Bian, H., Cuvelier, C., Duncan, B. N., Folberth, G., Horowitz, Ploeger, F., Konopka, P., Walker, K., and Riese, M.: Quantifying L. W., Jonson, J., Kaminski, J. W., Marmer, E., Park, R., Pringle, pollution transport from the Asian monsoon anticyclone into K. J., Schroeder, S., Szopa, S., Takemura, T., Zeng, G., Keat- the lower stratosphere, Atmos. Chem. Phys., 17, 7055–7066, ing, T. J., and Zuber, A.: A multi-model assessment of pollu- https://doi.org/10.5194/acp-17-7055-2017, 2017. tion transport to the Arctic, Atmos. Chem. Phys., 8, 5353–5372, Rajeev, K. and Ramanathan, V.: Direct observations of clear- https://doi.org/10.5194/acp-8-5353-2008, 2008. sky aerosol radiative forcing from space during the Indian Stier, P., Feichter, J., Kinne, S., Kloster, S., Vignati, E., Wilson, J., Ocean Experiment, J. Geophys. Res.-Atmos., 106, 17221– Ganzeveld, L., Tegen, I., Werner, M., Balkanski, Y., Schulz, M., 17235, https://doi.org/10.1029/2000JD900723, 2001. Boucher, O., Minikin, A., and Petzold, A.: The aerosol-climate Ramachandran, S., Rupakheti, M., and Lawrence, M. G.: Aerosol- model ECHAM5-HAM, Atmos. Chem. Phys., 5, 1125–1156, induced atmospheric heating rate decreases over South and East https://doi.org/10.5194/acp-5-1125-2005, 2005. Atmos. Chem. Phys., 22, 7179–7191, 2022 https://doi.org/10.5194/acp-22-7179-2022
S. Fadnavis et al.: Tropospheric warming by South Asian aerosols                                                                 7191

Solomon, S., Rosenlof, K. H., Portmann, R. W., Daniel, J.            Waugh, D. W. and Polvani, L. M.: Intrusions into the tropi-
  S., Davis, S. M., Sanford, T. J., and Plattner, G. K.: Con-          cal upper troposphere, Geophys. Res. Lett., 27, 3857–3860,
  tributions of stratospheric water vapor to decadal changes           https://doi.org/10.1029/2000GL012250, 2000.
  in the rate of global warming, Science, 327, 1219–1223,            Yan, X., Konopka, P., Hauck, M., Podglajen, A., and Ploeger,
  https://doi.org/10.1126/science.1182488, 2010.                       F.: Asymmetry and pathways of inter-hemispheric transport
Taylor, K. E., Williamson, D. L., and Zwiers, F. W.: The Sea Sur-      in the upper troposphere and lower stratosphere, Atmos.
  face Temperature and Sea-Ice Concentration Boundary Condi-           Chem. Phys., 21, 6627–6645, https://doi.org/10.5194/acp-21-
  tions for AMIP II Simulations, Program for Climate Model Diag-       6627-2021, 2021.
  nosis and Intercomparison (PCMDI), Lawrence Livermore Natl.        Yue, J., Russell, J., Gan, Q., Wang, T., Rong, P., Garcia, R., and
  Lab. Livermore, Calif. Rep., 60, 1–28, 2000.                         Mlynczak, M.: Increasing Water Vapor in the Stratosphere and
Tegen, I., Harrison, S. P., Kohfeld, K. E., Prentice, I. C.,           Mesosphere After 2002, Geophys. Res. Lett., 46, 13452–13460,
  Coe, M., and Heimann, M.: Impact of vegetation and                   https://doi.org/10.1029/2019GL084973, 2019.
  preferential source areas on global dust aerosol: Results          Zhang, K., O’Donnell, D., Kazil, J., Stier, P., Kinne, S.,
  from a model study, J. Geophys. Res.-Atmos., 107, 14–27,             Lohmann, U., Ferrachat, S., Croft, B., Quaas, J., Wan, H.,
  https://doi.org/10.1029/2001JD000963, 2002.                          Rast, S., and Feichter, J.: The global aerosol-climate model
Tegen, I., Neubauer, D., Ferrachat, S., Siegenthaler-Le Drian, C.,     ECHAM-HAM, version 2: sensitivity to improvements in pro-
  Bey, I., Schutgens, N., Stier, P., Watson-Parris, D., Stanelle,      cess representations, Atmos. Chem. Phys., 12, 8911–8949,
  T., Schmidt, H., Rast, S., Kokkola, H., Schultz, M., Schroeder,      https://doi.org/10.5194/acp-12-8911-2012, 2012.
  S., Daskalakis, N., Barthel, S., Heinold, B., and Lohmann, U.:     Zheng, C., Wu, Y., Ting, M., Orbe, C., Wang, X., and Tilmes, S.:
  The global aerosol–climate model ECHAM6.3–HAM2.3 – Part              Summertime transport pathways from different northern hemi-
  1: Aerosol evaluation, Geosci. Model Dev., 12, 1643–1677,            sphere regions into the Arctic, J. Geophys. Res.-Atmos., 126,
  https://doi.org/10.5194/gmd-12-1643-2019, 2019.                      e2020JD033811, https://doi.org/10.1029/2020JD033811, 2021.

https://doi.org/10.5194/acp-22-7179-2022                                             Atmos. Chem. Phys., 22, 7179–7191, 2022
You can also read