CFA Institute Research Challenge Local Challenge CFA Society Singapore National University of Singapore
←
→
Page content transcription
If your browser does not render page correctly, please read the page content below
CFA Institute Research Challenge
              hosted by
Local Challenge CFA Society Singapore
   National University of Singapore
Courts Asia
                                                                                                                     Singapore
                                                                                                               23 December 2013

Sell-Off Overdone; Long-Term Story Intact
Strong Singapore Housing Market Supports Growth                                   Rating:                            BUY
The Singapore Housing Development Board (HDB) public housing completions          Price Target:               $0.76 (USD0.60)
have a 87% correlation with Courts’ Singapore topline growth. The average
HDB building cycle is 3-4 years implying that the 77,000 HDB units launched in    Price, 23 Dec 13:          $0.595 (USD0.47)
the past three years will result in a medium-term surge in demand for Courts’     Upside:                             +28%
goods upon completion. Long-run Singapore sales growth will also be fueled by
the government’s plan to build 110,000 new homes after 2016.
Excessive Market Worries over Malaysia                                            Retail Discretionary, Consumer Elec & Applc
Courts’ 2QFY14 9.5% YoY fall in Malaysia revenues can be attributed to the        Bloomberg Ticker                  COURTS:SP
management’s deliberate tightening of credit and the recent fuel subsidy cuts.
The deliberate tightening of credit is meant to improve the overall credit
portfolio and to keep delinquency rates in check. This is prudent given rising    Key Statistic
delinquency rates and the impending post-tapering environment. Based on           52-Week High (SGD)                    $1.18
strong fundamentals, we are also confident of a subsequent rebound in             52-Week Low (SGD)                     $0.59
consumer confidence following the Sep 2013 fuel subsidy cut. This bodes well
for Courts’ near-term sales. The Malaysian residential units completion, which    Shares Outstanding (m)                560.0
is highly correlated with Courts’ Malaysia topline growth, is also set to grow    Market Cap (SGD m)                  $333.20
rapidly within the next three years.                                              Avg Daily Volume (m)                  1.626
Indonesia Expansion: Potentially More Upside than Downside                        Free Float:                            28%
Courts’ prior failed foray into Indonesia stemmed from credit collection          Book Value/Share (SGD):               $0.52
problems. However, we believe that ‘second time’s the charm’ for Courts, given    Gearing:                               35%
its improved credit risk management standards, in addition to the improving       ROE:                                 10.2%
credit environment of Indonesia. Furthermore, Courts is now targeting the
more credit-worthy middle-class of Bekasi and Serpong, as opposed to their
previous target market of the lower income segment in Bali and Lombok.
                                                                                  Share Price Movement
In the event of a failure of Courts’ Indonesia expansion plans, we estimate a
mere 3 cents downside in the bear case (as opposed to +7.5 cents in the base
case). Such losses are largely mitigated by Courts’ asset-light operating model
and the management team’s track record of swiftly exiting unprofitable
ventures.
Opportunity to Purchase Low-Price Emerging Market Exposure
Indonesian and Malaysian retailers generally trade at a higher P/E (28.8x and
12.2x respectively) than developed market peers due to a higher growth
premium. The sell-off represents an opportunity to buy into a stock with
increasing exposure to emerging markets for a mere P/E of 8.7x. Not only does
this grant investors cheap EM exposure, it also allows for ownership of a stock
with good corporate governance listed in Singapore, as opposed to purchasing
less-transparent Indonesian or Malaysian retail pure-plays.
The current 1.12x P/B ratio of Courts also implies a value trade when
compared to its peers’ average of 2.87x. The management’s active share
buybacks in Dec 2013, between the price range of $0.615 and $0.675,
underpins our confidence in the current entry price.
                                                                                  Top 5 Shareholders (%)
 Key Financials              2013A      2014F      2015F    2016F        2017F
 Revenue (SGD m)               794           824    894      978         1090      Asia Retail Group                     68.6
 EBIT (SGD m)                  69            71     67        71          77       Terry O’Connor (CEO)                   3.2
 Net Profit (SGD m)            41            35     28        29          29
                                                                                   J.P. Morgan Chase & Co.                1.6
 EPS (SGD)                   $0.074     $0.063     $0.051   $0.051       $0.052
 ROA                          6.3%       4.5%      3.1%      2.9%        2.7%
                                                                                   Barings International Inv Ltd          1.5
 ROE                         14.3%      11.0%      8.2%      7.7%        7.2%      Fil Ltd                                1.4
 BV/Share (SGD)              $0.475     $0.531     $0.568   $0.614       $0.666
Source: Omaha Capital Estimates, Bloomberg
                                                                     1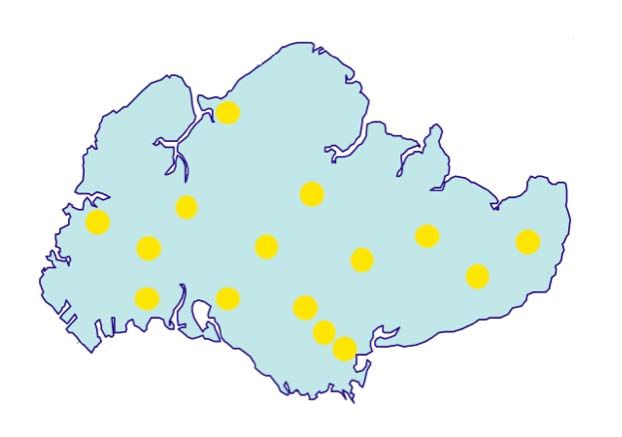
Business Description
                                     Courts Asia is a leading retailer of electrical products, IT products and furniture in Singapore
                                     and Malaysia, with intentions to begin operations in Indonesia as of FY2014. Courts currently
                                     operates 15 stores in Singapore and 62 stores in Malaysia (Appendix 7). As of now, according
                                     to 2012 figures from Euromonitor, Courts has the largest market share in Singapore (26%) and
                                     the third largest market share in Malaysia (21%). There are generally two sources of revenues
                                     – (i) Sales of Goods (ii) Earned Service Charges.
                                     #1 Source of Revenues – Sales of Goods (4 Major Categories)
                                     Courts Asia sells four major types of products – Electrical Products, IT Products, Furniture and
                                     Services (Warranty Sales, Product Replacement Services). Furniture has the highest gross
                                     margin (~36%) amongst the three product lines because, with the exception of IKEA and
                                     Harvey Norman (Appendix 8), Courts has almost no competitors of the same scale. The smaller
 Source: Company Data                furniture shops are unable to compete as effectively as Courts as furniture retailing is a space-
                                     intensive business. This grants Courts considerable pricing power.
                                     Electrical product offers the second highest gross margins (~17%) followed closely by IT
                                     products (~7%). The gross margin for IT products tends to be lower than that of electrical
                                     products, as it tends to fall in periods of high export sales (i.e. geographical arbitrage of selling
                                     goods like smartphones to foreign distributors from countries where these goods are not yet
                                     available). Such “exports” are done in bulk and usually a command a lower gross margin than if
                                     sold locally.
                                     #2 Source of Revenues – Earned Service Charges
                                     One of Courts key differentiating factor is its in-house financing options to customers who opt
                                     to purchase items with an installment scheme (Courts Flexi Schemes). This allows for
                                     customers to pay for their purchases over a period of up to 60 months, and is particularly
 Source: Company Data                attractive to customers, who are unable to make substantial cash payment upfront, or those
                                     who are unable to obtain credit from other third-party providers.
                                     The underlying motivation of this consumer finance business is to profit off the interest
                                     spreads on in-house loans, as compared to giving up the spreads to external financing
                                     companies (e.g. credit card companies). Courts finances such operations by securitizing and
                                     selling the receivables to financial institutions like that of HSBC, OCBC (Appendix 9). It borrows
                                     at ~5.5% and 6.5% respectively for Singapore and Malaysia and charges a 22% and 26%
                                     interest rate for Singapore and Malaysia (i.e. >16% interest spreads overall). This interest
                                     spread is recorded as ‘earned service charges’ on their income statement.
                                     Historical Operation of Courts in Singapore and Malaysia
                                     Courts has been operating in Singapore and Malaysia for 40 years and 27 years respectively.
                                     Courts Singapore Limited (CSL) and Courts Mammoth Berhad (CMB) listed separately in 1992
                                     and 2000 on the SGX and Bursa Malaysia. In 2004, Courts PLC, the holding company of both
                                     CSL and CMB, went into administration and Asia Retail Group subsequently acquired and
Source: Company Data
                                     privatized both CSL and CMB. In Oct 2012, Courts Asia, which comprises of both Singapore and
                                     Malaysia operations relisted on the SGX.
        Ownership Structure
                                     Potential Change in Existing Ownership Structure
    Asia Retail Group      68.6%
                                     We estimated that Asia Retail Group (ARG) would divest in CY2016 based on management
      Management              3.3%   guidance, with a chance of providing upside to the stock should strategic buyers choose to
         Public            15.1%     purchase ARG’s stake at a premium price. This is plausible given Court’s unique offering of
                                     consumer finance, a line of business that many other traditional IT/electrical and furniture
  Institutional Investor   13.0%     retailers do not possess.
 Source: Bloomberg
                                     Industry Overview and Competitive Positioning
                                     Macro Analysis
                                     Singapore - The 2013 Population White Paper announced a projected population of up to 6.9
                                     million by 2030 (from the current 5.3 million) and the growth of Singapore’s population
                                     suggests good potential for Courts’ core market. This creates long-term demand for housing

                                                                 2
that will increasingly come from public Housing Development Board (HDB) flats, which are
                                      more space-efficient in a land-scarce Singapore. Housing growth creates demand for home
                                      furnishing and appliances. Singapore’s strong pipeline of 13 new shopping malls through 2017
                                      (Appendix 10), allows Courts to achieve its objective of opening one new store a year to
                                      capitalize on the Singapore housing and population boom.
                                      Malaysia - Malaysia’s low unemployment rate and rising disposable income are two macro
                                      trends that bode well in driving sales for furniture, electronic goods and IT goods. Malaysia’s
                                      disposable income per capita is expected to grow by 6% from 2013 to 2017.
                                      Indonesia - There is a growing number of well-off modern adults and youths, who have higher
                                      incomes, buy international brands, and are willing to take loans for big-ticket purchases. This
                                      is due to the growth in the middle-class in Indonesia, spurred by high GDP growth (GDP grew
                                      6.4% in 2012). The Boston Consulting Group forecasts Indonesia’s middle-class and affluent
                                      consumer segment to almost double from 74 million in 2013 to 141 million in 2020. This
                                      upward mobility could raise consumer spending by 7.7% a year, and lead to growth in
                                      purchases of household equipment categories and electronic equipment.

                                      Industry Analysis
Source: Economist Intelligence Unit   Online Retail Competitors May Not Take-Off in Near-term
                                      With low barriers to entry, the online retail scene features competitors such as FortyTwo.sg
                                      and Furnituremart.sg. Currently, Courts has online presence in Singapore and Malaysia
                                      through its established website. However, a proprietary survey conducted (Appendix 11) has
                                      shown that 86% of Singaporeans in the age group 25 to 40, though technologically-savvy, are
                                      not willing to purchase big-ticket items online. They prefer to shop for items such as furniture
                                      and electrical appliances by browsing through physical stores and speaking to service staff.
                                      This is part of the shopping experience that Singaporeans enjoy and cannot be obtained
                                      through online alternatives (Appendix 12). This is a similar case for Malaysians as well, as a
                                      Nielson and PayPal analysis show that furniture makes up an insignificant amount (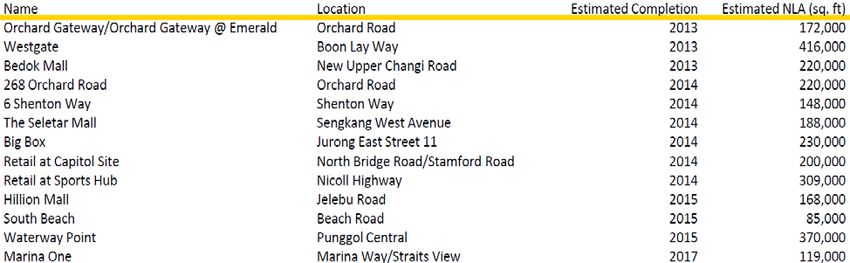
grow with no dominant player monopolizing the market.

                                  Competitive Analysis
                                  In-House Finance Scheme Allows Courts to Tap on Larger Consumer Group
                                  Courts is a unique retail company that offers in-house finance to customers (Appendix 15).
                                  Aligned to its objective of serving the emerging market of middle-class consumers, Courts’ in-
                                  house financing scheme unlocks a part of the consumer market that peers do not have access
                                  to – cash-strapped customers. Courts in-house financing schemes also promote ‘stickiness’
                                  amongst customers; 83.9% and 68.3% of Courts Flexi customers in Singapore and Malaysia
                                  respectively were repeat customers.
                                  Financing Scheme Not Easily Replicable
                                  Retail competitors may find it difficult to emulate Courts’ in-house credit scheme, as they lack
                                  Courts’ substantial experience in approving credit sales and collecting credit, evident from
                                  Courts’ long operating history. It would also take competitors substantial time and investment
                                  to develop a similar system to that of Courts’ Credit Management-Information-System (MIS) –
                                  a proprietary platform that allows for monitoring and forecasting of credit cycles, as well as
Source: Omaha Capital Estimates   the tracking of extensive historical repayment patterns. While credit facilities are also available
                                  from commercial consumer financing companies, consumers are unlikely to leverage on these
                                  facilities when purchasing at Courts as they lose out on the price promotions that Courts offer
                                  to customers purchasing on their Flexi Scheme.
                                  A One-Stop Home Products and Technology Provider
                                  By offering a blend of electronic products, IT products and furniture, Courts distinguishes itself
                                  from peers by being a one-stop home solution. There are currently few retail competitors of
                                  the same scale that offers a similar product mix in both Singapore and Malaysia – IKEA only
                                  retails furniture, whilst Best Denki operates in the IT and electronic goods space. Harvey
                                  Norman offers the same three broad categories of products as Courts but it targets the upper-
                                  middle to high income group and offers installment schemes tie-ups with the credit card
                                  companies. As such, it does not benefit from the same boost in margins from an in-house credit
                                  scheme. Although hypermarkets like Mustafa, Giant and Carrefour do offer a similar product
                                  range as Courts, they carry a substantially smaller variety of furniture, electronics and IT
                                  products. Small scale electrical and furniture retailers situated in housing estates in Singapore
                                  were also surveyed – these retailers do not have the same economies of scale and pricing
                                  power as Courts. This unique positioning amongst peers is one of the main reasons why Courts
                                  holds the largest and second largest market share by sales value in Singapore and Malaysia
                                  respectively.

Source: Euromonitor               One-Stop Provider Proposition Aligned With Consumer Trends
                                  With time-pressed consumers increasingly veering towards the concept of a one-stop shop,
                                  Courts pioneered new retail models like that of ‘Courts Connect’, an initiative that allows
                                  customers to sign up for TV, mobile and Internet services from telecommunications companies
                                  to complement customers’ purchase of audio and visual products. Courts has also benefited
                                  from the low rents offered at its flagship Tampines megastore in Singapore by the local
                                  government’s Warehouse Retail Scheme in growing its expertise of operating big-box
                                  megastores. These stores not only provide immense cost advantages in the form of economies
                                  of scale but also allow Courts to revolutionize customer shopping experience by offering food
                                  outlets, complimentary parking, children play areas to complement consumers’ demand for a
                                  wide range of IT, electrical and furniture products. Such big-box megastores are subsequently
                                  replicated in Malaysia and Indonesia.
                                  Best-in-Class Expenses a Result of Courts’ Supplier Network
                                  Courts’ operational scale allows it to secure lower cost of products from suppliers. Given their
                                  stature as a leading retailer, Courts also enjoys a business model where suppliers cover
                                  majority of its capital expenditure expense when it opens new stores. In addition, Courts is an
                                  attractive tenant for shopping malls and secures better rental rates due to its reputation.
                                  Courts also has a unique model in which it keeps no inventory of its furniture products as
                                  furniture brands bid for space to retail their products in Courts’ stores. Furniture products are
                                  shipped to customers directly from the furniture provider and Courts earns a cut of the profits
                                  earned from each sale. The salary of Courts’ sales person is also largely variable, with up to
                                  two-thirds of their income being derived from commissions on each sale made, incentivizing
                                  sales staff to be knowledgeable about the products they sell and lowers wage expenses for the
                                  company (Appendix 16).

Source: Euromonitor

                                                          4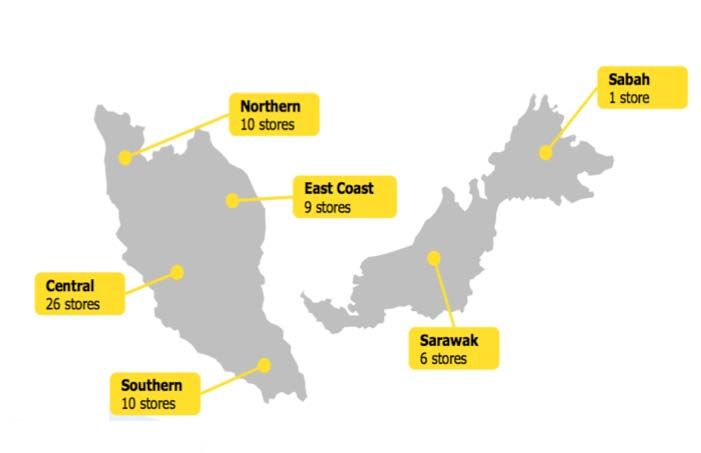
Investment Summary
                                                  Strong Singapore Housing Market Supports Growth
                                                  Through a correlation analysis, we found the topline growth of Courts’ Singapore to be highly
                                                  correlated to that of HDB flat completions (87% correlation) (Appendix 17). This is consistent
                                                  with the management’s guidance that one of their key product drivers is that of housing
                                                  completions. Jittery investors may have overreacted to Singapore’s National Development
                                                  Minister Khaw Boon Wan’s comments that HDB will reduce housing construction in 2014. This
                                                  is because the average HDB building cycle is 3-4 years, implying that the 77,000 Build-To-Order
                                                  flats launched in the past three years, which is inclusive of one of the largest ever Nov 2013
                                                  BTO launch in HDB’s history, has yet to result in a surge in demand for Courts’ goods from new
                                                  households, and is likely to kick-in within the medium-term horizon.
                                                  With regards to the long-term, the new Singapore’s Draft Master Plan 2013 reveals that almost
                                                  110,000 new HDB units will be built after 2016, to accommodate Singapore’s growing
                                                  population of up to 6.9 million by 2030.

                                                  Excessive Market Worries over Malaysia
   Note: Housing Completions forecasts based on
   new HDB flat applications
Source: Company Data, Department of Statistics

                                                  Courts’ recent share price decline is due to Malaysian 2QFY14 earnings upset which hinges on
                                                  two key reasons – (1) credit tightening (2) low consumer confidence after cuts in fuel subsidies.
                                                  Credit Tightening Ensures Long-Term Sustainable Growth
                                                  The management team started to tighten credit lending for their Malaysia operations in FY14.
                                                  This was a deliberate move to improve the overall credit portfolio and to keep delinquency
                                                  rates in check. We noted that Courts’ delinquency rates for 180+ days credit have increased
   Source: Company Data                           from 7.6% CY2H12 to 8.6% in the latest FY2013.
                                                  These figures underpin the management’s decision to improve the quality of its credit portfolio
                                                  rather than to drive growth with an inferior credit book. We believe the long-term benefits of a
                                                  lower delinquency rate will result in better long-term prospects for the firm, an issue that is
                                                  especially pertinent in a post-tapering environment when interest rates normalize upwards
                                                  and global credit tightens. This also reflects the management favouring sustainable long-term
                                                  growth over higher short-term profits.
                                                  Impending Rebound in Consumer Confidence
                                                  The initial impact of fuel subsidies lowers consumer sentiment, which translates into reduced
                                                  consumption of Courts’ goods. However, we noted that the impact of a fuel subsidy cut in
                                                  Malaysia is relatively short-lived, and tends to rebound within approximately a quarter. This is
                                                  evident from the Malaysia fuel subsidy cut in Jun 2008, where consumer sentiment dipped in
                                                  Jun to Aug and rebounded in Sep to Oct 2008.
                                                  Such a phenomenon is also mirrored by Indonesia’s fuel subsidy cut in Jul 2013, which led to a
                                                  fall in consumer sentiment in the same month, followed by an immediate rebound in consumer
                                                  sentiment September 2013 (Appendix 18). Bank Indonesia has attributed the rebound in
                                                  consumer sentiment following fuel subsidy cuts to the deferment of purchases amongst
                                                  consumers, leading to subsequent release of pent-up demand.

    Source: Bank Indonesia

                                                                            5
Long-Term Growth Driven by Malaysian Housing Market
                                               According to the Malaysian Prime Minister Najib Razak, “Among the public complaints on
                                               houses are high prices, insufficient supply”. To alleviate the lack of supply, the Malaysian
                                               government is likely to finish building a total of 700,000 houses in the next three years. Given
                                               that Malaysian housing completion and Courts Malaysia topline sales have a correlation of 89%,
                                               this spells strong demand for Courts’ merchandise in the long run (Appendix 19).

                                               Indonesia Expansion: Potentially More Upside than Downside
                                               Learning From Past Mistakes – Better Positioned for Indonesia Credit Environment
                                               Investor sentiment towards Courts Indonesian expansion plans has been weighed down by
                                               Courts previous exit, which was due to credit collection problems. This is evident from the 4.1%
                                               share price drop when the first big-box store in Indonesia was announced on 15 February
                                               2013. However, Courts is re-entering a stronger Indonesia with an improved credit model.
                                               Separation of credit and commercial teams and more stringent credit requirements has
                                               lowered Courts’ consolidated Impairment Loss (% of receivables) from 6.71% 2010 to 4.26% in
                                               2013. Furthermore, Courts is not going in blind, as it has gained knowledge on the Indonesian
                                               credit market from its past experience, and is currently working with Indonesian banks to
                                               develop a credit scorecard.
Note: Housing Completions forecasts based on
new HDB flat applications                      In addition, for their re-entry into Indonesia, Courts has a more focused strategy targeting the
Source: Company Data, Ministry of Finance      increasing affluent middle class segment in places like Bekasi and Serpong (BSD City), as
                                               opposed to their previous target market of the lower-income segment in Bali and Lombok,
                                               hence distancing itself from consumers with relatively poorer credit quality.
                                               The credit situation in Indonesia has also seen significant improvements in recent times. Non-
                                               Performing Loans (NPL) figures taken from Bank Indonesia shows that NPL ratios have been on
                                               a downward trend since Courts’ previous exit from Indonesia, falling from 8.25% in Oct 2006 to
                                               1.91% in Oct 2013.
                                               Strong Competitive and Costs Advantage
                                               According to an analysis of its competitors (Appendix 20), Courts competitive advantage in
                                               Indonesia stems from its ability to leverage on its in-house credit model and its ‘lowest price
  Source: Company Data                         guarantee’, in addition to its international brand to attract Indonesian consumers. These
                                               differentiating factors will give Courts an edge in market share as a new entrant, and drive
                                               topline growth in the long run.
                                               Courts’ cost of operations in Indonesia is kept low due to the good business environment in
                                               Indonesia. Based on management’s guidance, we estimate that Courts’ partnership with Sinar
                                               Mas Land provides competitive rental cost, which amounts to about a third of rental cost in
                                               Singapore and Malaysia. Furthermore, our analysis reveals that Indonesian wages are 78% that
                                               of Malaysia’s and 20% that of Singapore’s.
                                               Downside Minimal In the Event of an Indonesian Exit
                                               Courts’ CEO Terry O’Connor has a track record of not being shy to swiftly close down
                                               underperforming stores where necessary. For instance, he closed 22 stores and released 1,000
                                               employees when Courts Malaysia was integrated with Courts Singapore in 2008. This is integral
                                               when projecting for Courts’ expansion into Indonesia as we assume that Courts is willing to
                                               close stores if it turns out to be unprofitable.
                                               In the event of a failure of Courts’ Indonesia expansion plans, we estimate a mere 3 cents
                                               downside in the bear case (as opposed to +7.5 cents in the base case) (Appendix 21). Such
 Source: Bank Indonesia                        losses are largely mitigated by Courts’ capital expenditure light operating model and the
                                               management team’s track record of swiftly exiting unprofitable ventures

                                               Opportunity to Purchase Low-Price Emerging Market Exposure
                                               Indonesian and Malaysian retailers generally trade at a higher P/E ratio (28.8x and 12.2x
                                               respectively) than that of developed market peers, reflecting the premium that investors are
                                               willing to pay for higher growth rates (Appendix 22). The recent sell-off in Courts’ stock price
                                               represents an attractive opportunity to buy into a stock with increasing exposure to emerging
                                               markets, which currently trades at a mere P/E of 8.7x.
                                               This buying opportunity not only offers cheap exposure to high-growth markets, but also comes
                                               with the bonus of Courts being listed on the Singapore Stock Exchange, which has good
                                               corporate governance, as opposed to purchasing Indonesian or Malaysian retail pure-plays with
                                               less transparency. This is reinforced by Asian Corporate Governance Association’s Corporate
                                               Governance Watch 2012 rankings where Singapore was ranked #1 amongst 11 nations, whilst
 Source: Omaha Capital Estimates               Malaysia and Indonesia came in #4 and #11 respectively (Appendix 23).
                                                                        6
We are confident this is a reasonable entry price, given that the current P/B ratio of Courts is
                                    1.12x, whilst the average P/B amongst comparable peers lies around 2.87x (Appendix 24). On
                                    top of that, management has been actively buying back shares in the month of Dec 2013, within
                                    the price range of $0.615 and $0.675.

                                    Valuation
                                    To integrate our projections for Courts, we have employed a Discounted Cash Flow (DCF)
                                    model to produce a valuation for Courts. As a check on our DCF methodology, we have validated
                                    the target price with market multiples and conducted sensitivity analysis.
                                    The Enterprise Value (EV) of Courts is determined using the Free Cash Flow to Firm (FCFF)
                                    method and discounting the cash flows by Weighted Average Cost of Capital (WACC). This
                                    method is suitable as it will account for the cash flow to both debt holders and equity holders.
                                    Sum of Parts Valuation: Sales Growth Driven by Underlying Macro Trends
                                    Given the nature of Courts’ product lines and their differing rates of expansion across
                                    geographies, we have built a sum of parts forecast model, modeling Courts’ current operations
                                    in Singapore and Malaysia and its new operations in Indonesia separately by product lines.
  Source: Omaha Capital Estimates   Current Operations in Singapore and Malaysia – value per share of $0.685

          Components of WACC
                                    Breaking down sales into the different product lines for Singapore and Malaysia, we forecasted
        (Singapore and Malaysia)    short-run (FY2014 - FY2019) growth rates using country specific macro drivers for each
  Risk Free Rate           2.55%
                                    product line. Macro drivers include economic growth, private consumption growth and
                                    population growth. These are allocated different weights to forecast future growth rates based
       Beta                1.026    past year sales data for each country’s product line. In the longer term, we have tapered Courts’
  Market Return            9.35%    growth rates towards our assumed long term growth rate (economic growth) due to the
                                    uncertainty attached with any long-term growth rates forecasted.
   Cost of Debt            6.46%
      WACC                 8.26%    Expenses such as Salaries & Wages and Rental Costs are projected separately for each country.
                                    We first split up the expenses for each country by proportioning the salary and rental costs
    Terminal g             3.19%    with the average salary rate and rental rate respectively in Singapore and Malaysia. These
                                    expenses are then tied to the total sales for each country to derive a ratio for use in projecting
        FCFF Components in SGD      future expenses.
        (Singapore and Malaysia)
  Cash Per Share            0.105
                                    The FCF terminal growth rate of 3.19% is estimated based on the asset breakdown by
                                    geography provided by Courts (59% Singapore, 41% Malaysia) and economic growth rate
10-Yr Projected CF          0.20    forecasts for each country (2.3% Singapore, 4.5% Malaysia) in FY2023.
  Terminal Value            0.38
                                    Sensitivity Analysis on Current Operations Valuation
      FCFF                 0.685
                                    To test the robustness of our valuation, we conducted a sensitivity analysis on our most critical
Source: Omaha Capital Estimates     assumptions, varying WACC and terminal growth rate by up to 10% each. The sensitivity
                                    analysis produces a range of DCF valuations between $0.52 and $0.94 (Appendix 25).
          Components of WACC
               (Indonesia)          Contribution from Indonesia to start in FY15 – value per share of $0.075
  Risk Free Rate           8.42%    The Indonesian DCF model is constructed over a 20-year horizon, and assumes that the
       Beta                 1.09    economy closely tracks that of Malaysia in terms of product mix and gross margins. We have
  Market Return           16.19%    also accounted for the slower sales growth in the initial years of opening a new store in
                                    Indonesia (at a rate of 50% of Malaysia’s sales per square feet (psf) in the 1st year, and 60%,
   Cost of Debt           13.53%    70%, 80%, 90% and 100% in the subsequent years) for the 2 new stores projected to open in
      WACC                 14.1%    FY2014. These percentages improve when Courts opens more new stores in Indonesia in the
                                    future, as awareness and Courts’ brand name improves. An opening date factor is introduced to
    Terminal g             2.00%
                                    account for the projected date of store openings (3Q and 4Q respectively for the 2 stores
                                    opening in FY2015).
        FCFF Components in SGD
              (Indonesia)           Revenue and expenses are projected on a per store basis for 20 years, based on management’s
  Cash Per Share           0.013    indicated store opening schedule. This method allows us to project specific individual store
                                    sizes, rental, sales per square foot and adoption popularity based on management guidance and
20-Yr Projected CF          0.04
                                    our research.
  Terminal Value           0.022
                                    Salaries are projected based on the number of employees (using historical employees psf in
      FCFF                 0.075    Malaysia) and the wage rate in the country. The wage rate is derived by discounting Courts’
                                    Malaysian salary rate by the ratio of Indonesia’s average wage rate (based on Courts’
Source: Omaha Capital Estimates
                                    employees job functions) to Malaysia’s average wage rate. The initial rental rate applied to
                                    Indonesia is the average of rental rates in Bekasi and Serpong, as estimated from Colliers.

                                                             7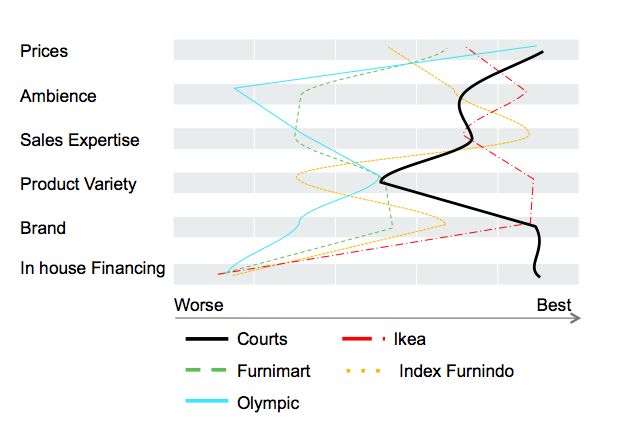
Due to the uncertainty involved with the long time horizon to FY2035, the terminal growth rate
                                                for Indonesia is conservatively projected at 2%. The methodology for calculating WACC is
                                                summarized in Appendix 26.
                                                Overhead Tied To Individual Country Characteristics
                                                Impairment loss on trade receivables is determined separately for each country based on the
                                                proportion of their credit sales. Malaysia and Indonesia are projected to have higher
                                                delinquency rates than Singapore. Expenses such as distribution and marketing expenses are
                                                tied to consolidated total sales. Other expenses consists of credit card fees, legal and royalty
                                                fees, and is pegged to about 3% of sales going forward due to increase in variable components
                                                such as credit card fees.
                                                Dividend Payout Attractive, Given Positive Net Income
                                                Courts does not have a fixed dividend policy but management has guided for FY2013 dividend
                                                payout ratio of 30% in the near term as it continues its expansion. As the Net Income projected
                                                forward remains strong, we maintain dividend payout ratio at 30% for the next 10 years. This
                                                dividend payout ratio will be attractive for investors.
                                                Peer Group Analysis
                                                To account for market expectations of the Courts’ share price, we have examined the peer
                                                group of Courts consisting of 12 other firms operating in retail segments similar to Courts,
                                                across the region. The multiples approach integrated four methods to arrive at a fair value price
                                                for Courts - EV/EBITDA and P/E multiples, in addition to a Ln(P/B) to ROE regression
Source: Company Data, Omaha Capital Estimates   (Appendix 27), which yielded a 83% R2. The peer group multiples price of $0.82 affirms our
                                                target price of $0.76 (Appendix 24).

                                                Financial Analysis
                                                Emerging Markets to Drive Sales Growth
                                                Courts’ revenues is forecasted to grow at a CAGR of 8.13% from FY2013 to FY2023. Earned
                                                Service Charges will continue to be an important element of revenue, more than doubling from
                                                $136m in 2013 to $388m in FY2023. Revenues are driven by Malaysia and Indonesia, with
                                                revenue share contributing a total of 42% to sales, in FY2023, up from 32% in FY2013. This
                                                helps to further diversify the geographical sources of revenues for Courts. Courts’
                                                management’s proposed aggressive expansion in Indonesia to establish 10 – 12 stores over the
                                                next 5 years will help boost sales from its Indonesian operations. Courts locates its stores
                                                strategically in rapidly developing areas such as Bekasi and its strategic partnership with Sinar
                                                Mas Land will ensure choice locations for its prospective stores. In the long term, the
                                                burgeoning middle class (141 million in FY2020) in Indonesia will drive consumption, leading
                                                to an increase in revenues from Indonesian operations. In FY2023, after 8 years of operations in
                                                Indonesia, Indonesian revenues will make up 14.5% of total revenues and rise further.
Source: Company Data, Omaha Capital Estimates   Management has also advised that it will open 5-6 stores a year in Malaysia to grow store
                                                numbers from 60 to 95.
                                                Increasing Profitability In The Long Term
                                                Courts’ profit margin is determined by its product mix as well as its cash-credit mix. Increased
                                                credit sales result in better overall margins. Our sum of parts model allows us to analyze the
                                                Indonesian expansion plans separately. Profit margin in the short term is dragged down due to
                                                expansion into Indonesia as we expect new store opening sales to be slower in Indonesia, as
                                                consumers are unfamiliar with Courts’ store concept, while the expenses are still being incurred
                                                in full. Additionally, higher distribution and marketing expenses will be incurred, as Courts
                                                would require more marketing and advertisements to attract and build customer base. Margins
                                                will improve as Courts establishes itself. Further expansion into Indonesia and Malaysia
                                                increases the proportion of credit sales, as such profit margins are projected to improve to 5.8%
                                                by FY2023. Furthermore, costs of operations are largely lower in Indonesia. The lower rental
                                                and manpower cost results in an Indonesian profit per sq. ft. to $49.3 sq. ft in 2023, which will
                                                boost overall profitability of Courts. (Group profit/sqft in 2013 is 32.27)
                                                Strong Coverage Ratios to allay Insolvency Concerns
                                                Interest Coverage Ratio decreased from 3.94 in 2013 to 2.10 in 2015. This decrease can be
                                                attributed to the increase in interest cost derived from the increase in debt taken to fund the
                                                Indonesian expansion and to provide working capital. Isolating Singapore and Malaysia
                                                operations, interest coverage ratio is higher overall, the lowest level being 2.34 in FY2015. As
Source: Company Data, Omaha Capital Estimates

                                                                         8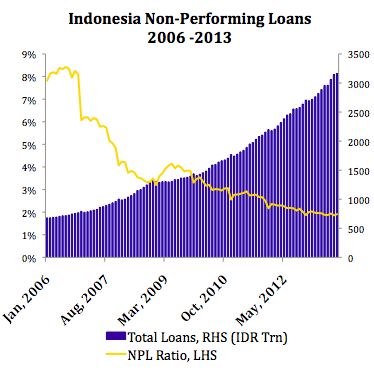
EBIT picks up in Indonesia, the ratio exhibits an upward trend from a low of 1.84 in FY2018 to
                                                in 2.67 in FY2023. The lower interest coverage ratio is expected due to the higher finance
                                                expenses that will be incurred from Indonesian operations. Although the ratio decreases
                                                initially, Courts’ ratio is always comfortably above 1.5, implying that Courts will not face
                                                liquidity issues even though it has a large amount of debt on its balance sheet.
                                                The Current ratio increased from 2.52 in 2013 to 2.81 in 2QFY14 and is projected to fluctuate
                                                slightly above the 3.0 level mark. The increase in current ratio in FY2014 is due to Courts
                                                boosting up cash accounts to finance expansion into Indonesia and to a smaller extent, its
                                                Malaysian expansion. A current ratio of above 3.0 ensures that Courts can meet its short-term
                                                obligations and has sufficient liquidity to pursue aggressive expansion plans.
                                                Realizing the Potential of Debt Financing – Consumer Financing / Retailer
                                                Courts’ debt ratio increases from 0.43 in FY2014 to a high of 0.49 in FY2019, before stabilizing
                                                back downward to 0.45 in FY2023. Courts is no ordinary retailer, its unique business model,
                                                where it provides in-house consumer financing results in it holding a substantial amount of debt
                                                on its balance sheets. As credit sales increase, the LT/ST accounts receivable increases as well,
                                                and this receivables are securitized as collateral to take on additional debt from banks. Hence,
                                                as credit sales increases, we can expect the amount of debt to increase accordingly as well. It is
                                                natural for debt to increase with sales, and increasing debt is positive for Courts as the cost of
Source: Company Data, Omaha Capital Estimates   debt to Courts is much lower than the implicit interest rates charged by Courts to its credit sales
                                                customers. Expansion into Indonesia and Malaysia, where credit sales traditionally is higher
                                                (management advised that Indonesia has similar cash to credit mix to Malaysia) will naturally
                                                push up Courts’ debt ratio. The stabilization of the ratio comes after 2020 as Courts’ business
                                                grows and its cash position builds up to provide a liquidity buffer. A large proportion of debt is
                                                due to financing its receivables; We estimate core debt to be minimal.
                                                DuPont Analysis
                                                Indonesian expansion causes a fall in ROE, from 14.3% in FY2013 to 8.13% in FY2015 due to a
                                                fall mainly in profit margins and to a lesser extent, Asset Turnover (TO). Asset TO is affected due
                                                to the increased working capital required to sustain Indonesian operations. In the longer term,
                                                ROE and profit margins improve as Indonesian operations pick up pace. From FY2016, ROE
                                                trends upwards, hitting 12.69% in 2023 and is projected to rise further into the future.
                                                Courts’ Impairment Charges to Improve: From $19m in 2013 to $16.5m in 2015
                                                Courts’ impairment/trade receivables (long term + short term) were 4.3% in 2013 and falls to
                                                3.36% in FY2015. This ratio is expected to increase slightly after FY2015 due to Courts’
                                                increasing exposure to Indonesia. Courts will require some time to build up its credit
                                                information base and become more familiar with the credit environment. There has to be a
                                                balance between tightening credit policy and credit sales; an overly tight credit policy may hurt
                                                Courts’ profitability overall. Thus, Courts will face higher impairment charges from Indonesia
                                                initially, 8% as compared to 3% for Singapore and Malaysia combined in FY2015. The
                                                impairment charge improvements in Indonesia, from 11% in 2015 to 7.5% in FY2023 brings
Source: Company Data, Omaha Capital Estimates   aggregate impairment/trade receivables ratio to 4.38. Removing Indonesia’s statistics,
                                                impairment/trade receivables for Singapore & Malaysia combined falls to 2.6% in FY2023,
                                                mainly due to the results of the credit tightening measures that Courts management has
                                                undertaken to keep delinquency rates from rising.
                                                Asset-Light Balance Sheet
                                                Courts has an asset-light balance sheet, where up to 58.2% and 11.3% of its total assets are in
                                                receivables and inventory respectively. On top of that, net PPE is only a mere 3% of total assets.
                                                Given that Courts leases its retail space, and can sublease certain areas to external retailers, it is
                                                able to achieve additional revenue and has flexibility in retail design. By remaining nimble,
                                                Courts also ensures better store portfolio performance, as its asset-light model allows it to
                                                swiftly close under-performing stores in pursuit of better opportunities.

                                                Corporate Governance
                                                Courts is led by an experienced management team that has spent years working together after
                                                moving up the ranks of Courts’ employment hierarchy. Courts’ CEO Terry O’Connor has been
                                                working in Courts since 1993 whilst the CFO Kee Kim Eng joined Courts in 1996. The
                                                management team has had the experience of leading Courts through the tumultuous years in
                                                Indonesia and Thailand prior to the administration of Courts PLC, and this will be huge asset as
                                                Courts expands in the region.
Source: Company Data, Omaha Capital Estimates
                                                Corporate Governance Index: We rated Courts’ corporate governance quality by applying the
                                                Principles of Corporate Governance developed by Organization for Economic Cooperation and

                                                                          9
Development (OECD) and arrived at a score of 6.58 compared to the industry average of 6.26
(Appendix 28). We believe this is justified given that Courts was recently awarded the esteemed
Most Transparent Company Award, New Issues Category by Securities Investors Association
(Singapore).
Social Responsibility: Courts is active in supporting causes that it is passionate about in its
Singapore and Malaysia markets. Aside from raising $130,000 for helping addicts in Singapore,
Courts is also active in supporting autistic children and the disabled sporting community. Its
dedication to giving back to the community is evident from how it launched an education
programme to help needy schools on the day it ‘broke the ground’ for its Indonesian expansion.
Courts also initiated its first Environmental Report in 2013 as it sought to do business in an
environment friendly manner. We believe this is a positive move in light of growing Malaysian
and Indonesian consumer consciousness of their environment when making purchasing
decisions.
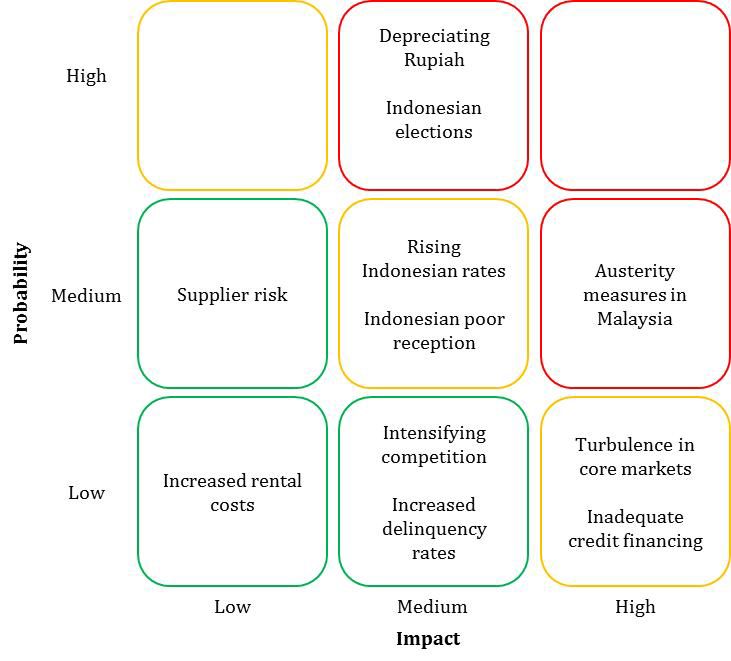
Investment Risks
We put forth the risks facing Courts on a matrix evaluating each of their severity and
probability, highlighting three key risks (refer to Business Risk Matrix for position). Risks facing
Courts include market, political, economic and operational risks. However, we believe the most
pertinent risks are the following political and market risks - the remaining risk factors located
on the Business Risk Matrix are elaborated in Appendix 29.
Source: Omaha Capital Estimates, Securities A: Political Risk: Indonesia General Elections 2014
Investors Association (Singapore)
Courts previously cited the 2013 Malaysian General Elections as the reason for poor 1Q2014
results. Looking ahead, one source of uncertainty is that of the 2014 Indonesia General Election
where a change in political regime might lead to increased regulation on a nationalistic bias.
Given that the upcoming elections is likely to be one of the most heavily contested, there is
uncertainty about the next President and the policies that will come along. While the near term
picture is cloudy, Courts, with its first Indonesian store to be opened only post-elections, will
benefit from a 20-30 basis point lift to the economy, based on surveys on past elections by Bank
Indonesia. Most of this boost will come from private consumption expenditure, in the form of
cash handouts.
C: Political Risk: Austerity Policies In Malaysia
Following Fitch’s downgrade of Malaysia’s credit outlook to negative in Jul 2013, Malaysian
Prime Minister Najib Razak has announced a series of austerity measures after going on a
spending spree to woo voters during the May election this year. These include an 11% hike in
subsidized fuel prices, and a likely implementation of a Goods and Services Tax (GST) in the
2015 fiscal plan. At the same time, the Malaysian central bank plans to impose restrictions such
as a shorter maximum tenure for mortgages, to curb household debt, which has risen by 12%
per annum in the past 5 years to reach 80.5% of GDP, the highest in Southeast Asia. The
combination of these measures is likely to put a dent on domestic consumption, as reflected in
100 = Quarter of Event, the downward forecasts of GDP growth from 5% to 4.3%. However, we believe that Courts will
Election at Time 0 be able to weather the austerity policies better than its competitors, given its ability to provide
Source: Bank Indonesia attractive promotions to price-conscious consumers as it can compensate for lost margins
through its credit scheme.
B: Market Risk: Depreciating Rupiah
Courts operates in 3 different geographies and is exposed to exchange rate risks, especially so
for the Rupiah. Tapering has caused the rupiah to hit a 4.5 year low, having weakened 14.9%
since the end of Jun 2013. A weak rupiah will ‘weaken’ Courts’ financial performance when it is
translated to its home currency – Singapore Dollar. However, the overall impact of a
depreciating Rupiah is not large. This is due to Courts’ business model providing a natural
hedge, where Courts’ cost of goods sold and expenses are incurred in Rupiah as well.
Furthermore, Bank Indonesia has increased interest rates by 1.5% to 7.5% in 2013 to rein in
Rupiah depreciation, and is committed to increase rates further should depreciation pressures
persist.
Team disclosure: We assign a BUY rating when a security is expected to deliver returns of 15% or greater
over the next twelve months. A SELL rating is given when the security is expected to deliver negative returns
Source: Omaha Capital Estimates over the next twelve months, while a HOLD rating implies flat returns over the next twelve months.
10Appendix 1: Consolidated Income Statement
Income Statement
14' Q3F
14' Q4F
14' Q1
14' Q2
2014F
2015F
2016F
2017F
2018F
2019F
2020F
2021F
2022F
2023F
2010
2011
2012
2013
SGD $000'000s
Revenue 580 674 724 794 197 223 206 206 832 894 978 1090 1204 1338 1461 1576 1682 1735
Revenue - Sale of Goods 473 571 605 657 164 188 171 167 690 746 816 909 998 1097 1181 1256 1322 1347
Cost of Goods Sold -399 -469 -492 -544 -137 -159 -140 -134 -570 -622 -680 -759 -835 -918 -990 -1055 -1112 -1136
Revenue - Service Charges 106 104 120 137 33 35 35 40 142 149 162 180 206 241 280 320 360 388
Gross Profit 181 205 232 250 60 63 66 72 261 272 297 330 370 420 471 521 570 599
Other Income (Net) 4 4 6 7 1 1 2 1 5 12 12 12 12 13 14 15 16 19
Distribution and Marketing Expenses -50 -60 -59 -62 -15 -16 -17 -16 -64 -71 -74 -82 -88 -96 -102 -107 -113 -114
Administrative Expenses -110 -108 -116 -126 -32 -34 -34 -33 -132 -147 -164 -184 -203 -225 -246 -266 -288 -296
Finance Expenses -7 -11 -14 -17 -5 -6 -9 -9 -28 -32 -39 -41 -49 -57 -66 -71 -74 -78
Profit Before Tax 18 30 48 51 9 9 8 16 43 35 33 36 42 56 71 91 112 130
Income Tax (Net) 3 -9 -10 -2 -2 -1 -3 -8 -7 -6 -7 -8 -12 -15 -20 -25 -29
Net Income from continuing ops 18 32 39 41 7 7 7 14 35 28 26 29 33 44 55 71 87 100
Loss from discontinued operations -3
Net Income 15 32 39 41 7 7 7 14 35 28 26 29 33 44 55 71 87 100Appendix 2: Consolidated Balance Sheet Balance Sheet SGD$000'000s 2010 2011 2012 2013 2014Q12014Q2 2014F 2015F 2016F 2017F 2018F 2019F 2020F 2021F 2022F 2023F Cash and cash equivalents 53 58 59 89 184 135 225 258 294 278 304 313 342 379 394 437 Trade and other receivables 161 170 191 200 197 202 191 220 246 280 322 382 432 481 526 572 Inventories 58 60 67 73 87 84 77 86 92 103 113 124 134 143 150 154 Current income tax recoverable 1 2 2 2 2 2 2 2 2 2 2 2 2 2 Non-current assets classified as held for sale 2 Current Assets 271 290 316 364 470 424 494 566 634 662 741 821 910 1004 1072 1164 Derivative financial instruments 1 1 Trade and other receivables 165 179 209 246 250 262 234 271 303 344 396 470 532 592 647 665 Net PPE 15 15 16 23 24 26 29 41 46 54 61 68 76 83 92 101 Gross PPE 56 61 67 70 73 80 99 112 128 144 160 179 198 219 243 Accumulated Depreciation -41 -44 -44 -46 -47 -51 -58 -65 -74 -82 -92 -103 -115 -127 -141 Prepaid land lease payments 1 Intangible assets 22 22 23 24 24 24 24 29 30 30 30 30 30 30 30 30 Deferred income tax assets 1 4 5 1 Non current assets 205 220 253 294 299 312 289 342 379 429 488 569 639 706 770 798 Total Assets 475 510 569 658 768 736 783 908 1013 1091 1229 1391 1549 1710 1842 1962 Trade and other payables 111 124 135 130 130 141 135 146 159 176 193 211 227 240 252 256 Current income tax liabilities 4 5 6 5 5 5 5 5 5 5 5 5 5 5 5 Borrowings 44 43 66 6 1 2 3 3 4 4 4 5 6 8 10 Deferred income 4 2 3 4 4 4 8 8 7 9 9 9 10 11 12 13 Current liabilities 159 173 209 144 139 151 149 162 174 194 210 230 247 262 278 284 Derivative financial instruments 1 1 1 1 1 1 1 1 1 1 Trade and other payables Borrowings 64 99 136 219 329 290 301 384 457 485 572 671 755 830 857 868 Deferred income 1 4 5 5 4 4 11 14 9 12 12 13 14 15 17 18 Deferred income tax liabilities 4 Non current liabilities 69 103 141 224 333 294 312 399 468 498 586 685 770 845 874 887 Total Liabilities 228 276 350 368 472 461 561 642 691 796 914 1017 1107 1152 1171 Share capital 221 221 221 265 265 265 265 265 265 265 265 265 265 265 265 265 Other reserves 24 -5 -8 -10 -11 -17 -14 -16 -19 -18 -18 -18 -18 -18 -18 -18 Retained profits 2 17 6 35 42 43 70 98 124 153 186 230 285 356 443 543 Total Equity 248 234 219 289 296 291 322 347 371 400 433 477 532 603 690 790 Total Equity and Liabilities 475 510 569 658 768 736 783 908 1013 1091 1229 1391 1549 1710 1842 1962
Appendix 3: Singapore and Malaysia Only Income Statement
Income Statement

                                                                                                         14' Q3F

                                                                                                                       14' Q4F
                                                                               14' Q1

                                                                                            14' Q2

                                                                                                                                     2014F

                                                                                                                                                  2015F

                                                                                                                                                               2016F

                                                                                                                                                                            2017F

                                                                                                                                                                                     2018F

                                                                                                                                                                                              2019F

                                                                                                                                                                                                       2020F

                                                                                                                                                                                                                2021F

                                                                                                                                                                                                                         2022F

                                                                                                                                                                                                                                  2023F
                                      2010

                                               2011

                                                          2012

                                                                      2013
SGD $000'000s

Revenue                                580      674        724         794      197          223          206           206            832          875          931        1009     1091     1173     1261     1342 1418 1484
 Revenue - Sale of Goods               473      571        605         657      164          188          171           167            690          727          775          844      913      982    1054     1119 1179 1230
   Cost of Goods Sold                 -399     -469       -492        -544     -137         -159         -140          -134           -570         -608         -649         -709     -769     -830     -893     -950 -1002 -1046
 Revenue - Service Charges             106      104        120         137       33           35           35            40            142          147          156          165      178      191      207      222   239   254
Gross Profit                           181      205        232         250       60           63           66            72            261          267          282          300      321      343      368      392   416   438
Other Income (Net)                       4        4          6           7        1            1            2             1              5           12           12           12       12       13       14       15    16    19

Distribution and Marketing Expenses     -50      -60        -59         -62       -15          -16          -17           -16          -64          -70          -71          -77      -82      -88      -92      -98     -102     -105
Administrative Expenses                -110     -108       -116        -126       -32          -34          -34           -33         -132         -138         -147         -157     -168     -177     -190     -202     -216     -225
Finance Expenses                          -7      -11        -14         -17        -5           -6           -9            -9          -28          -30          -32          -32      -33      -35      -36      -36      -35      -38

Profit Before Tax                        18       30         48          51             9            9             8        16           43           41           44           46       51       56       63       71       79       88

Income Tax (Net)                                      3          -9     -10         -2               7             7        14               -8           -8           -9      -10      -11      -12      -13      -15      -17      -19

Net Income from continuing ops           18       32         39          41             7            7             7        14           35           32           35           36       40       44       50       56       62       69
Loss from discontinued operations         -3

Net Income                               15       32         39          41             7                     10                 9       35           32           35           36       40       44       50       56       62       69
Appendix 4: Singapore and Malaysia Only Balance Sheet Balance Sheet SGD$000'000s 2010 2011 2012 2013 2014Q1 2014Q2 2014F 2015F 2016F 2017F 2018F 2019F 2020F 2021F 2022F 2023F Cash and cash equivalents 53 58 59 89 184 135 225 231 245 254 280 303 330 364 378 417 Trade and other receivables 161 170 191 200 197 202 191 213 227 244 260 277 293 309 323 365 Inventories 58 60 67 73 87 84 77 82 88 96 104 112 121 128 136 141 Current income tax recoverable 1 2 2 2 2 2 2 2 2 2 2 2 2 2 Non-current assets classified as held for sale 2 Current Assets 271 290 316 364 470 424 494 529 562 596 646 694 746 803 838 926 Derivative financial instruments 1 1 Trade and other receivables 165 179 209 246 250 262 234 262 279 300 320 340 360 380 398 411 Net PPE 15 15 16 23 24 26 29 34 37 39 43 46 49 52 55 59 Gross PPE 56 61 67 70 73 80 93 104 116 130 144 161 178 197 219 Accumulated Depreciation -41 -44 -44 -46 -47 -51 -59 -67 -76 -87 -98 -111 -126 -142 -160 Prepaid land lease payments 1 Intangible assets 22 22 23 24 24 24 24 25 25 25 26 26 26 26 26 26 Deferred income tax assets 1 4 5 1 Non current assets 205 220 253 294 299 312 289 322 342 365 389 413 436 458 479 497 Total Assets 475 510 569 658 768 736 783 851 904 961 1035 1106 1182 1261 1318 1423 Trade and other payables 111 124 135 130 130 141 135 143 151 164 177 190 204 216 226 235 Current income tax liabilities 4 5 6 5 5 5 5 5 5 5 5 5 5 5 5 Borrowings 44 43 66 6 1 2 3 3 3 3 3 3 3 3 3 Deferred income 4 2 3 4 4 4 8 7 6 7 8 8 9 10 11 12 Current liabilities 159 173 209 144 139 151 149 158 165 179 193 206 221 233 245 255 Derivative financial instruments 1 1 1 1 1 1 1 1 1 1 Trade and other payables Borrowings 64 99 136 219 329 290 301 369 385 390 408 421 432 442 423 447 Deferred income 1 4 5 5 4 4 11 10 8 10 11 12 13 14 15 17 Deferred income tax liabilities 4 Non current liabilities 69 103 141 224 333 294 312 380 394 400 419 433 445 456 439 465 Total Liabilities 228 276 350 368 472 461 538 559 579 612 640 666 689 684 720 Share capital 221 221 221 265 265 265 265 227 227 227 227 227 227 227 227 227 Other reserves 24 -5 -8 -10 -11 -17 -14 -16 -19 -18 -18 -18 -18 -18 -18 -18 Retained profits 2 17 6 35 42 43 70 102 137 173 213 257 307 363 425 494 Total Equity 248 234 219 289 296 291 322 313 345 382 422 466 516 572 634 703 Total Equity and Liabilities 475 510 569 658 768 736 783 851 904 961 1035 1106 1182 1261 1318 1423
Appendix 5: Indonesia Only Income Statement
Income Statement
2015F
2016F
2017F
2018F
2019F
2020F
2021F
2022F
2023F
2024F
2025F
2026F
2027F
2028F
2029F
2030F
2031F
2032F
2033F
2034F
2035F
S$'000,000
Revenue 20 47 80 114 165 200 235 265 251 296 308 316 329 335 340 345 348 351 354 357 359
Revenue - Sale of Goods 18 41 66 85 115 127 136 143 117 149 150 151 152 153 154 154 155 156 157 157 158
Cost of Goods Sold -14 -31 -50 -65 -88 -97 -105 -110 -90 -115 -115 -116 -117 -118 -118 -119 -120 -120 -121 -121 -122
Revenue - Service Charges 1 6 15 28 50 73 98 122 134 148 158 166 176 182 186 190 193 196 198 199 201
Gross Profit 5 16 30 49 77 103 130 155 161 182 192 200 211 217 222 226 229 231 233 235 237
Distribution and Marketing Expenses -1 -3 -5 -6 -8 -9 -10 -10 -8 -11 -11 -11 -11 -11 -11 -11 -11 -11 -11 -11 -11
Administrative Expenses -8 -17 -27 -35 -48 -56 -64 -72 -72 -82 -86 -89 -94 -97 -100 -103 -105 -108 -111 -114 -118
Finance Expenses -2 -7 -9 -16 -22 -30 -35 -39 -40 -45 -47 -49 -52 -53 -51 -49 -47 -46 -44 -41 -46
Profit before Tax -6 -11 -10 -9 -1 7 20 33 41 44 48 50 55 56 60 63 65 66 67 69 61
Income tax Expenses 1 3 3 2 -2 -5 -8 -10 -11 -12 -13 -14 -14 -15 -16 -16 -17 -17 -17 -15
Net Income -4 -8 -8 -7 -1 6 15 25 31 33 36 38 41 42 45 47 49 50 51 52 46Appendix 6: Indonesia Only Balance Sheet
Balance Sheet
2015F
2016F
2017F
2018F
2019F
2020F
2021F
2022F
2023F
2024F
2025F
2026F
2027F
2028F
2029F
2030F
2031F
2032F
2033F
2034F
2035F
S$'000,000
Cash and cash equivalents 26 49 23 24 10 12 15 16 19 29 53 85 118 142 137 147 150 156 163 164 195
Trade and other receivables 7 19 36 62 106 139 172 203 206 235 248 257 270 277 283 288 291 294 297 299 324
Inventories 4 4 7 9 12 13 14 15 12 15 16 16 16 16 16 16 16 16 16 16 16
Total current assets 37 72 66 95 128 164 201 233 238 280 317 358 404 435 436 450 457 466 476 479 536
Trade and other receivables 9 23 45 77 130 172 212 250 254 290 306 317 333 341 348 354 359 363 366 369 371
Net Property, plant and equipment 7 9 15 18 22 27 31 36 42 48 55 63 71 80 90 101 112 125 140 155 172
Gross PPE 6 8 12 14 16 18 20 22 24 26 28 30 32 34 36 38 40 42 44 46 48
Accum depreciation 1 1 3 4 6 9 11 14 18 22 27 33 39 46 54 63 72 83 96 109 124
Intangible assets 4 4 4 4 4 4 4 4 4 4 4 4 4 4 4 4 4 4 4 4 4
Total non-current assets 20 37 64 100 157 203 248 291 301 343 365 384 409 426 443 460 476 492 510 528 548
Total assets 57 109 130 195 285 367 449 524 538 623 682 742 813 861 878 910 933 959 986 1008 1084
Trade and other payables 3 7 12 15 21 23 25 26 21 27 27 27 28 28 28 28 28 28 28 29 29
Borrowings 1 1 1 1 1 2 3 6 7 9 10 11 12 13 10 15 16 16 12 11 13
Deferred income 1 1 2 1 1 1 1 1 1 1 1 1 1 1 1 1 1 1 1 1 1
Total current liabilities 5 9 15 17 23 26 29 33 29 37 38 39 41 42 39 44 45 45 41 41 43
Borrowings 15 73 95 165 250 324 387 434 421 465 487 507 535 540 515 495 469 444 425 396 424
Deferred income 4 1 2 1 1 1 1 1 1 1 1 1 1 1 1 1 1 1 1 1 1
Total non current liabilities 19 74 97 166 251 325 389 435 422 466 488 509 537 541 517 496 470 446 427 397 426
Total liabilities 24 83 112 184 274 351 418 468 452 503 526 548 578 584 556 540 515 491 468 438 468
Share capital 38 38 38 38 38 38 38 38 38 38 38 38 38 38 38 38 38 38 38 38 38
Retained profits -4 -13 -20 -27 -28 -22 -7 18 49 82 118 156 197 239 284 331 380 430 480 532 578
Total equity 34 25 18 11 10 16 31 56 87 120 156 194 235 277 322 369 418 468 518 570 616
Total liabilities and equity 57 109 130 195 285 367 449 524 538 623 682 742 813 861 878 910 933 959 986 1008 1084Appendix 7: Courts’ Store Formats
Courts has 4 store formats that are defined differently for their Singapore and Malaysia markets.
Megastore Superstore Departmental Store Small Format Store
View
Singapore Retail Area: Retail Area: Total Retail Area: Retail Area:
(as of Dec
Above 60,000sqft 12,000-60,000sqft 44,312sqft Up to 12,000sqft
2013)
Total Retail Area: Total Retail Area: Store Count: Total Retail Area:
136,200sqft ~225,000sqft 1 14,592sqft
Store Count: Store Count: Store Count:
1 10 3
Malaysia Retail Area: Retail Area: No Departmental Retail Area:
(as of Mar Stores
Above 30,000sqft 12,000-30,000sqft Up to 12,000sqft
2013)
Total Retail Area: Total Retail Area: Total Retail Area:
117,693sqft 484,824sqft 208,552sqft
Store Count: Store Count: Store Count:
3 27 27
Source: Company Data, Omaha Capital Estimates
The two maps below show the location of Courts’ stores in Singapore and Malaysia.
Source: Company DataAppendix 8: Major Furniture Competitors - Market Share in Singapore
Company: Value Share (%) Rank Category
Courts 31% 1st Furniture and Homewares
Courts 1.7% 5th Retailing
Harvey Norman 1.4% 9th Retailing
Harvey Norman 10.5% 2nd Electronics, Appliance Specialist Retailers
IKEA 16.9% 2nd Furniture and Homewares
Source: Euromonitor (2011 except IKEA’s 2012)
Appendix 9: Courts’ Credit Facilities
Source: Company Data
Appendix 10: Pipeline of New Malls in Singapore
Source: Omaha Capital EstimatesAppendix 11: Survey of Consumer willingness towards Purchasing Furniture and Electrical Appliances Online
We surveyed 66 people in Singapore of age group 25-45, with an equal number of male and females (i.e. 33 each), given that this age group has
the largest propensity to purchase online goods. We excluded responses of people who did not purchase Furniture or Electrical Appliances
before.
Source: Omaha Capital SurveyAppendix 12: Online Retailing Outlook for Courts
Courts is by far one of the few retailers who is on the online space in both Singapore and Malaysia, and has worked actively towards providing
customers this alternative form of shopping. We believe this enables Courts to leverage on the growing online retail trend. However, we do not
think that online retailers will hurt Courts in its strong core markets in Singapore due to the consumers’ style of shopping.
At the same time, online retailing in Malaysia is hampered by low penetration rates (62% in 2012, according to Euromonitor) and low confidence
of consumers in internet retailing due to the lack of trustworthiness of players in the online space.
Indonesia has an even lower internet penetration (22%) and their consumers are traditionally still conservative and prefer to visit physical
stores to see and try goods before making a purchase, while others are fearful of fraud from shopping online.
Company: Retail Sectors: Geography: Online Price Online Niche Market
Catalogue Store
Courts IT, Electrical, Singapore, Malaysia √ √ Middle Income, Credit
Furniture Sales
Furnituremart.sg Furniture Singapore √ √ Online only
Fortytwo.sg Electrical, Furniture Singapore √ √ Online only
Homestore.sg IT, Electrical, Singapore √ √ Online only
Furniture
vHive Furniture Singapore √ X Middle-High Income
Gain City IT, Electrical Singapore √ √ Air Conditioners
Mustafa IT, Electrical Singapore √ X Bargain, Indian
Consumers
Franc Franc Furniture Singapore √ X High End
Audiohouse IT, Electrical Singapore √ X Bargain
Novena Electrical, Furniture Singapore √ √ Middle Income:
Furnishing Recently partnered Best
Denki
Tangs Electrical Singapore, Malaysia √ √ High End
Lorenzo Furniture Singapore, Malaysia X X High End
Challenger IT Singapore, Malaysia X X Convenience
Best Denki IT, Electrical Singapore, Malaysia, √ √ Convenience
Indonesia
Harvey Norman IT, Electrical, Singapore, Malaysia √ X Middle-High Income
Furniture
IKEA Furniture Singapore, Malaysia √ X Low Prices
Senheng IT, Electrical Malaysia √ √ Electrical – Middle
income
HLK Chain-Store IT, Electrical Malaysia √ √ Low Prices
ESH Electrical Malaysia √ √ Electricals
Onking Electrical Malaysia √ √ Low Prices
Xam-max IT, Electrical Malaysia √ √ Online only
Khin Guan IT, Electrical Malaysia X X Low Prices
Lionmas IT, Electrical, Malaysia X X Low Prices
Furniture
Source: Omaha Capital SurveyYou can also read