Census 2021: Wirral Council Data Pack - Wirral Intelligence Service November 2020
←
→
Page content transcription
If your browser does not render page correctly, please read the page content below
Census 2021:
                                                Wirral Council
                                                Data Pack

                                                Wirral Intelligence Service

                                                November 2020

Wirral Intelligence Service: Census Data Pack                         November 2020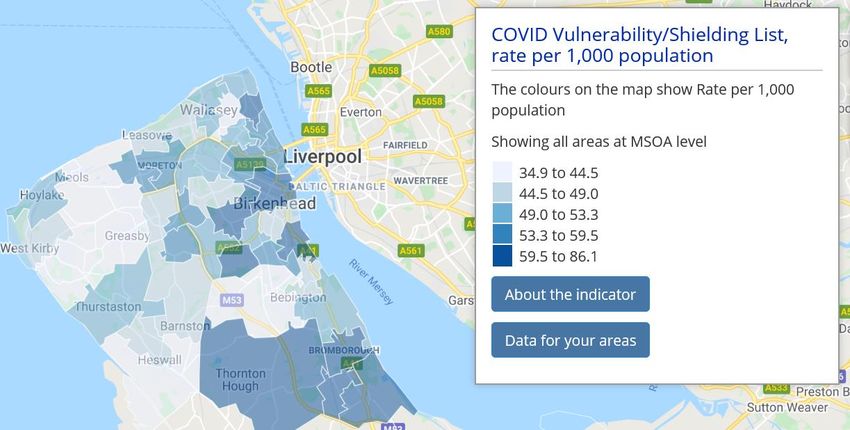
Census 2021: Wirral Council Data Pack

For further information please contact:

Wirral Intelligence Service at wirralintelligenceservice@wirral.gov.uk

Contents
Background .................................................................................................................................. 3
   1. Digital access and exclusion................................................................................................... 3
   2. Literacy ................................................................................................................................... 5
   3. Housing and transient populations ......................................................................................... 7
   4. BAME groups and asylum seekers ......................................................................................... 8
   5. NHS Shielded population........................................................................................................ 9
   6. People with limiting long term conditions or who need help with tasks of daily living ........... 10
   7. Method of filling in Census in 2011 ....................................................................................... 11
Contact details ........................................................................................................................... 11

Wirral Intelligence Service: Census Data Pack                               November 2020                                            Page 2 of 11
Background
This document aims to identify those factors which may prevent a satisfactory response rate to the 2021 Census
and highlight geographical areas and specific groups of people who may be most affected by the various factors.
The identified factors are detailed in the following sections.
1. Digital access and exclusion
In 2018, the University of Liverpool, in association with the Consumer Data Research Centre (CDRC), produced an
Internet User Classification (IUC) by Lower Super Output Area (LSOA). The IUC is a bespoke classification that
describes how people in different parts of Great Britain interact with the internet. There are 10 different
categorisations which are listed below, with the number in the brackets indicating how many LSOA’s in Wirral are
categorised as that classification:
• Digital Seniors (n = 24)
• Passive and Uncommitted Users (n = 48)
• Settled Offline Communities (n = 7)
• Youthful Urban Fringe (n = 0)
• E-Cultural Creators (n = 0)
• E-Mainstream (n = 37)
• E-Rational Utilitarians (n = 53)
• E-Veterans (n = 9)
• E-Withdrawn (n = 28)
• E-Professionals (n = 0)
Passive and Uncommitted Users and e-Withdrawn appear to be the two groups for whom internet access is least
likely; both have been detailed below, with maps showing where in Wirral these groups are most likely to live and
how many people are classified as belonging to these groups.
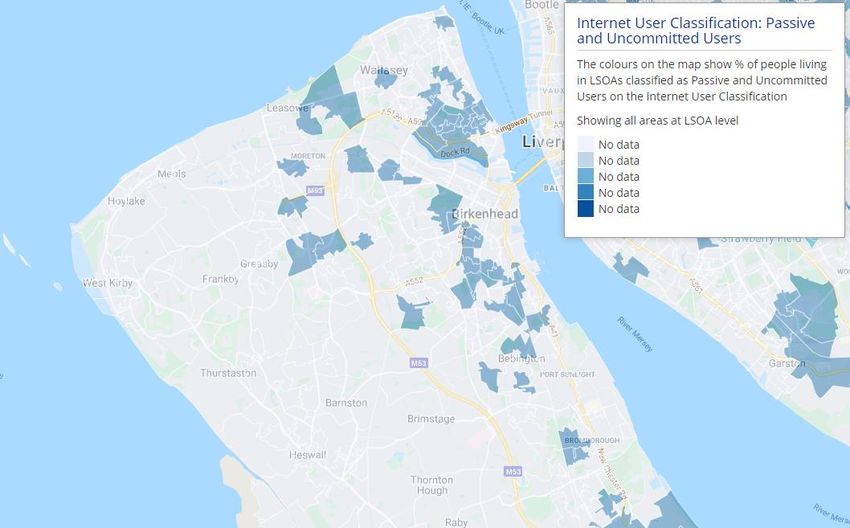
Passive and Uncommitted Users
The Passive and Uncommitted Users classification is the 2nd most prevalent in Wirral (behind E-Rational
Utilitarians). The definition of this classification is as follows:
“The Passive and Uncommitted Users group comprises individuals with limited or no interaction with the Internet.
They tend to reside outside city centres and close to the suburbs or semi-rural areas. Members of this Group have
few distinctive characteristics in conventional socioeconomic terms, albeit higher levels of employment in semi-
skilled and blue-collar occupations. Individuals are rarely online, and most commonly report use once a week or less.
Access to broadband is well below average, and for those online, there is mild preference for access via
smartphones. The Internet is typically used for social networks, gaming and some limited online shopping.”
There are an estimated 76,200 people in Wirral classified as Passive and Uncommitted Users (or 24% of the
Wirral population. The highest concentrations are in Wallasey Constituency (n=28,982 or 32% of the population of
the Constituency). On the other hand, 1 in 5 people in Wirral South Constituency and just 1 in 12 Wirral West
Constituency are classified as Passive and Uncommitted Users. See Map 1 below for an indication of where this
group live in Wirral.
Wirral Intelligence Service: Census Data Pack November 2020 Page 3 of 11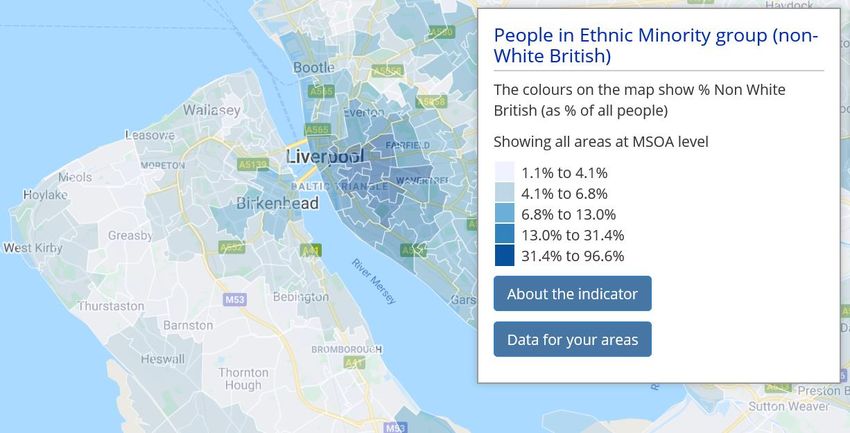
Map 1: LSOA’s in Wirral Classified as “Passive and Uncommitted Users”

Source: Local Insight

E-Withdrawn

The definition of the E-Withdrawn classification is shown as follows:

“The eWithdrawn Group is mainly characterised by individuals who are the least engaged with the Internet. Their
geography is expressed by areas that are associated with those more deprived neighbourhoods of urban regions.
The socio-economic profile of the population is characterised by less affluent white British individuals or areas of
high ethnic diversity; and it has the highest rate of unemployment and social housing among all other Groups. The
eWithdrawn Group appears to have the highest ratio of people that do not have access or have access but never
engage with the Internet. It also expresses the lowest rates of engagement in terms of information seeking and
financial services, as well as the lowest rate in terms of online access via a mobile device. Online shopping is also
particularly low, except for Clothing on Credit, suggesting an opportunistic dimension to Internet usage. This is
further reinforced by the higher than average access to Cable broadband by TV Provider, which may suggest that
some individuals have opted into broadband mainly for the TV-associated benefits. It is possible that many people
within this Group have opted out of online engagement, either because it is considered unnecessary or because of
economic reasons.”

A map showing the location of the LSOA’s classified as E-Withdrawn is shown below in Map 2. It shows that the
large majority of those classified as e-Withdrawn reside in the Birkenhead area, with very few in Wirral South and
Wirral West Constituencies. This reflects the Indices of Multiple Deprivation (IMD) – with a large majority of the
LSOA’s highlighted in Map 2 being within the top 20% most deprived LSOA’s nationally.

Nationally, only 8.8% of people are classified as e-Withdrawn, but this figure is 13.9% in Wirral (n=44,813 people).
This overall proportion hides a large variation, with Birkenhead Constituency having 28.4% (or 25,752) of its
population classified as e-Withdrawn, compared to just 2.3% of people in Wirral South (n=1,676).

Wirral Intelligence Service: Census Data Pack                November 2020                                 Page 4 of 11
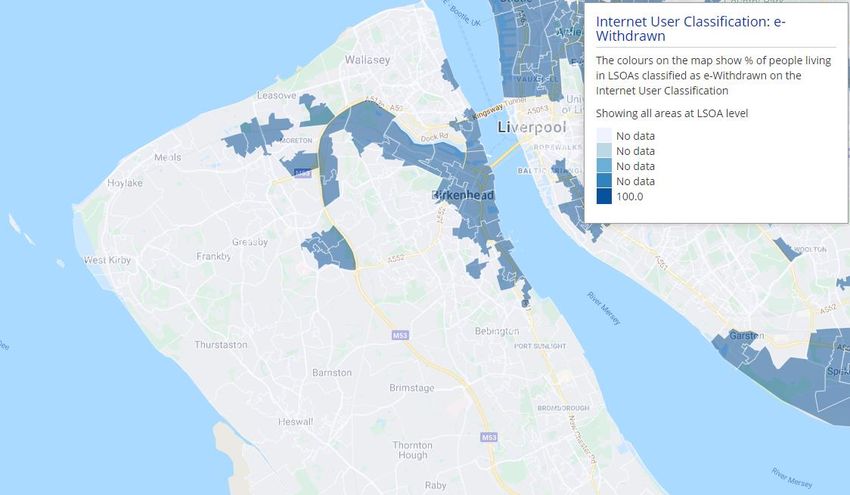
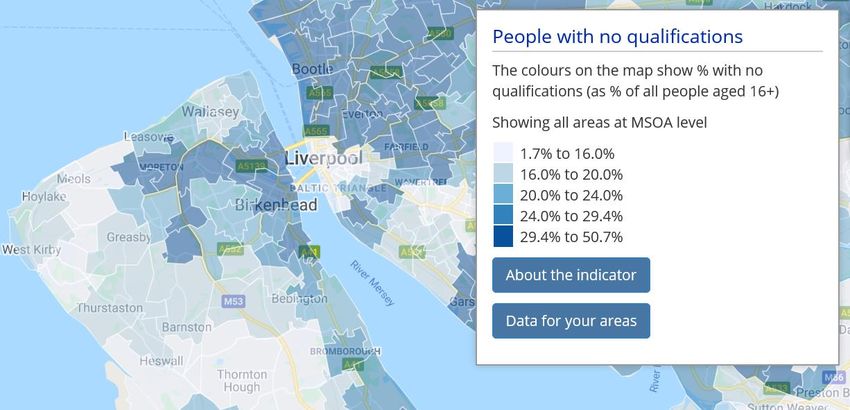
Map 2: LSOA’s in Wirral Classified as “E-Withdrawn”

Source: Local Insight

2. Literacy
No qualifications

Low literacy is challenging to quantify, so for the purposes of this document, one of the indicators used is people
with no qualifications have been used. This is not a perfect measure, as it may capture older people who were
more likely to leave school with no qualifications due to the social circumstances of the time (e.g. those who were
able to leave at age 15, before the raising of the school leaving age), rather than because of issues with literacy.

Map 3: Proportion of people with no qualifications in Wirral by MSOA

Source: Local Insight, 2020 https://wirral.communityinsight.org

Wirral Intelligence Service: Census Data Pack                     November 2020                           Page 5 of 11
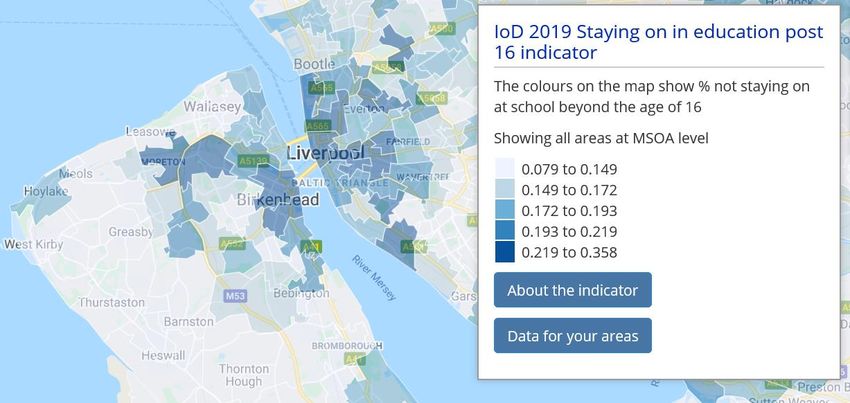
As Map 3 shows, the proportion of people with no qualifications is higher in the more deprived areas of Wirral.
Overall, Wirral has 23.4% of its population (or 61,014 people) with no qualifications, compared to 22.5% in England
overall. This is the lowest in the Liverpool City Region however, with Knowsley for example, having 34.7% of its
population with no qualifications. Within Wirral, as the map shows, the Constituency area with the highest
proportion of those with no qualifications is Birkenhead, which has 28.7% (n=19,736) of its population with no
qualifications, compared to Wirral South where the figure was much lower (19.5 of the Constituency or 11,636
people).

Staying on in education

As with no qualifications above, this is not a perfect measure to assess poor literacy, but it is a proxy measure we
can use in the absence of definitive data on literacy. See Map 4 and narrative below for more information.

Map 4: Proportion of people NOT staying on in education post-age 16 in Wirral by MSOA

Source: Local Insight, 2020 https://wirral.communityinsight.org

As Map 4 above shows (darker colours indicates a higher proportion of people NOT staying on in education past the
age of 16). This indicator is more prevalent in the eastern, more deprived areas of Wirral. Wirral compares
favourably to both England and the Liverpool City Region on this measure, with 16.5% of pupils not staying on
compared to 18.6% in the Liverpool City Region and 18.5% in England overall. The area of Wirral with the highest
proportion of pupils NOT staying on was Birkenhead Constituency (19.5%) compared to 14.7% in both Wirral West
and Wirral South Constituencies.

Wirral Intelligence Service: Census Data Pack                     November 2020                            Page 6 of 11
3. Housing and transient populations
High proportion of privately rented properties

The Census 2011 showed that around 1 in 7 houses (15.8%) of housing stock in Wirral is privately rented. Although
this data is now old, the longer-term trends which drive patterns affecting housing are not significantly altered in
Wirral. Privately rented properties have a high rate of ‘turnover’ or transience (e.g. compared to owner occupier or
socially rented properties for example). Some areas of Wirral however, have rates of privately rented properties
which are double this figure, see table below.

Table 1: Wirral Wards with highest percentage of privately rented properties in Wirral (2011)
                                                                           Private rented
 Wirral Ward                                          All households                             % private rented
                                                                             households
 E05000954 : Bebington                                           6,645                    640                   10
 E05000955 : Bidston and St James                                6,889                  1,169                   17
 E05000956 : Birkenhead and Tranmere                             7,747                  2,333                   30
 E05000957 : Bromborough                                         6,690                  1,164                   17
 E05000958 : Clatterbridge                                       5,924                    484                    8
 E05000959 : Claughton                                           6,285                  1,143                   18
 E05000960 : Eastham                                             5,955                    503                    8
 E05000961 : Greasby, Frankby and Irby                           5,978                    362                    6
 E05000962 : Heswall                                             5,808                    437                    8
 E05000963 : Hoylake and Meols                                   5,713                    872                   15
 E05000964 : Leasowe and Moreton East                            6,390                    691                   11
 E05000965 : Liscard                                             6,891                  1,767                   26
 E05000966 : Moreton West and Saughall Massie                    6,176                    650                   11
 E05000967 : New Brighton                                        6,784                  1,907                   28
 E05000968 : Oxton                                               6,592                  1,337                   20
 E05000969 : Pensby and Thingwall                                5,803                    404                    7
 E05000970 : Prenton                                             6,051                    779                   13
 E05000971 : Rock Ferry                                          6,465                  1,429                   22
 E05000972 : Seacombe                                            6,871                  2,003                   29
 E05000973 : Upton                                               7,127                    827                   12
 E05000974 : Wallasey                                            6,313                    831                   13
 E05000975 : West Kirby and Thurstaston                          5,486                    543                   10
 Total                                                         140,583                22,275                 15.8%
Source: Census, 2011

As the Table shows, the wards with the highest rates of privately rented property in Wirral tend to be those in the
most deprived areas (e.g. Wallasey and Birkenhead areas); in these areas, almost 1 in 3 households are living in
privately rented accommodation.

Hostels and other temporary accommodation

There are several hostels specialising in accommodation for homeless and otherwise vulnerable populations in
Wirral. They are predominantly located in the Birkenhead Constituency area and include The Ark, Rose Brae and
Forum Housing (two locations in Birkenhead, one in Wallasey). Discussion can be carried out with the

The Councils Gazeteer team have also carried out some analysis linked to caravan parks and residency to work to
ensure residents can be accounted for where possible.

Wirral Intelligence Service: Census Data Pack               November 2020                                Page 7 of 11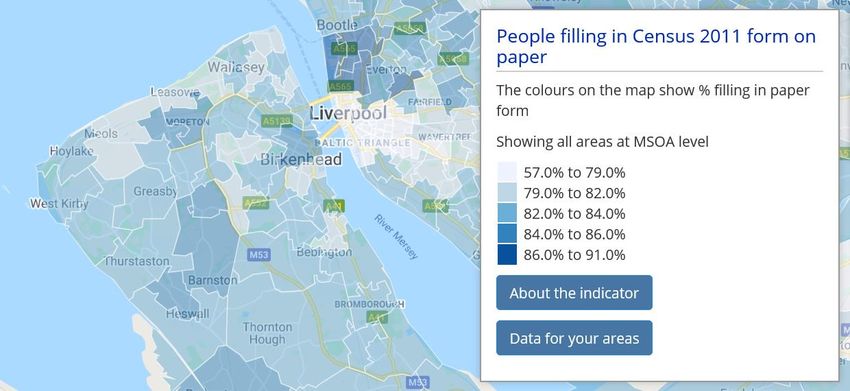
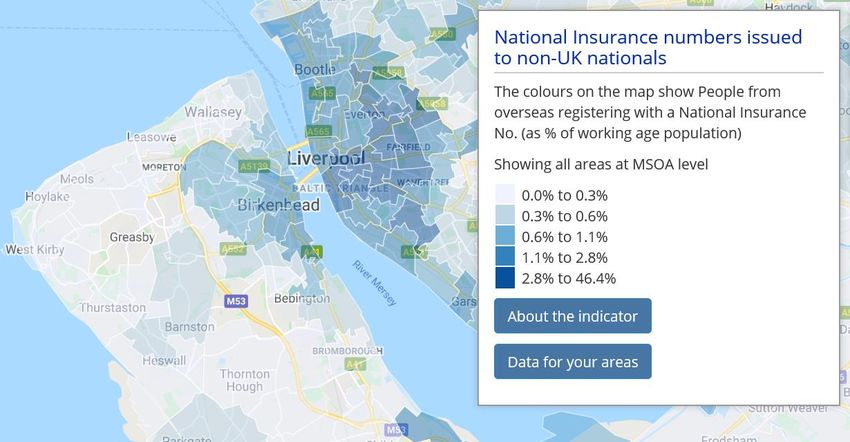
4. BAME groups and asylum seekers
At the last Census, Wirral had an estimated BAME population of approximately 16,000 people (or 5% of the
population compared to 20% in England overall). Obviously, this data is 10 years old now, but more up to date
estimates are unavailable until the new Census is published in 2022/23. The highest proportions were found in the
Birkenhead Constituency area (6.5% or around 5,700 people), the lowest in Wirral South (4% or 2,900 people). See
Map 5 below.

Map 5: Proportion of people of BAME origins in Wirral as of last Census (2011)

Source: Local Insight, 2020 https://wirral.communityinsight.org

In the absence of more recent data on BAME populations, the use of national insurance numbers issued to non-UK
nationals can be a useful indicator. See Map 6 and narrative below showing this indicator for Wirral.

Map 6: Proportion of National Insurance numbers issued to non-UK nationals (as a proportion of the working age
population) in 2019/20

Source: Local Insight, 2020 https://wirral.communityinsight.org

Wirral Intelligence Service: Census Data Pack                     November 2020                       Page 8 of 11
Wirral has the lowest proportion of NI numbers issued to non-UK nationals in the Liverpool City Region
(0.4% versus 1.1% in the Liverpool City Region and 1.9% in England overall).
In actual numbers, 800 NI numbers were issued to non-UK nationals in Wirral in 2019/20, the majority of
which (0.8% or n=474) were living in the Birkenhead Constituency area. The lowest number were issued
to people livinng in Wirral West (n=35 or 0.1%). This is likely to reflect the comparatively lower cost of
housing, but may provide an indication of where those whose first language is not English are likely to be
concentrated.
Asylum Seekers
As of the end of August 2020, there were 282 asylum seekers resident in Wirral. The table below shows numbers by
Constituency.
Table 2: Number of asylum seekers resident in Wirral as of August 2020
Constituency Number
Birkenhead 115
Wirral West 48
Wirral South 26
Wallasey 93
Total 282
As the table shows, the majority of asylum seekers in Wirral were resident in the Birkenhead and Wallasey
Constituency areas of Wirral as of August 2020.
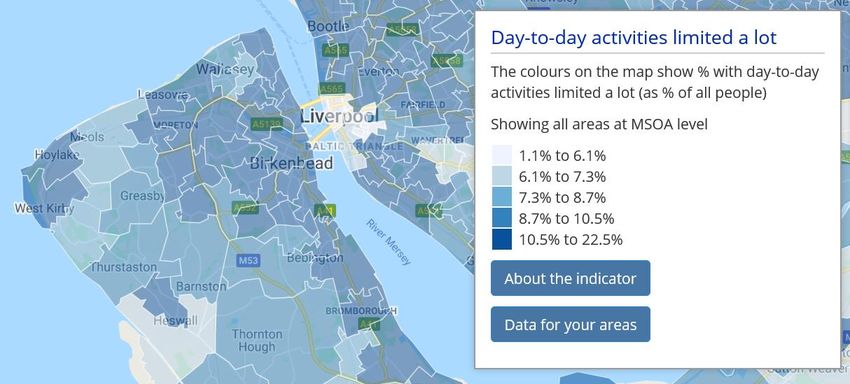
5. NHS Shielded population
Map 7: Shielded and vulnerable population in Wirral (rate per 1,000 population), as of end of June 2020
Source: Local Insight, 2020 https://wirral.communityinsight.org. The Wirral COVID Vulnerability List is a combination of people on: i) NHS
Shielding list ii) people added by their GP, Consultant etc.. iii) those who have self-identified as vulnerable
The map above shows the rate of people on the NHS Shielding List, identified by the GP/other health professionals
or by self-identification, as being vulnerable to the impacts of COVID-19, as a rate per 1,000 residents. Birkenhead
Wirral Intelligence Service: Census Data Pack November 2020 Page 9 of 11
Constituency has the highest rate (57 per 1,000), Wirral West the lowest (46 per 1,000). The ward with the highest
rate was Eastham (85 per 1,000), the lowest was Heswall (37 per 1,000). In actual numbers, there were around
18,000 people on this list at any one time (although this changes frequently, as people are added and others come
off following death notifications). There was a slightly higher proportion of females on this list compared to makes,
and the majority (57%) were aged over 65.

6. People with limiting long term conditions or who need help with tasks of daily living
People who identify that their day to day activities are limited a lot due to a limiting long term illness (including the
diseases of older age), may experience issues completing the Census without help, hence their inclusion in this data
pack.

Map 8: People who self-identified as having a limiting long term illness which limited their day-to-day activity a lot

Source: Local Insight, 2020 https://wirral.communityinsight.org

The map above shows the proportion of residents who self-identified as having a limiting long-term illness and said
that illness limited their day to day activities a lot. Figures are from responses to the 2011 Census, based on a self
assessment whether or not a person has a limiting long-term illness, health problem or disability which limits their
daily activities or the work they can do, including problems that are due to old age.

Overall, 11.9% of the Wirral population (or approximately 38,000 people) identified that their day to day activities
were limited a lot due to a limiting long term illness (although this did include the diseases of older age). This
compared to 8.3% in England overall, but was lower than the majority of authorities in the LCR region.

Within Wirral, Birkenhead Constituency had the highest number and rate of people who said that their day to day
activities were limited a lot due to a limiting long term illness (13.5% or 12,000 people), while Wirral South had the
lowest (10% or 7,200). As the map shows however, rates were fairly high across the borough and only Heswall had
rates that were lower than England overall at 7.3% (all other wards were higher than England).

Visual impairment

It is difficult to ascertain how many people are likely to have a visual impairment in Wirral, although it is strongly
related to age. The table below is sourced from POPPI (Promoting older People’s Independence Network) and gives
estimates on the number of people in Wirral aged 18-64 predicted to have a serious visual impairment, people
aged 65 and over predicted to have a moderate or severe visual impairment, and people aged 75 and over
predicted to have registrable eye conditions. Unfortunately, a breakdown within Wirral is not available.

Table 3: People aged 18-64 predicted to have a serious visual impairment, people aged 65+ predicted to have a
moderate or severe visual impairment, and people aged 75+ predicted to have registrable eye conditions

Wirral Intelligence Service: Census Data Pack                     November 2020                             Page 10 of 11
Age                                                        Number
 People aged 18-24 predicted to have a serious visual impairment                                                  13
 People aged 25-34 predicted to have a serious visual impairment                                                  24
 People aged 35-44 predicted to have a serious visual impairment                                                  24
 People aged 45-54 predicted to have a serious visual impairment                                                  28
 People aged 55-64 predicted to have a serious visual impairment                                                  29
 People aged 65-74 predicted to have a moderate or severe visual impairment                                    2,139
 People aged 75 and over predicted to have a moderate or severe visual impairment                              4,129
 People aged 75 and over predicted to have registrable eye conditions                                          2,131
 Total                                                                                                         8,517
Source: POPPI, 2020

7. Method of filling in Census in 2011
Map 9: People who filled in the Census in 2011 using a paper form

Source: Local Insight, 2020 https://wirral.communityinsight.org

The map shows that in the areas shaded darker, a higher proportion of people filled in the Census last time using a
paper form. Overall, Wirral had a (marginally) higher proportion of people who filled in the Census on paper
compared to England as a whole (81% in England vs 82% in Wirral).

Within Wirral, the pattern appeared not to be particularly related to deprivation as is the case with other indicators
highlighted here, with use of paper forms did not differ wildy between areas, with rates highest in Wirral West
(82.9%), versus 81.8% in Wallasey Constituency.

Conversely, rates of filling in the Census onlinne was highest in Wallasey and Claughton wards (both just over 19%),
and lowest in Pensby & Thingwall and Upton Wards (both just over 16%).

Contact details

For further details please contact: John Highton, JSNA Programme Lead at johnhighton@wirral.gov.uk

To subscribe to Wirral Intelligence Service Bulletin, please: complete this form

Feedback: Let us know your views or find out more about a particular topic or subject: send us an email

Wirral Intelligence Service: Census Data Pack                     November 2020                          Page 11 of 11
You can also read