CD73 Controls Ocular Adenosine Levels and Protects Retina from Light-Induced Phototoxicity
←
→
Page content transcription
If your browser does not render page correctly, please read the page content below
CD73 Controls Ocular Adenosine Levels and
Protects Retina from Light-Induced Phototoxicity
Karolina Losenkova
University of Turku: Turun Yliopisto
Akira Takeda
University of Turku: Turun Yliopisto
Symantas Ragauskas
Experimentica UAB
Simon Kaja
Loyola University Chicago
Marius L. Paul
University of Bonn Faculty of Medicine: Rheinische Friedrich-Wilhelms-Universitat Bonn Medizinische
Fakultat
Constanze C. Schmies
University of Bonn Faculty of Medicine: Rheinische Friedrich-Wilhelms-Universitat Bonn Medizinische
Fakultat
Georg Rolshoven
University of Bonn Faculty of Medicine: Rheinische Friedrich-Wilhelms-Universitat Bonn Medizinische
Fakultat
Christa E. Müller
University of Bonn Faculty of Medicine: Rheinische Friedrich-Wilhelms-Universitat Bonn Medizinische
Fakultat
Jouko Sandholm
University of Turku: Turun Yliopisto
Sirpa Jalkanen
University of Turku: Turun Yliopisto
Giedrius Kalesnykas
Experimentica
Gennady G Yegutkin ( genyeg@utu.fi )
BioCity Turku https://orcid.org/0000-0001-6684-7982
Research Article
Keywords: NTPDase1/CD39, ecto-5’-nucleotidase/CD73, Purine metabolism, Mouse and human retina
Page 1/38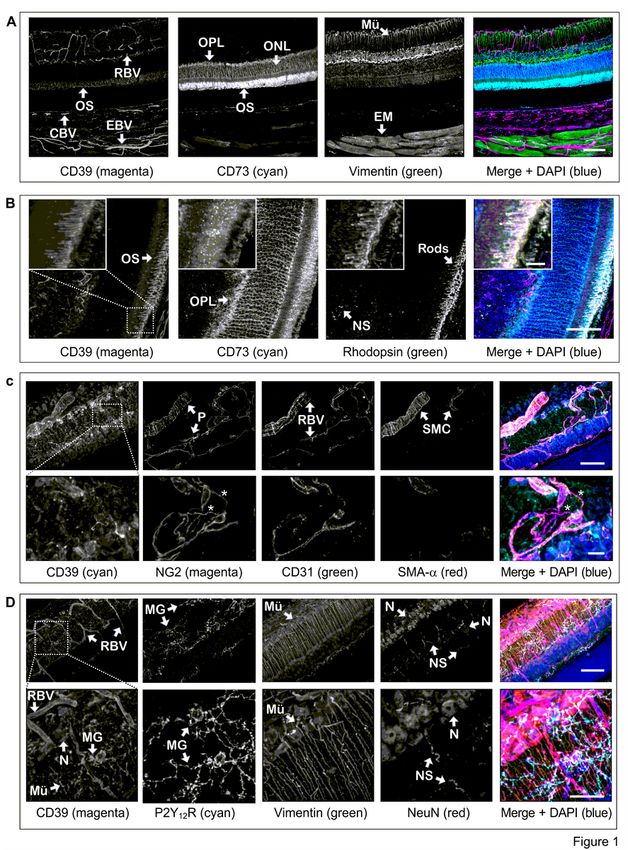
Posted Date: August 6th, 2021
DOI: https://doi.org/10.21203/rs.3.rs-743701/v1
License: This work is licensed under a Creative Commons Attribution 4.0 International License.
Read Full License
Page 2/38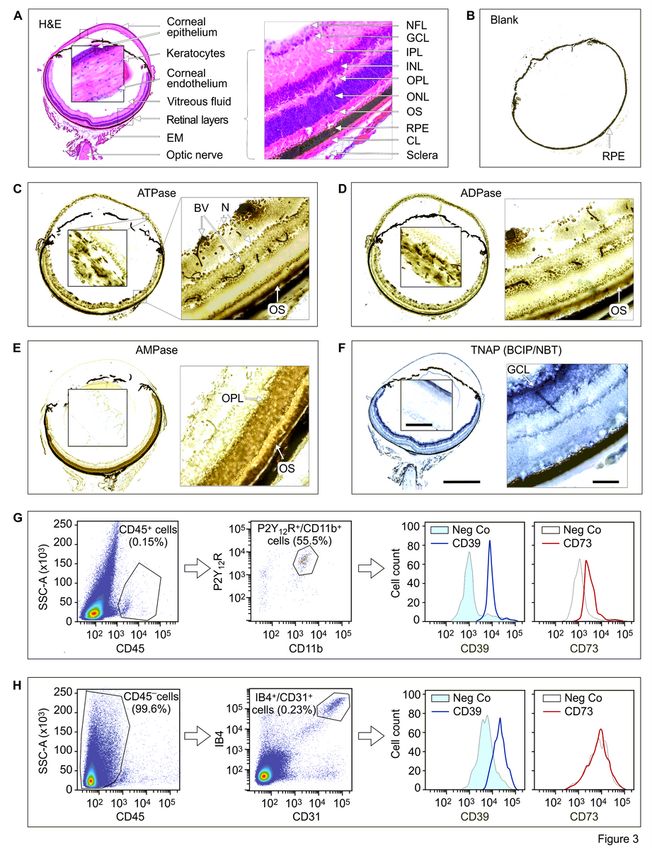
Abstract
Ocular ATP and adenosine have emerged as important signalling molecules involved in vascular
remodeling, retinal functioning and neurovascular coupling in the mammalian eye. However, little is
known about the regulatory mechanisms of purinergic signaling in the eye. Here, we used three-
dimensional multiplexed imaging in combination with in situ enzyme histochemistry, flow cytometric
analysis and single cell transcriptomics to characterize the pattern of purine metabolism in the mouse
and human eyes. This study identified NTPDase1/CD39 and ecto-5’-nucleotidase/CD73 as major ecto-
nucleotidases, which are selectively expressed in the optic nerve head, vascular endothelial and
perivascular cells, outer segments of photoreceptors, retinal microglia, and cornea and coordinately
control ATP and adenosine levels. The relevance of the CD73-adenosine axis was confirmed by flash
electroretinography showing that pharmacological inhibition of CD73 in dark-adapted mouse eyes
rendered the animals hypersensitive to prolonged bright light, manifested as decreased a-wave and b-
wave amplitudes and a loss of retinal ganglion cells. Our study thus defines ocular adenosine
metabolism as a complex and spatially integrated network and characterizes its critical role in protecting
the retina from light-induced phototoxicity.

Brief Summary
This study provides a holistic view of adenosine metabolism and signaling in the mammalian eye as a
complex and spatially integrated network, and further emphasizes the essential role of the CD73-
adenosine axis in protecting retina from bright light induced phototoxicity.
Introduction
Extracellular ATP and its metabolites ADP and adenosine (ADO) are important signaling molecules
involved in a wide range of (patho)physiological activities in virtually all organs and tissues [1], including
the eye [2–5]. ATP released from damaged neurons, blood vessels, activated microglia, and Müller glial
cells triggers diverse proinflammatory, neurodegenerative, and angiogenic processes which are mediated
by activation of metabotropic (P2Y) and ligand-gated (P2X) nucleotide receptors expressed in the retina
and other ocular structures [2, 3, 6]. Another mechanism of ATP action is conveyed via its ectoenzymatic
breakdown into ADO, which in turn binds to adenosine receptors (AR) that function by activating (A2AR
and A2BR) or inhibiting (A1R and A3R) adenylyl cyclase [1]. The A2AR and/or A1R are especially relevant in
terms of ocular physiology by playing a crucial role in pathological retinal angiogenesis [7, 8],
neuroinflammation [5, 9], modulation of the circadian clockwork [10], photoreceptor coupling [11], retinal,
choroid and optic nerve blood flow [12, 13], and also hyperpolarization of retinal ganglion cells (RGC) and
protection them from apoptosis [6, 14].

Along with significant progress in understanding the function of purinergic receptors, recent studies have
begun to uncover the complexity of mechanisms governing the duration and magnitude of purinergic
signaling in the eye. Previous research has been focused on the expression of key nucleotide-
inactivating/ADO-producing enzymes: ecto-nucleoside triphosphate diphosphohydrolase-1 (NTPDase1,

                                                   Page 3/38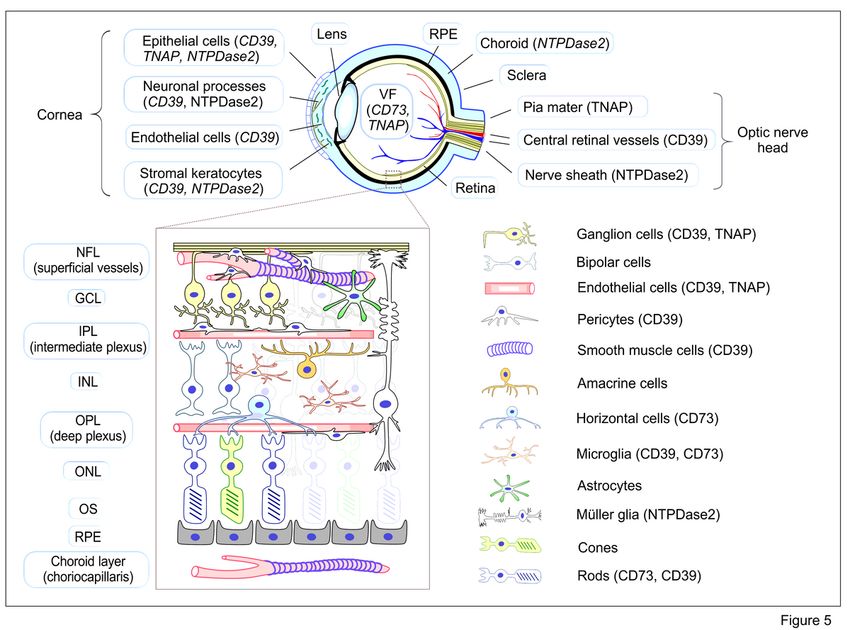
also known as CD39), NTPDase2 and ecto-5’-nucleotidase/CD73 in primate [15–17], rodent [3, 8, 17–19],
and zebrafish [19, 20] retinas in terms of their role in control of angiogenesis, diabetic retinopathy,
intraocular pressure, and neurovascular coupling. Soluble forms of CD73, adenosine deaminase (ADA),
adenylate kinase-1 and other enzymes were also identified in the human vitreous fluid, where they
coordinately regulate ocular ATP and ADO levels via two counteracting, purine-inactivating and ATP-
regenerating, pathways [16, 21]. Multiple human disorders have been linked to abnormalities in purine
metabolism, including cancer [22, 23], cardiovascular diseases [24], and ocular diseases [9, 16]. Several
potent small-molecule inhibitors and antibodies directed against CD39 and CD73 were developed recently
and tested in clinical trials as potential anti-cancer drugs [23, 25, 26]. However, one of the obstacles
preventing translation of purinergic enzymes to the clinic is the lack of consideration of redundant
pathways controlling ATP and ADO levels in a certain synergistic, counteracting or compensatory manner
[27, 28].

The complexity of the architecture and function of the mammalian eye also requires the development of
advanced tools to study the extracellular space in heterogeneous retinal environment. Conventional
histopathological analyses of protein expression performed using formalin-fixed paraffin embedded
tissue sections or cryo-embedded sections can offer high-resolution images, but the limited thickness of
slices hampers the acquisition of more information on the z-axis. Recent development of advanced
platforms such as clearing-enhanced three-dimensional (3D) and other volumetric imaging techniques
permits cell-level analysis of cell positioning in the context of macroscale tissue structure, which
ultimately extends analysis capacities beyond traditional histological and dissociation-based methods
[29, 30]. By using a high-resolution 3D multiplexed imaging, in situ enzyme histochemistry and flow-
cytometric analysis of mouse retina, in combination with single cell transcriptomic data of mouse and
human retinal cells, this study was undertaken to assess the whole pattern of purine metabolism in the
mammalian eye. Furthermore, although CD73 has been widely employed as a cell surface marker for the
enrichment of pluripotent stem cell-derived photoreceptor populations and the isolation of photoreceptors
from retinal organoids [31, 32], the role of this key ADO-producing ectoenzyme in controlling retinal
function is not fully explored yet. Therefore, we tested pharmacological intervention aimed at reducing
intraocular ADO levels by using a novel highly potent and metabolically stable CD73 inhibitor PSB-12489
[25], and demonstrated the essential role of CD73 in protecting the mouse retina from bright light (BL)
induced phototoxicity.

Results
CD73 is compartmentalized in photoreceptor layer of the mouse retina, while CD39 is highly expressed in
the eye vasculature, retinal microglia and cornea.

The first part of this study was designed to assess the tissue-specific distribution of nucleotide-
inactivating enzymes in the naïve mouse eye. The use of sections of whole eyeball dissected from
C57BL/6N mice and embedded in low melting point agarose (LMA) and their sequential incubation with
antibodies against CD73, CD39, and NTPDase2 in combination with a wide range of molecular markers
                                                Page 4/38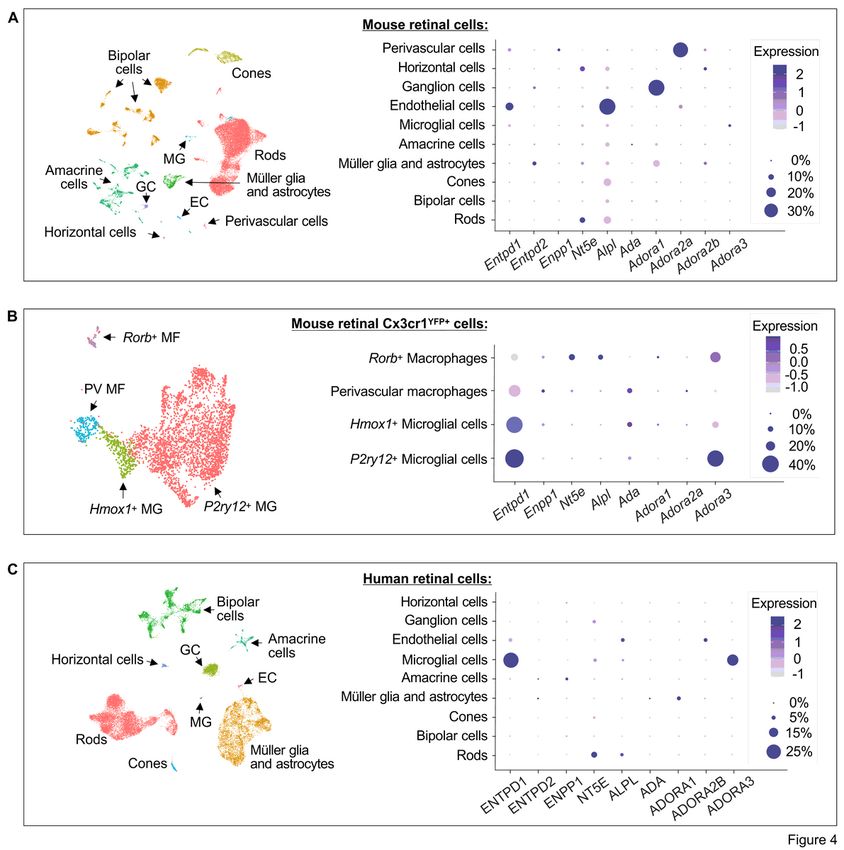
allowed us to characterize the phenotypic identity and spatial localization of key ecto-nucleotidases in a
relatively thick (~ 100 µm) tissue volume. Staining of the eye with rabbit anti-rat CD73 (Fig. 1A-B) and rat
anti-mouse CD73 (Supplementary Fig. 1A) antibodies recognizing different epitopes of CD73 revealed a
similar pattern of selective compartmentalization of CD73 in the photoreceptor layer. The highest CD73
immunoreactivity was associated with the outer segments (OS) of photoreceptor cells, where it is co-
localized with a light-sensitive receptor protein rhodopsin (a marker of rod cells) and blue-sensitive S-
opsin (cone marker) (Fig. 1B and Supplementary Fig. 1A). Unlike CD73, CD39 is more broadly distributed
in different ocular structures. High levels of CD39 were found in the retinal vasculature, including the
central retinal artery and vein, which enter the optic nerve head and further bifurcate into smaller
arterioles, venules and capillaries extensively branching throughout the inner (superficial) plexus and
deeper capillary plexus, as well as in the choroid layer (choriocapillaris) and extraocular blood vessels
(Fig. 1A and Supplementary Fig. 1B-C). Co-staining of the eyes with anti-CD39 antibody and different
vascular markers demonstrated the presence of CD39 on all components of the vessel wall, including
CD31+/IB4+ endothelial cells which share their basement membranes with adjacent NG2+/Phalloidin+
pericytes, and also contractile SMA-α+/Phalloidin+ smooth muscle cells (SMC) wrapped in a
circumferential pattern around larger arterioles (Fig. 1C and Supplementary Fig. 2A-C). Interestingly, the
close-up view of the images validated recent data on the presence of nanotube-like processes that
connect two bona fide pericytes on separate capillary systems and regulate neurovascular coupling in the
mouse retina [33], and further extend these observations by showing that these fine structures do not
express CD39 and as a consequence, are unable to metabolize ATP (Fig. 1C, inset). The latter observation
on unequal distribution of CD39 in retinal pericytes may be relevant in light of earlier findings showing the
ability of extracellular ATP to induce pericyte contraction and capillary lumen narrowing only in a certain
portion of retinal microvessels. [34]. Significant CD39 immunoreactivity was also detected in the
rhodopsin+ OS of photoreceptors (Fig. 1B), as well as Iba1+/P2Y12R+ microglial cells, which mainly reside
in two synaptic compartments of the neural parenchyma: the outer plexiform layer (OPL) and the inner
plexiform layer (IPL) (Fig. 1D and Supplementary Fig. 2A-B), and in the optic nerve head (Supplementary
Fig. 1C). CD39 is also expressed, albeit faintly compared to blood vessels, photoreceptors, and microglial
cells, on NeuN+ neuronal cell bodies located in the ganglion cell layer (GCL) (Fig. 1D), but not on
vimentin+ intermediate filaments of Müller glia (Fig. 1A,D and Supplementary Fig. 1C) and GFAP+ positive
astrocytes selectively compartmentalized in the innermost nerve fiber layer (NFL) (Supplementary
Fig. 2B). CD39 is also co-localized with another member of the family, NTPDase2, on tubulin-βIII+
neuronal processes lining the innermost margin of the retina and cornea, as well as corneal
IB4+/Phalloidin+ epithelial cells, and stromal keratocytes (Supplementary Fig. 2D).
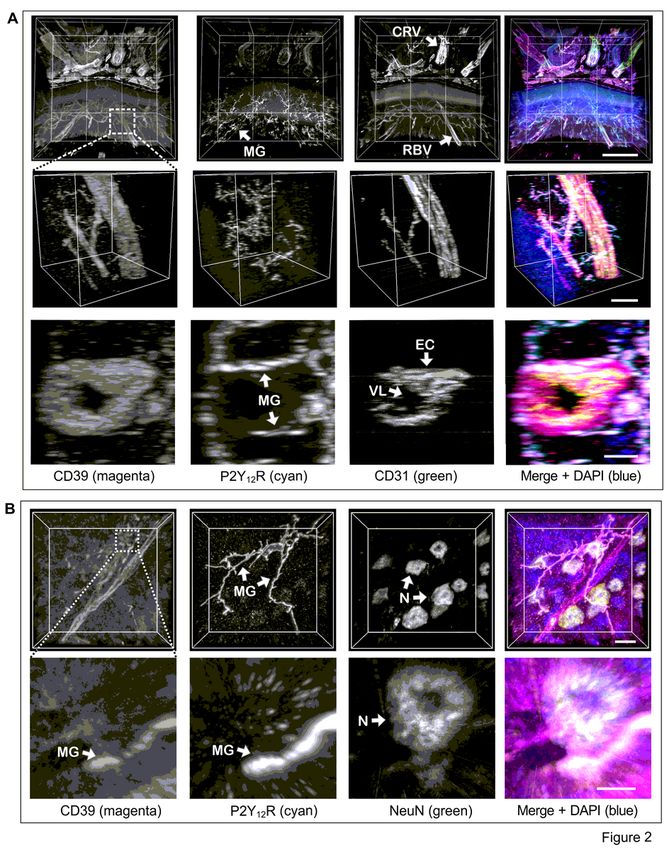
The advantage of our workflow is that it provides additional information on high-resolution 3D mapping
of cell positioning in the context of macroscale tissue. Given that the commonly used 2D
immunofluorescence images or maximum intensity projections of 3D images significantly underestimate
microglial cell motility [29, 35], such volumetric approach may be particularly relevant for evaluation of
stereoscopic morphology of retinal microglial processes and their heterotypic interactions with other
components of the neurovascular unit. The 3D reconstructed images enabled visualisation of extensively
Page 5/38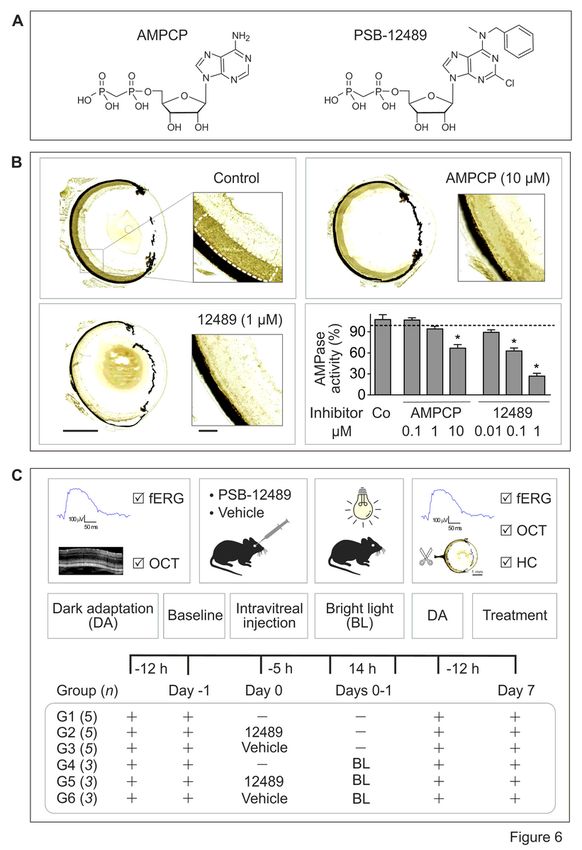
branched microglial cell processes that co-express two important components of the purinergic
machinery, P2Y12R and CD39, and form direct contacts with exterior walls of CD39+ retinal blood vessels
(Fig. 2A, Supplementary Fig. 3A, and Movie 1), as well as with neuronal cell bodies which either lack CD39
on their surface or merely express it at relatively low levels (Fig. 2B, Supplementary Fig. 3B, and Movies 2
and 3).

In situenzyme histochemistry and flow cytometric assays confirm cell type- and tissue-specific
localization of ecto-nucleotidases in the mouse retina

In a different set of experiments, the activities of ecto-nucleotidases were measured in the mouse eye
cryosections by using enzyme histochemistry assay [36]. Additional staining of the samples with
haematoxylin and eosin (H&E) (Fig. 3A) enabled the visualization of the main retinal layers and other
ocular structures. The presence of dark light-absorbing melanin granules in the exterior retinal pigmented
epithelium (RPE) partially interferes with lead nitrate-based enzyme histochemistry of the eye.
Nevertheless, there were clear-cut differences in staining intensities between the samples incubated
without (Fig. 3B) and with (Fig. 3C-E) exogenous nucleotides. High ATPase (Fig. 3C) and ADPase
(Fig. 3D) activities were detected in the retinal vessels, OS of photoreceptor cells and neuronal bodies,
while AMP-specific staining was mainly confined within the photoreceptor layer (Fig. 3E). High ATPase
and ADPase (but not AMPase) activities were also detected in the stromal keratocytes and basal
epithelial layer of the cornea (Fig. 3C-E). Notably, similar staining patterns were observed when eye
cryosections were incubated with nucleotide substrates in the presence (Fig. 3C-E) and absence (data not
shown) of the inhibitor of tissue-nonspecific alkaline phosphatase (TNAP) tetramisole. On the other hand,
the use of the artificial chromogenic substrates of TNAP, BCIP and NBT, revealed the development of
specific dark blue staining in the inner and outer plexiform layers of retina, as well as in the superficial
corneal epithelial cell layer (Fig. 3F), which disappeared after pretreating the samples with tetramisole
(data not shown). These data suggest that despite the selective expression of TNAP in certain eye
structures, this broad substrate-specificity ectoenzyme is not implicated in the metabolism of ocular of
ATP and other nucleotides. Collectively, in situ enzyme histochemistry, together with the multiplex
imaging data described above (see Figs. 1 and 2), identified CD39 as the predominant ATP- and ADP-
inactivating enzyme in the mouse eye which is expressed to varying degrees among vascular, immune,
neural and stromal cells. The downstream step of hydrolysis of ATP/ADP-derived AMP into ADO is
mediated through ecto-5’-nucleotidase/CD73 activity which is mainly localized in the photoreceptor layer.
Flow cytometric analysis of isolated mouse retinal cells provided independent line of evidence for the
presence of CD39 on CD45+/CD11b+/P2Y12R+ microglial cells (Fig. 3G) and CD45-/IB4+/CD31+ vascular
endothelial cells (Fig. 3H). CD73 is also weakly expressed on microglial cells, but not in the blood vessels
(Fig. 3G,H).

Single cell transcriptomic analysis of mouse and human retinal cells reveals relatively conserved
purinergic signatures between the species

                                                   Page 6/38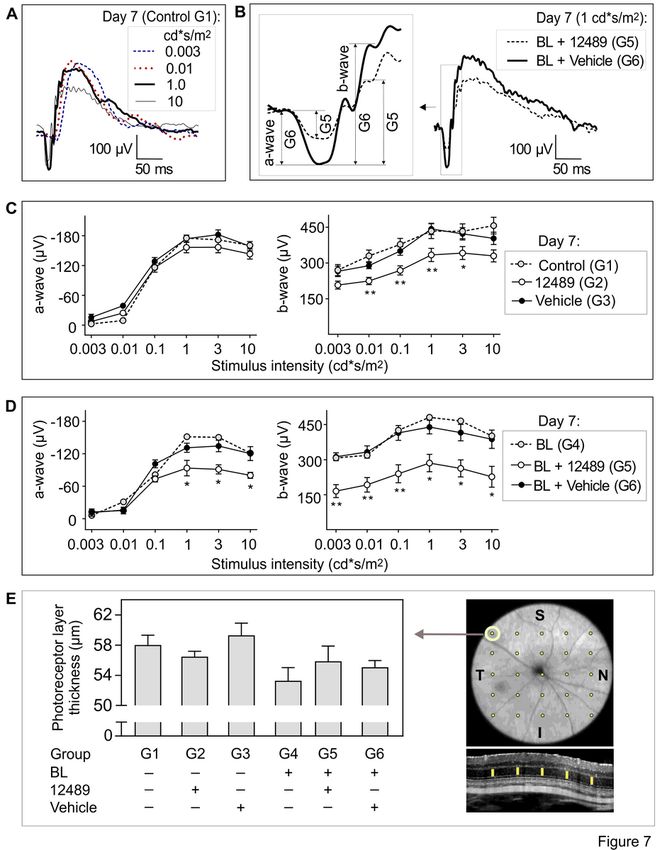
The expression profiles of genes encoding major purine-inactivating enzymes and ARs were also
characterized at a single-cell resolution by using publicly available scRNAseq data of mouse retinal cells
[37]. Single-cell transcriptomic analysis demonstrated specific distribution of ectoenzymes in mouse
vascular endothelial cells (Entpd1/CD39high, Alpl/TNAPhigh), perivascular cells (Entpd1/CD39low,
Enpp1/ENPP1low), retinal microglia (Entpd1/CD39low), rod photoreceptors (Nt5e/CD73high, Alpl/TNAPlow),
horizontal cells (Nt5e/CD73high), RGC (Entpd2/NTPDase2low), Müller glia and astrocytes
(Entpd2/NTPDase2high) (Fig. 4A). In contrast to our multiplex imaging data showing the presence of
CD39 immunoreactivity (Fig. 1B) and ATP/ADP-inactivating activity (Fig. 3C,D) in the OS of photoreceptor
cells, transcriptomic approach did not reveal CD39-encoding gene in rod cells at mRNA level (Fig. 4A).
Although the expression of Entpd1 on microglial cells was very low in this study, the use of another
scRNAseq dataset of sorted Cx3cr1+ mouse retinal cells [38] revealed that Entpd1/CD39 is highly
expressed on two major populations of P2ry12+ and Hmox1+ microglial cells, and additionally
demonstrated the presence of other enzyme of the purine catabolic chain, ADA, on retinal Hmox1+
microglial cells and perivascular macrophages (Fig. 4B). While a detailed characterization of signal
transduction pathways mediating biological effects of ADO lies beyond the scope of this study, we also
analyzed the expression profiles of major AR subtypes. ARs are selectively expressed on various mouse
retinal cells, including vascular endothelial (Adora2a/A2ARlow) and perivascular (Adora2a/A2ARhigh) cells,
RGC (Adora1/A1Rhigh), Müller glia and astrocytes (Adora1/A1Rlow), P2ry12+ microglial cells and Rorb+
macrophages (Adora3/A3Rhigh) (Fig. 4A,B). Notably, data on highly selective expression of Nt5e/CD73 on
the latter subset of Adora3+/Rorb+ macrophages suggest that ADO metabolism may be relevant in
controlling adenosinergic signaling and function in this relatively small population of mouse retinal
myeloid cells (Fig. 4B).

To further identify the similarities and differences in the purinergic signatures between rodent and human
eyes, we utilized single cell transcriptomic atlas of the human retina [39]. Ecto-nucleotidases and TNAP
are selectively expressed on the human retinal endothelial cells (ENTPD1/CD39low, ALPL/TNAPhigh),
microglial cells (ENTPD1/CD39high, NT5E/CD73low), rod terminals of photoreceptor cells (NT5E/CD73high,
ALPL/TNAPlow), amacrine cells (ENPP1/ENPP1low), and Müller glia and astrocytes
(ENTPD2/NTPDase2low), while the expression of ADO-inactivating enzyme ADA was maintained at very
low or undetectable levels in all human retinal cells (Fig. 4C). These human transcriptomic data are
consistent with our recent in situ enzyme histochemistry and immunofluorescence imaging data showing
tissue-specific distribution of key ecto-nucleotidases (CD39, NTPDase2, CD73) and TNAP in the human
sensory neuroretina and optic nerve head [16]. Additional scRNAseq analysis of adenosinergic signaling
pathways revealed that, similar to mouse retina, human retinal microglial cells and Müller glia and
astrocytes express high levels of A3R (ADORA3) and A1R (ADORA1), respectively. However, unlike mouse
blood vessels which express Adora2a/A2AR+, human retinal endothelial cells express another A2R
subtype, ADORA2B/A2BR. Other human retinal cell subsets do not appear to express either AR subtype
(Fig. 4C).

                                                 Page 7/38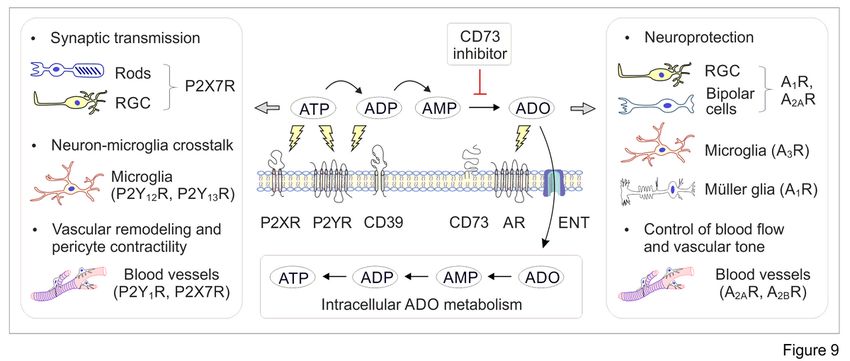
Overall, despite some species-specific variations, the expression profiles of key purinergic enzymes and
AR subtypes appear to remain relatively conserved between the mouse and human eyes. These findings
are summarized in Fig. 5 which schematically illustrates cell- and tissue-specific distribution of ecto-
nucleotidases in the mammalian eye. In particular, data on selective compartmentalization of CD73 in
both mouse and human photoreceptor cells provide a solid background for more thorough investigation
of the role of this ectoenzyme in retinal function under various challenging and noxious conditions and
further translation of these experimental data to clinic.

Pharmacological inhibition of ocular CD73 impairs retinal
activity in dark-adapted mice exposed to bright light
Taking into account data on direct involvement of adenosinergic signaling in the modulation of light-
evoked responses of retina [40–42], we hypothesized that pharmacological inhibition of the CD73-ADO
axis may affect retinal function. Several novel CD73 inhibitors were designed and synthesized recently in
our laboratories based on N6-benzyl-α,β-methylene ADP (PSB-12379) as a lead structure, which are
characterized by exceptionally high selectivity, nanomolar inhibitory potency toward human, rat and
mouse CD73, and high metabolic stability in human plasma and in rat liver microsomes [25]. Studies with
fluorescein-conjugated CD73 inhibitors additionally confirmed the utility of these compounds as
fluorescent probes capable of binding directly to CD73 on various cells and tissues, including mouse
CD73+ photoreceptor cells [43]. Based on these observations, the most potent CD73 inhibitor, PSB-12489
(Fig. 6A) [25], was chosen as a suitable drug for further examination in our functional assays.
Competitive TLC analysis of soluble CD73 activity confirmed the ability of PSB-12489 to inhibit the
hydrolysis of [3H]AMP by human and mouse sera in a concentration-dependent manner with the IC50
values in the low nanomolar range, whereas the classical CD73 inhibitor adenosine 5′-(α,β-
methylene)diphosphate (AMPCP) exerted inhibitory effects at ~ 100 times higher concentrations
(Supplementary Fig. 4). This conclusion was independently ascertained by in situ enzyme histochemistry
showing that treatment of mouse eye cryosections with increasing concentrations of PSB-12489 (0.1-1
µM), but not with equimolar concentrations of AMPCP, progressively reduced the intensity of AMP-
specific staining in the photoreceptor layer (Fig. 6B).

Next, the role of CD73-generated ADO in the maintainance of retinal activity was assessed in vivo, as
schematically illustrated in Fig. 6C. Electrophysiological analysis of the mouse retina was performed by
recording fERG responses from dark-adapted (scotopic) eyes stimulated with increments of light intensity
from 0.003 to 10 cd*s/m2 (Fig. 7A). Figure 7B shows representative electroretinograms recorded in mice
from two experimental groups, which can be divided into the following components: the first a-wave that
appears as a negative amplitude change, and the b-wave that appears as a large positive amplitude
change right after the a-wave. The a-wave of the electroretinogram reflects the functional activity and
integrity of the photoreceptors, whereas the b-wave originates in retinal cells that are post-synaptic to the
photoreceptors, including inner retinal cells (bipolar and amacrine cells) and RGC [40, 44, 45]. Notably,
C57BL/6N mice are known to be homozygous for the rd8 mutation in Crumbs homolog 1 (Crb1) gene,
                                                  Page 8/38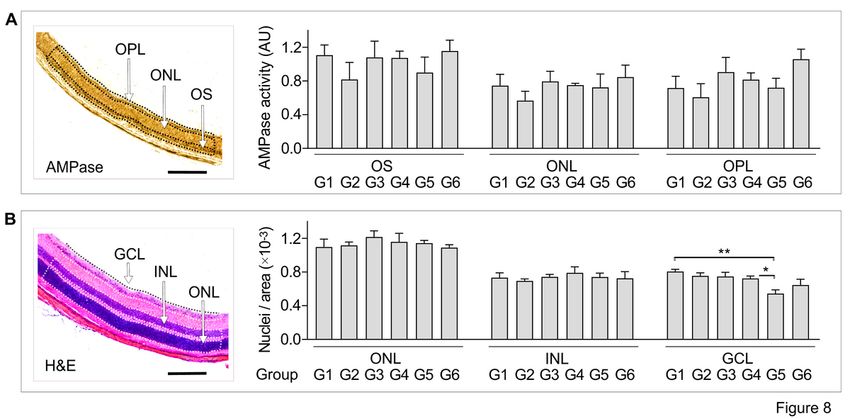
which may lead to severe retinal dysplasia in the inferior retina and other ocular abnormalities [46]. These
lesions appear as white to yellow flecks on fundus examination, and the phenotype is worsened by
exposure of C57BL/6N mice to BL [47]. Comparative analysis of fERG responses in C57BL/6N versus
BALB/c mice also demonstated that C57BL/6N eyes are characterized by significant decreases in the b-
wave amplitudes recorded at light intensities of 0.1 and 1 cd*s/m2, whereas the a-wave amplitudes
remain comparable among the strains (Supplementary Fig. 5A).

Based on these findings, BALB/c mice were chosen as an appropriate model for studying the role of ADO
metabolism in the retinal function. To achieve a sufficient inhibitory effect, PSB-12489 was administered
locally into the vitreous cavity of dark-adapted mice at a relatively high dose (final concentration ~ 200
µM) followed by exposure of the treated mice to continuous illumination for 14 hours (Fig. 6C).
Measurement of basal fERG values before treatment did not detect any differences in the a-wave and b-
wave amplitudes in the study groups (Supplementary Fig. 5B). However, when fERG was repeated on day
7 post-treatment, relatively moderate but significant decreases in the b-wave amplitudes were found in
the PSB-12489-treated eyes (group G2), when compared to vehicle-treated (G3) and non-treated control
(G1) groups (Fig. 7C). These differences became even more substantial after exposing the PSB-12489-
treated animals to continuous BL (group G5). These mice were characterized by ~ 40–50% decrease in
the b-wave amplitudes at all stimulus levels of the light intensity tested and also showed a decrease in
the a-wave amplitude recorded at high light intensities (1–10 cd*s/m2), when compared to vehicle-treated
(G6) and non-treated (G4) groups exposed to BL (Fig. 7D). Notably, in contrast to the conventional
experimental model of BL-induced retinal damage induced by extending the period of dark adaptation to
24 hours and characterized by markedly impaired scotopic responses (our unpublished observations), the
combination of dark adaptation and light illumination parameters used in this work did not by itself
cause any adverse effects on retinal electrical activity (Supplementary Fig. 5C).

Exposure of dark-adapted eyes to CD73 inhibitor and BL caused a loss of RGC with no changes in total
retinal thickness.

The thickness of the retina was determined in live animals immediately after fERG recording by using
high-resolution spectral domain optical coherence tomography (OCT). Photoreceptor layer thickness was
measured in superior temporal area of the retina, which is the most sensitive to the retinal damage. No
significant changes in total retinal thickness were observed between the groups studied (Fig. 7E).
Photoreceptor CD73 activity and the integrity of the treated retina were also interrogated at the
histological level. Given the uneven distribution of CD73 in the mouse photoreceptor layer, AMP-specific
staining intensities were determined in three different regions, including highly CD73-positive OS of
photoreceptor cells, as well as ONL and OPL characterized by intermediate enzyme expression (Fig. 8A,
left panel). Quantitative analysis did not detect any down-regulation of AMPase activity in the eyes
receiving PSB-12489 (groups G2 and G5; Fig. 8A). These data suggest that, in spite of high inhibitory
potency of PSB-12489 toward photoreceptor CD73 (Fig. 6B), a single intravitreal injection of PSB-12489
presumably inhibits ocular ADO production via a temporary and reversible mechanism, which restored to
control levels on day 7 post-treatment. The numbers of nuclei in the retinal layers were quantified to
                                                 Page 9/38
provide a further assessment of cell survival in the treated eyes. Mice receiving PSB-12489 and exposed
to BL (G5) were characterized by a loss of RGC in the innermost GCL, with no change in the total number
of photoreceptor cells present in the inner and outer segments of the retina (Fig. 8B).
Further studies would be required to elucidate the exact mechanism(s) underlying the revealed inhibitory
effects of PSB-12489 on retinal function. Taking into account the complexity of purine homeostasis in
the mammalian eye (see Fig. 5), and the important role of adenosinergic signaling in retinal functioning
during transition from darkness to light [11, 12], it is reasonable to conclude that inhibition of the CD73-
ADO axis in dark-adapted mice could shift the entire balance between ocular ATP and ADO levels.
Potential consequences of blocking this metabolic chain are highlighted in Fig. 9 and may particularly
include the impaired neuroprotective and hyperemic responses mediated via AR-dependent and/or
intrinsic receptor-independent mechanisms, as well as the simultaneous accumulation of pro-
inflammatory and cytotoxic ATP in the retinal environment.
Discussion
By investigating the combined features of ocular purine homeostasis and electrical activity of the retina,
we have identified a link between these different but apparently interrelated processes. The major
findings are summarized as follows: (i) this work identified the presence of an extensive and spatially
arranged network of ectoenzymes in the mouse and human eyes where they coordinately control ATP
and ADO levels in a cell- and tissue-dependent manner; (ii) the essential neuroprotective role of the CD73-
ADO axis was further ascertained in functional in vivo assays showing that temporary inhibition of ocular
CD73 activity in dark-adapted mice prior to their transition from darkness to light caused a decrease in
fERG responses and loss of RGC.
To our knowledge, this is the first study providing a holistic view of ocular purine metabolism and
signaling as a complex and spatially integrated network. By using two independent and complementary
approaches, in situ enzyme histochemistry and multiplexed imaging, we were able to pinpoint both the
catalytic activities and the expression levels of major purinergic ectoenzymes in the mouse neuroretina,
optic nerve head and cornea. These imaging data, in combination with dissociation-based flow-
cytometric and scRNAseq analyses of mouse and human retinal cells, provide sufficient justification for
re-evaluating the existing models of ocular purine metabolism and its role in retinal functioning. Similar
to the high expression of CD39 in the systemic circulation where it controls hemostasis through
termination of prothrombotic, proinflammatory and vasoactive effects of circulating ATP and ADP [24,
48], CD39 is also ubiquitously expressed on blood vessels of various caliber located in the optic nerve
head and retinal and choroid layers. On the other hand, contrary to the previous reports showing high
CD73 expression on endothelial cells lining the lumen of large blood vessels, such as human and rodent
aorta, carotid and coronary arteries [24, 49], and also central retinal vessels of human optic nerve head
[16], we did not detect any CD73 immunoreactivity, AMPase activity, and Nt5e/CD73 gene expression in
the mouse retinal vasculature. This observation also contrasts with the current view of ADO as a key
regulator of ocular blood flow and vascular tone which elicits its vasoactive effects through binding to
Page 10/38A2AR/A2BR expressed on retinal endothelial and perivascular cells [[12], also Fig. 4]. This apparent
discrepancy can be explained by the existence of alternative pathways which ensure local ADO supply to
the retinal vessels. These mechanisms might particularly include the direct release of endogenous ADO
by vascular and neuronal cells via equilibrative nucleoside transporters [27, 50], metabolism of AMP into
ADO by neighboring CD73+ cells located in close vicinity to the vessel wall (such as microglia and
horizontal cells; current study), as well as ADO formation at the vitreoretinal interface through soluble
intravitreal CD73 activity [16, 21].
Although the precise mechanisms involved in the adenosinergic control of ocular blood flow remain to be
elucidated, this study allows us to consider microglial cells as one of the most promising candidates
regulating functional hyperemia and neurovascular coupling in the eye. Microglia are the main resident
macrophages in the central nervous system. They maintain brain homeostasis by monitoring and
scavenging dying cells, engulfing synaptic material through a pruning process, and also responding to
pathogenic stimuli by the release of IL-1β, TNF-α and other proinflammatory cytokines [29, 51, 52]. Recent
studies have also demonstrated a key role for the ATP-ADO axis in microglia-driven inhibition of neuronal
activity in mouse and human brains [51, 52], which mainly occurs via so-called "somatic microglia-neuron
junctions" characterized by a highly specialized nanoarchitecture optimized for purinergic signaling [53].
While much of our knowledge concerning microglia-neuron interaction has been derived from brain
research, these results are not directly transferrable to the retinal microglial cells which differ
substantially in terms of morphological features and functional properties [54, 55], and may also undergo
dramatic transcriptomic alterations and differentiate into a plethora of subsets during retinal
homeostasis and degeneration [35, 38]. Here, we showed that retinal microglia express several key
purinergic receptors (P2Y12R, P2Y13R, and A3R) (Fig. 4B), and in addition, create an intricate and spatially
arranged network in the retinal parenchyma by continuously extending and retracting their extremely
branched and motile CD39high/CD73low processes and forming local “purinergic junctions” with
CD39low/CD73- neuronal cell bodies and CD39high/CD73- blood vessels (Fig. 2, Supplementary Fig. 3, and
Movies 1–3). With this knowledge in mind, and knowing that extracellular ATP acts as a local
chemoattractant that leads to the targeted recruitment of microglial protrusions to activated synapses
[51, 52], while ATP-derived ADO plays a counteracting role in protecting retinal neurons from hyper-
excitation [3, 56, 57], it may be reasonably concluded that, similar to brain-residing microglia, retinal
microglial cells also play a pivotal role in the maintainance of the homeostatic neuronal
microenvironment via coordinated control of ocular ATP and ADO levels.
Along with CD39, another member of this family, NTPDase2, may contribute to the metabolism of ATP in
the eye. This study, when analyzed together with previous data on human, rodent and zebrafish eyes,
provides evidence for selective localization of NTPDase2 in the optic nerve bundles [16], Müller glia ([4,
15, 18]; Fig. 5), as well as corneal keratocytes and tubulin-βIII+ neuronal filaments in the innermost retinal
layer (Supplementary Fig. 2D). Due to the high preference of NTPDase2 for the hydrolysis of ATP over
ADP [48, 58], this ectoenzyme presumably has functionality in the rapid scavenging of mitogenic ATP in a
neuronal environment, while the subsequent degradation of ATP-derived ADP will occur with a
Page 11/38considerable delay. We have also identified the presence of yet another enzyme, TNAP in the mouse RGC
layer, blood vessels and corneal epithelium (Figs. 3F and 4A), as well as in the human sensory
neuroretina, optic nerve head and vitreous fluid [16]. Although TNAP does not appear to contribute
significantly to the metabolism of ocular adenine nucleotides, it is relevant to note that, due to its
surprisingly broad substrate specificity, this ectoenzyme can regulate blood clotting, bone mineralization,
cartilage formation, and other cellular functions by degrading other phosphate-containing signaling
compounds, such as pyrophosphate (PPi) and inorganic polyphosphates [24, 28, 58]. Since TNAP has
been identified among the top calcification-related genes overexpressed in the human trabecular
meshwork [59], and as it is also highly expressed in pathological neofibrovascular tissues surgically
excised from eyes with diabetic retinopathy [16], it would be interesting to evaluate the distribution of this
enzyme in the eyes with pathological neovascularization and ectopic mineralization.
This work also points to the need of more careful evaluation of similarities and differences in purinergic
signatures across species which should be taken into account during the study of ADO homeostasis in
rodent eyes and further translation of these experimental data to humans. Specifically, similar patterns of
high expression of CD73 both in the human [16, 31] and rodent ([32, 60], current study) photoreceptors
suggest an equally important role for this ecto-nucleotidase in governing adenosinergic signaling along
the sensory retina and hence, in the development of electrical excitation in all mammalian eyes. A salient
finding of this work is that pharmacological inhibition of CD73 has a fairly moderate effect on the fERG
responses in dark-adapted eyes, but rendered animals became hypersensitive to continuous exposure to
BL at levels that by themselves would not normally cause any adverse shifts in visual cycle or retinal
structure. Taking into account data on a crucial role of ADO in regulating photoreceptor coupling [11],
light and sleep signaling [10], and functional hyperemia [12] in dark-adapted eyes, it is tempting to
speculate that CD73-generated ADO confers endogenous protection against light-induced phototoxicity to
the retina. According to this scenario, moderate but significant decrease in b-wave waveforms in PSB-
12489-treated eyes (Fig. 7C) could reflect the reduced activity of photoreceptor CD73 and/or intravitreal
soluble CD73 and as a consequence, insufficient activation of ARs localized on the INL and RGC facing
the vitreous lumen. This impact was amplified by continuous illumination of the treated eyes, as
ascertained by marked reduction of both a-wave and b-wave amplitudes (Fig. 7D) and concurrent loss of
RGC (Fig. 8B). These exacerbated effects of PSB-12489 on retinal function in BL-exposed mice are
presumably mediated through multiple mechanisms, and may include shifts in the equilibrium between
ocular purine levels from neuroprotective and hyperemic ADO-rich environment toward a proinflammatory
and cytotoxic ATP-regenerating phenotype (Fig. 9).
While most of the effects of extracellular ATP and ADO are thought to be mediated via canonical signal
transduction pathways involving activation of nucleotide- or nucleoside-selective receptors, the
alternative receptor-independent mechanism that is linked to the cellular uptake of ADO and its
phosphorylation into ATP may play an equally important yet understudied role. In fact, previous data
demonstrated potentiation of retinal hyperemia, post-ischemic recovery, and both spontaneous and light-
evoked activities of retinal neuronal cells after prevention of endogenous ADO transport and metabolism
Page 12/38in the presence of the inhibitors of nucleoside transporters (NBTI and dipyridamole) or adenosine
deaminase (EHNA) [56, 61]. Increasing the metabolic clearance of intracellular ADO in the eyes of
transgenic mice overexpressing human adenosine kinase also affected the circadian rhythm, manifested
in the reduced slow-wave activity after sleep deprivation [10]. This intracellular salvage pathway might be
especially relevant for RGC, because of their extremely high ATP turnover rate and great energy demands
[62], and also capability of selectively accumulating intravitreally injected [3H]ADO in their body [40].
Therefore, even slight alterations in energetics or blood supply in this high oxygen consumption layer
might trigger apoptosis and death of the intrinsically photoreceptive RGC, known to be particularly
sensitive to light-regulated effects of ADO [41].
In conclusion, these data point out the need for a more careful evaluation of the entire purinome in the
mammalian eye by taking into account the complexity and redundancy of metabolic and signaling
pathways involved in biological effects of ATP and ADO. Our 3D imaging workflow also provides novel
insights into spatial relationships and heterotypic interactions between different cell types in the retinal
environment and on this basis, suggests the important and hitherto unrecognized role of retinal microglia
in the purinergic control of ocular blood flow and neuronal activity. Furthermore, data on impaired fERG
responses in the mouse eyes treated with CD73 inhibitor provide evidence for a crucial role of the CD73-
ADO axis in the maintenance of retinal integrity and function in "steady-state" and especially under
challenging conditions induced by prolonged light illumination. As a consequence, a new enzyme-based
strategy could be used to restore ADO levels and photoreceptor function in the injured retina. There is also
a paucity of knowledge regarding the relationship between nucleotide-inactivating/ADO-producing and
counteracting ATP-regenerating ectoenzymes, as well as intracellular purine salvage pathways in the eye.
Improving our knowledge in this field may be useful for understanding the role of purine homeostasis in
ocular (dys)functions and on this basis, developing the effective new strategies for the treatment of
retinal degeneration and other vitreoretinal diseases.
Methods
Reagents and antibodies
Detailed information on primary antibodies and other molecular markers used in this study is provided in
Table S1. Secondary Alexa Fluor® 488-, 546-, 633- and 750-conjugated goat anti-mouse, anti-rabbit, anti-
rat and anti-chicken antibodies, Alexa Fluor® 546-phalloidin, Alexa Fluor® 647-streptavidin, ProLong®
Gold Antifade reagent with 4,6-diamidino-2-phenylindole (DAPI), 5’-bromo-4-chloro-3-indolyl phosphate
(BCIP), and nitro blue tetrazolium (NBT) were from Invitrogen™ (ThermoFisher Life Technologies). Cy3™-
conjugated donkey anti-guinea pig IgG and Fab fragment donkey anti-mouse IgG were from Jackson
Immuno Research Laboratories (West Grove, PA). Brilliant Violet 421™ (BV421)-conjugated streptavidin
was from BioLegend® (San Diego, CA). Purified rat anti-mouse CD16/CD32 (Mouse BD Fc Block™) was
from BD Pharmingen™. [2,8-3H]AMP was from American Radiolabeled Chemicals Inc. (Campro Scientific,
The Netherlands). Ketalar (ketamine) was from Pfizer Oy Animal Health (Helsinki, Finland). Medetomidine
Page 13/38(Domitor) and atipamezole (Antisedan) were from Orion Oy (Finland). Oxybuprocaine (Novesin) was from
Novartis International AG. Low melting temperature agarose (LMA, NuSieve™ GTG™ Agarose) was from
Lonza. Biotin-conjugated lectin from Bandeiraea Simplicifolia (isolectin subunit B4, IB4), Collagenase P
from Clostridium Histolyticum, α,β-methylene-ADP (AMPCP), ATP, AMP, and other chemicals were from
Sigma-Aldrich.
Animals
Female and male C57BL/6N mice were maintained at Central Animal Laboratory of the University of
Turku and used for histochemical analysis of the eye, flow cytometry and blood serum preparation. The
experimental procedures were reviewed by the local Ethics Committee on Animal Experimentation of the
University of Turku and approved by the Provincial State Office of Western Finland with the license ID
ESAVI/5762/04.10.07/2017. For intravitreal treatment and bright light exposure studies, male BALB/c
mice were obtained from the Laboratory Animal Centre (University of Tartu, Tartu, Estonia) and
maintained at Experimentica Ltd. Laboratory Animal Center (Kuopio, Finland). The animals were treated
in accordance with the ARVO Statement for the Use of Animals in Ophthalmic and Vision Research and
the EC Directive 86/609/EEC for animal experiments, using protocols approved and monitored by the
Animal Experiment Board of Finland (Experimentica Ltd. license ID: ESAVI-004139-2017). All mice were
3–4 month of age and with a body weight of 22–25 g. The animals were raised in pathogen-free
conditions, housed at a constant temperature (22 ± 1°C) in a light-controlled environment (lights on from
7 am to 7 pm), and provided with food and water ad libitum.
Intravitreal treatment and bright light exposure
A total of 24 BALB/c mice were divided into six groups (3–5 animals per group). The animals were kept
in transparent plastic cages and subjected to different experimental settings, as outlined in Fig. 6. Before
the experiment, the pupils of the mice were expanded with tropicamide (5 mg/ml, Oftan® Tropicamid,
Santen, Japan). White light lamps (URZ3372, 6400K, Kemot, Poland) were directed to the cages (one
from the bottom and one from the top). Mice were exposed to 9,500 lux BL for 14 hours, starting from
19.00 on day 0 until 9.00 on day 1. Five hours before BL induction, aliquots of CD73 inhibitor PSB-12489
(2 µl of 2 mM stock solution diluted in phosphate-buffered saline (PBS) were administered by unilateral
intravitreal injections both to the right and left eyes. Equal volumes of PBS were administered to the eyes
of vehicle-treated mice. The animals were returned to a normal facility light/dark cycle of 12h/12h and
used in experiments 7 days after the treatments, as described below.
Flash electroretinography (fERG)
BALB/c mice were dark-adapted for overnight and all procedures for fERG recordings were performed
under dim red light. The animals were anesthetized with a mixture of Ketalar (37.5 mg/kg) and
medetomidine (0.45 mg/kg) administered intraperitoneally. Body temperature was maintained through
the use of a physiological heating pad (set to 38°C). Eyes were locally anesthetized by topical application
of a single drop of oxybuprocaine. Thereafter, eyes were fully dilated by applying drops of atropine (3
min) and phenylephrine (3 min). To improve conductivity between eye and electrode, one drop of 0.9%
Page 14/38saline was applied to both eyes. The reference electrode needle was inserted into the cheek and the
common grounding electrode was inserted into the base of the tail. To get a response from rods and
cones, a flash of various intensities (0.001–10 cd*s/m2) was used (Supplementary Table 2). General
anesthesia via medetomidine was immediately reversed by an α2-antagonist atipamezole (0.5 mg/kg sc.)
The following parameters were analyzed and reported: amplitude and latency of the a-waves (first
negative fERG component), and amplitude and latency of the b-waves (first positive fERG component).
All parameters are provided as raw data.
Optical coherence tomography (OCT)
High resolution spectral domain OCT was performed on the baseline and 7 days after exposure of the
BALB/c mice to PSB-12489 and/or BL, as described elsewhere [63]. All measurements were performed
under general anesthesia. The pupils of both eyes were dilated after application of 5 mg/ml solution of
tropicamide. In order to prevent corneal drying, a Systane Ultra Eye gel (Systane® Ultra, Norbrook,
England) was applied on the cornea. The mice were fixed in the holder and 10 series of 100 b-
measurements were carried out (each b-measurement had 1000 a-measurements). The data obtained
were aligned, averaged and a 3D image was created. Photoreceptor layer thickness was measured at 25
different points, which were selected using InVivoVueDiver (Bioptigen, JAV) software. The central point
was targeted at the center of the optic nerve. The photoreceptor layer thickness was estimated by
measuring the distance between the outer plexiform layer and the external limiting membrane.
Sample collection and processing
Mice were killed by carbon dioxide and the eyeballs were immediately enucleated and processed for
further analyses in the following ways. For enzyme histochemistry, the eyeballs were embedded in the
cryo-mold with Tissue-Tek® optimal cutting temperature compound (Sakura Finetek Europe B.V., the
Netherlands), cut at 10 µm onto Superfrost® Plus slides (ThermoFischer Life Technologies) using a Leica
CM 3050S cryostat, air-dried and stored at -80°C. For immunofluorescence staining, the eyes were fixed
for 2 hours at room temperature (RT) with PBS containing 4% paraformaldehyde (PFA) and embedded in
the mold with 4% solution of LMA dissolved in PBS and pre-heated in the microwave oven. LMA-
embedded eyes were sectioned at 100 µm thickness using a Leica VT1200S vibrating microtome,
additionally fixed for 30 min with 4% PFA, stored in PBS at 4°C, and processed for 3D
immunofluorescence staining within one week of preparation. For flow cytometry analysis, the retinas
were dissected from the eyecups and digested into the single-cell suspension, as described below.
In situenzyme histochemistry
For localization of ecto-nucleotidase and TNAP activities, the combined histochemical approach was
employed [36]. In brief, tissue cryosections were thawed, fixed for 5 min with 4% PFA, and pre-incubated
for 45 min at RT in Trizma-maleate sucrose buffer (TMSB) [40 mmol/L Trizma-maleate, 0.25 mol/L
sucrose, pH 7.4] supplemented with the TNAP inhibitor tetramisole (2 mM). The slides were subsequently
incubated for one hour at RT in a mixture containing TMSB (pH 7.4), 2 mM tetramisole, 2 mM Pb(NO3)2,
Page 15/380.5 mM CaCl2 and one of the following nucleotide substrates: ATP (300 µmol/L), ADP (300 µmol/L) and
AMP (1 mmol/L). In blank specimens, the substrate was omitted from the incubation solution. The lead
orthophosphate precipitated in the course of nucleotidase activity was visualized as a brown deposit by
incubating the sections for 15 s in 0.5% (NH4)2S. TNAP activity was additionally evaluated by measuring
the intensity of dark purple precipitate after incubating the tissues for 20 min at RT in a mixture
containing TMSB (pH 9.3), 5 mM MgSO4 and artificial enzyme substrates BCIP and NBT (2 mmol/L
each). Tissue sections were also stained with hematoxylin and eosin (H&E). Whole tissue section
imaging was performed using Pannoramic-250 Flash slide scanner (3DHistech Ltd., Budapest, Hungary)
with a 20× objective.
Immunofluorescence staining
LMA-embedded vibratome-cut eye sections (100–150 µm thickness) were incubated for one hour at RT in
300 µl PBS containing 2% bovine serum albumin (BSA) and 0.5% (vol/vol) Triton X-100 (blocking buffer)
and subsequently incubated overnight at 4°C with biotin-conjugated IB4 and primary antibodies diluted in
300 µl of blocking buffer, as specified in Table S1. To avoid off-target background signal during staining
of mouse eyes with mouse anti-rhodopsin and anti-NeuN antibodies, endogenous immunoglobulins were
blocked by pre-treating the samples for two hours with unconjugated Fab fragment of donkey anti-mouse
IgG (20 µg/ml). The samples were incubated overnight at 4°C with the appropriate fluorochrome-
conjugated secondary antibodies and Fluor® 647-streptavidin diluted in blocking buffer at ~ 1:800. Alexa
Fluor® 488-conjugated anti-CD31, NL493-conjugated anti-tubulin-βIII, and Cy3™-conjugated anti-smooth
muscle actin-α (SMA-α) antibodies and Alexa Fluor® 546-Phalloidin were added during the incubation
with secondary antibodies for labeling the vascular endothelial cells, neuronal filaments, perivascular
cells, and F-actin filaments, respectively. All staining procedures were performed in a 24-well plate under
60 rpm orbital rotation, by washing the wells after each treatment with 300 µl of blocking buffer (3 × 30
min). Stained eye sections were additionally washed for 10 min in 500 µl PBS, transferred onto the
microscope slide, aligned using forceps under stereomicroscope, and mounted with ProLong® medium
with glass spacers inserted between the slide and the coverslip. Imaging was performed using 3i CSU-W1
spinning disk confocal microscope (Intelligent Imaging Innovations, Inc.) equipped with Hamamatsu
ORCA Flash 4 sCMOS camera (Hamamatsu Photonics, Hamamatsu, Japan) and Slidebook 6.0 software.
Z-stacks of the medial retina and other eye structures were captured using the following objectives (Carl
Zeiss): Plan-Apochromat 10×/0.45, Plan-Apochromat 20×/0.8, LD C-Apochromat 40×/1.1, and Plan-
Neofluar oil 63×/1.4. Maximum intensity projections and 3D reconstructed images were prepared using
Imaris 8.4 software (Bitplane). 3D datasets were rendered into movies using Imaris Animation technology
and exported to mov format.
Flow cytometry
Eyes were gently enucleated from C57BL/6N mice. The cornea and lens were removed and retina was
carefully dissected from the eyecup using a dissection microscope, fine forceps and surgical
microscissors. Retinas from 2 mice were pooled and digested for 1h at 37°C with RPMI-1640 medium
containing 0.2 mg/ml collagenase P and 0.1 mg/ml DNase. The cells were passed through a 100 µm
Page 16/38filter and blocked for 15 min with purified rat anti-mouse CD16/CD32 (Mouse BD Fc Block™). The single-
cell suspension was subsequently incubated for 20 min with anti-CD73 (rNu9L-I5) and anti-CD39 (mN1-
2CI5) antibodies, together with biotin-conjugated IB4 and fluorescently-labeled antibodies against CD45,
CD11b, P2Y12R, and CD31 (see Supplementary Table 1). After washing, secondary antibodies including
Cy3™- or Alexa Fluor® 633-conjugated donkey anti-guinea pig IgG and Alexa Fluor® 488-conjugated goat
anti-rabbit IgG and a BV421™-conjugated streptavidin were added. Stained cells were washed and fixed
with 2% paraformaldehyde for 10 min. Flow cytometry analyses were performed using BD LSRFortessa
(BD Biosciences) and analyzed using FlowJo software (TreeStar Inc).
Competitive CD73 assays and analysis of photoreceptor
AMPase activity
Soluble CD73 activity was determined by thin layer chromatography (TLC) using human and mouse sera
as enzyme sources and [3H]AMP as preferred enzyme substrate [25]. The effect of CD73 inhibitors on
photoreceptor AMPase activity was also evaluated in situ by using lead nitrate-based enzyme
histochemistry [36, 64]. Noteworthy, both AMPCP and PSB-12489 act as reversible CD73 inhibitors.
Therefore, it was necessary to maintain these compounds in the assay medium during both the pre-
treatment step (30 min at room temperature) and subsequent one-hour incubation of the mouse eye
cryosections with the AMP substrate. AMPase activity was determined by measuring AMP-specific brown
staining intensities from the whole slide images using QuPath v.0.2.3 software [65]. Shortly, a project
including all images was created. Tissue areas were detected using the threshold classifier. The classifier
was run with full resolution (240 nm/pixel) for the whole project. The DAB (3,3'-diaminobenzidine)
channel and Gaussian pre-filtering were selected. Threshold was set to 1.15 without smoothing and areas
above threshold were classified as “positive”. Representative areas of the OPL, ONL and OS of
photoreceptor layer were manually selected, and the average DAB intensity level was used for AMPase
intensity quantification. The script for intensity analysis is shown in Supplementary Table 3.
Quantification of cell nuclei in the retinal layers
The images of transverse eye sections stained with H&E were captured using slide scanner, as described
above. Cell nuclei in the major retinal layers (ONL, INL, and GCL) were quantified using the Stardist deep
learning platform with Fiji-ImageJ. First, the mrxs files were converted into tiff format. The Stardist
Versatile (“H&E Nuclei”) pre-trained model was used in the analysis. The model was originally trained on
images from the MoNuSeg 2018 training data and the TCGA archive [66]. For all retinal layers, images
were normalized and the lower and upper percentiles were selected as 1 and 99.8, respectively. For GCL,
probability/score threshold value was set to 0.5, and the overlap threshold was set to 0.4. For INL and
ONL, the values were 0.1 and 0.6, respectively. After Stardist analysis, two representative areas from both
sides of the optic nerve were chosen and the amounts of nuclei per area unit were calculated.
Single-cell analysis of mouse and human retina
Page 17/38We utilized publicly available single-cell transcriptomic data of mouse retinal cells isolated from wild-type
mice on a C57BL/6J background [37], Cx3cr1YFP+ myeloid cells isolated from retina of wild-type CB6F1/J
mice [38], as well as human retinal cells isolated postmortem from cadaver eyeballs without apparent eye
diseases [39], all generated with a 10x Chromium based protocol. These data have been deposited in the
National Center for Biotechnology Information (NCBI) Gene Expression Omnibus (GEO) database
(https://www.ncbi.nlm.nih.gov/geo/) with accession numbers GSE132229, GSE126783 and GSE137537
for mouse retina, mouse Cx3cr1YFP+ microglial cells, and human retina scRNAseq data, respectively. The
raw data were analyzed by Seurat (ver 4.0) for graph-based clustering and analysis of gene expression.
Sctransform was applied to the data for normalization and variance stabilization of molecular count data
(Hafemeister C, Genome Biology). Principle component analysis (PCA) was performed and a graph-based
clustering approach was used by running the functions FindNeighbors and FindClusters. The clustering
was visualized with Uniform Maniforld Approximation and Projection (UMAP). Cells were typed by
examining expression of known marker genes. Markers used to phenotype cells in mouse retina included
Pde6a, Rho (Rods), Camk2b, Trpm1 (Bipolar cells), Opn1sw, Opn1mw (cones), Glul (Müller glia and
astrocytes), Gad1 (amacrine cells), C1qa, Aif1 (microglia), Pecam1 (endothelial cells), Nefl (retinal
ganglion cells), Onecut1, Onecut2, Lhx1 (horizontal cells), Rgs5, Cspg4 (perivascular cells) [37]. Markers
used to phenotype cells in mouse retinal Cx3cr1YFP+ cells included P2ry12, P2ry13 (P2ry12+ microglia),
Hmox1, Ifrd1, Il1a (Hmox1+ microglia), Mrc1, Cxcl2 (perivascular macrophages), Rorb, Rora (Rorb+
macrophages) [38]. Markers used to phenotype cells in human retina included PDE6A, RHO (rods), GLUL
(Müller glia and astrocytes), NEFL (retinal ganglion cells), CAMK2B, TRPM1 (bipolar cells), GAD1
(amacrine cells), GNAT2, OPN1SW, OPN1MW (cones), ONECUT1, ONECUT2, LHX1 (horizontal cells),
C1QA, AIF1 (microglia) and PECAM1 (endothelial cells) [39].
Statistical analysis
Statistical significance was determined by using two-tailed Student’s t-test and Mann-Whitney U-test. In
the case of fERG study, the difference between the control and treated groups was evaluated by multiple
t-test grouped analysis using the Holm-Sidak method. The levels of statistical significance were denoted
as *P < 0.05 and **P < 0.01. For competitive analysis, concentration-inhibition curves were generated in
3–5 separate experiments, and the IC50 values were calculated from one-site competition curves
constructed using nonlinear least-squares curve fitting. All results were analyzed with Prism GraphPad 7
software (GraphPad, San Diego, CA).
Online supplemental material
Supplementary Fig. 1 shows the distribution of CD39 and CD73 in the mouse retina and optic nerve head.
Supplementary Fig. 2 is associated with Fig. 1 and provides supporting information about the distribution
of CD39 and NTPDase2 in the mouse retinal vessels, choriocapillaris and cornea. Supplementary Fig. 3 is
associated with Fig. 2 and provides additional information about stereoscopic morphology of microglial
processes and their interaction with retinal blood vessels and neuronal cell bodies. Supplementary Fig. 4
summarizes competitive TLC data showing the ability of CD73 inhibitors to inhibit the hydrolysis of
Page 18/38You can also read