Catalan Economy The strength of an innovative and outward-looking nation - March 2022 - Gencat

Page created by Diane Frank
 
CONTINUE READING
Catalan Economy The strength of an innovative and outward-looking nation - March 2022 - Gencat
Catalan Economy
The strength of an innovative and
     outward-looking nation
            March 2022
Catalan Economy The strength of an innovative and outward-looking nation - March 2022 - Gencat
General
overview
Catalan Economy The strength of an innovative and outward-looking nation - March 2022 - Gencat
Basic indicators of Catalonia

                       Population (2021)    7.7 million
                                            Similar to Switzerland, Austria, Finland and
                                            Denmark.
                                            16.2% of Spain’s total population
                              GDP (2020)    224.125 M €
                                            Similar to Finland, Romania or Czechia.
                                            19.0% of Spanish GDP.
                   Per capita GDP (2020)    Catalonia: 103.4
                     In PPS (EU-27=100)
                  GVA by sectors (2020)     Agriculture (1.0%), Industry (19.8%),
                       (% of total GVA)     Construction (5.1%), Services (73.9%)

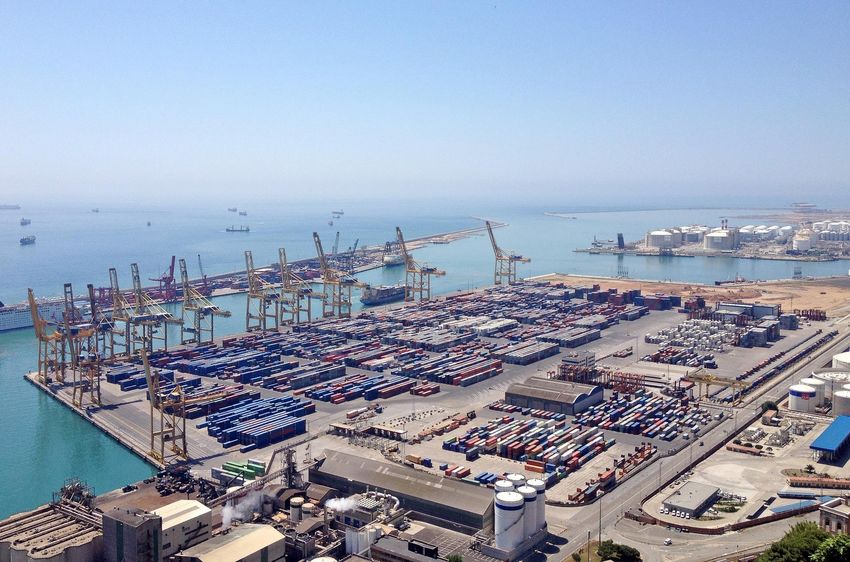
                      Barcelona and its metropolitan area are a buzzing startup scene
                       and a leading technological hub in Europe. The Barcelona area
                       is also a center of commerce, culture and services, and a first-rate
                       tourist destination.
                      Catalonia’s network of dynamic intermediate cities contributes
                       to the strength of the Catalan economy.
                      Catalonia’s strategic location favors close linkages with the
                       Mediterranean, continental Europe and Asia.
                                                                                              3
Catalan Economy The strength of an innovative and outward-looking nation - March 2022 - Gencat
Key data of the Catalan economy
    Strong economic growth in pre-                    GDP downturn in 2020 and                           Sustained expansion of exports
            pandemic years                             gradual recovery in 2021                                  of goods € billion
    Real GDP growth. 2014-19 average (%)                         2019Q4 = 100                           85
                                              105
      2,8
            2,6
3                                                                                                       65
                                               95
                  1,9   1,7
2
                              1,5              85                                                       45
                                        0,8
1
                                               75                                                       25
                                                     IV    I    II    III   IV    I     II   III   IV
0
     CAT    ES    EA    DE    FR        IT          2019       2020              2021

    Successful model of research                          High attraction of FDI                             Unemployment has increased
                                                     Best region to invest in southern                       less than in other recessions
                                                    Europe in 2022/2023 according to the
                                                                                                                      Unemployment rate (%)
       4th position in the European                           Financial Times
                                                                                                        25
        Research Area by amount of                    5-year average (million euros)
       research grants per inhabitant         5,000                                                     20
        (ERC Program, 2007-2019)              4,000                                                                                                   13,3
                                                                                                        15
                                              3,000
       • 34% of all Spanish patents                                                                                                                   10,2
                                              2,000                                                     10
                                                                                                                                                       7,4
     • 3.2% ERC scholarships while            1,000                                                     5
     Catalonia accounts for 1.7% of the           0
                                                                                                        0
               EU population
                                                                                                         2016    2017    2018   2019    2020   2021
                                                                                                                CAT        ES      EA

                                                                                                                                                             4
Catalan Economy The strength of an innovative and outward-looking nation - March 2022 - Gencat
Gross
Domestic
 Product
Catalan Economy The strength of an innovative and outward-looking nation - March 2022 - Gencat
The Catalan economy grows by 5.9% in 2021, above the
Spanish economy and the euro area

Real GDP                                             In 2020, Catalan GDP recorded a very
(annual percentage change)
                                                      strong contraction (-11.5%), more intense
                                                      than in the euro area. Among other factors,
                                                      due to the severity of the first wave, the
                                                      weight of sectors with high social
                                                      content activities (in particular with high
                                                      dependency on foreign tourism) and the low
                                                      turnout of sectors acting as stabilizers
                                                      (public administration or agricultural sector).
                                                     In 2021, the Catalan economy has grown
                                                      by 5.9%, above the Spanish economy
                                                      (5.0%) and the euro area (5.2%).
(f): forecast.
Source: Eurostat, IMF (January 2022), Idescat and
                                                     In 2022, the Catalan economy is expected
Government of Catalonia (October 2021).               to recover more strongly than the euro
                                                      area.
                                                     Improving epidemiological evolution, in a
                                                      context of a high percentage of vaccination,
                                                      has been key to economic improvement.

                                                                                                        6
Catalan Economy The strength of an innovative and outward-looking nation - March 2022 - Gencat
In 2021Q4, the Catalan GDP rose sharply and grew above
the euro area, which has been more affected by bottlenecks
 GDP in volume
 (q-o-q percentage change)
                                                                                                            Since 2021Q2, the Catalan economy
20,0
                       15,1
                           16,8                                                                              has been growing strongly, due to the
15,0                              12,4                                                                       fewer health restrictions and high
10,0                                                                                                         vaccination rates.
 5,0                                                                   3,3    2,2      2,6 2,3 2,2 2,0
                                            0,2          0,0
                                                                          1,2       1,3
                                                                                                     0,3    Despite the global problems arising from
 0,0
                                         -0,6     -0,6     -0,7 -0,2                                         supply disruptions, rising inflation and the
 -5,0
                                                                                                             outbreak of the sixth wave, the Catalan
-10,0                                                                                                        economy has shown a remarkable
                    -11,4
-15,0                                                                                                        adaptation to these circumstances and
         -16,0
-20,0       -17,7                                                                                            is accelerating in 2021Q4.
          2020Q2 2020Q3 2020Q4 2021Q1 2021Q2 2021Q3 2021Q4
        Catalonia Spain Euro area                                                                           In 2021Q4, the economic activity
 GDP in volume. 2021Q4                                                                                       increased significantly (2.2%), slightly
                                         % q-o-q                       % y-o-y                               above Spain (2.0%) and well above EMU
  Catalonia                                  2.2                           6.9                               (0.3%). In some countries, such as
  Spain                                      2.0                           5.2                               Germany (-0.7% quarterly), the effects of
  Italy                                      0.6                           6.4                               bottlenecks in industry have been
  Euro area                                  0.3                           4.6
                                                                                                             significant.
  Germany                                   -0.7                           1.4
  France                                     0.7                           5.4                              In annual terms, the Catalan economy
 Source: Idescat, INE and Eurostat.
                                                                                                             recorded a of 6.9% growth in 2021Q4,
                                                                                                             the second highest rate since 2001.
                                                                                                                                                            7
Catalan Economy The strength of an innovative and outward-looking nation - March 2022 - Gencat
Services are consolidating their recovery, which is quite
widespread by subsectors

 Gross Domestic Product in Catalonia                                   On average, in 2021, the industrial and
 (Seasonally and calendar adjusted data, annual percentage change)
                                                                        services sectors grew strongly, while
                                                             2021       agriculture and construction show
                      2020 2021
                                A
                                       Q1      Q2      Q3     Q4A       moderate increases.
 Agriculture           -2.6   1.5     2.3      1.6     2.6     -0.4    After the rebound in 2021Q2 (derived in
 Industry              -9.0   5.6     0.1    18.3      3.3     2.5      part from the base effect), services have
 Construction         -15.4   1.8   -13.9    19.8     -1.7     7.8
                                                                        significantly consolidated growth,
                                                                        which has spread to many subsectors.
 Services             -11.7   6.3     -4.8   17.2      5.6     8.8
                                                                        The improvement in construction also
 GDP                  -11.5   5.9     -3.8   18.3      4.0     6.9      stands out in 2021Q4.
 A
     Advanced data.
                                                                       The industrial sector has slowed down
 Source: Idescat.
                                                                        during 2021 due to disruptions in the
                                                                        supply of intermediate goods and the
                                                                        rising cost of inputs. It still maintains a
                                                                        significant increase, except for the
                                                                        evolution of the most affected subsectors.

                                                                                                                      8
Catalan Economy The strength of an innovative and outward-looking nation - March 2022 - Gencat
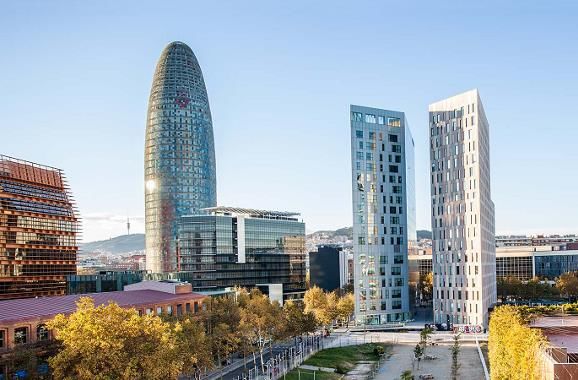
The high diversification of the Catalan economy is helping to
recover from the COVID-19 crisis

GVA distribution (percentage of total GVA, 2020)
                                                                                                 Catalonia has a long industrial
                                                       Catalonia   Spain     EA-19    EU-27
                                                                                                  tradition. The weight of industry
Agriculture, livestock, forestry and fisheries              1.1        3.4      1.7     1.8
Industry (mining, manufacturing and energy)                19.8       16.1     19.1    19.5
                                                                                                  (19.8%) and manufacturing
    Manufacturing                                          16.4       12.1     16.0    16.2       (16.4%) in total GVA is higher
Construction                                                5.1        6.2      5.4     5.6       than the average in Spain, and
Services                                                   73.9       74.3     73.8    73.1       similar to the euro area.
   Commerce; vehicle repair; transport and
   storage, and hotel
                                                           20.9       19.7     17.5    17.9      Trade is also a main pillar of
         Trade and repair of vehicles   1
                                                           14.1       12.6     11.0    11.3       the Catalan economy.
                                     1
         Transportation and storage                         4.7        4.6      4.8     5.0
         Accommodation services, food and
                                                            6.5        6.4      3.1     2.9
         beverages 1
    Information and communication                           4.0        3.9      5.3     5.5
                                                                                                              Services
    Financial and insurance                                 3.8        4.5      4.6     4.5
                                                                                                               73,9%
    Real estate activities                                 12.9       12.8     11.8    11.4
    Professional, scientific, technical and
                                                           10.0        8.6     11.4    11.1
    administrative
    Public administration, education, health and
                                                           18.4       20.5     20.0    19.8
    social services
    Arts, entertainment, entertainment and other
                                                            3.8        4.2      3.1     3.0
    services
1Dataof 2018 for Catalonia and of 2019 for the rest.                                                           Industry
Source: Idescat and Eurostat.                                                                 Construction      19,8%      Agriculture
                                                                                                 5,1%                        1,1%

                                                                                                                                      9
Catalan Economy The strength of an innovative and outward-looking nation - March 2022 - Gencat
Slowing in private consumption and dynamism in investment

Gross domestic product of Catalonia
(Seasonally adjusted data, annual percentage change)                                                               Demand-side data show a
                                                                2020                                       2021
                                                                                                                    moderation in the growth of
                                                              Annual                                                private consumption:
                                                             average             Q1            Q2           Q3      inflation is starting to take its
GDP                                                             -11.5           -3.8         18.3           4.0     toll and the retained savings
     Domestic demand                                                -8.2        -3.4         18.0           4.2     are mobilizing in part towards
        Household consumer expenditure                          -12.5           -5.6         21.9           3.2     real estate investing.
        Public administration consumer
                                                                    5.0          2.1           4.5          2.6
        expenditure1                                                                                               By the end of 2021, signs
        Gross capital formation       2
                                                                -13.6           -2.4         23.1           8.9     indicate that investment will
          Equipment goods and others                            -11.5            5.5         26.8          14.2     remain dynamic, also driven
          Construction                                          -14.7         -10.8          20.0           1.7
                                                                                                                    by NGEU support.
     External balance     3, 4
                                                                    -3.3        -0.8           2.5          0.3
        Foreign balance4                                            -3.1         0.0           3.1          0.0
          Total exports of goods and services                   -22.6           -3.3         41.2          10.0
             Foreign consumption                                -80.1         -91.6        816.4           37.8
          Total imports of goods and services                   -18.3           -4.0         38.0          12.0
1
    Includes the expenditure consumption by non-profit making institutions at the service of households.
2
    Sum of gross fixed capital formation and the stock variation.
3
    Includes the foreign balance and the balance with the rest of Spain.
4
    Contribution to the GDP growth.

Source: Idescat.

                                                                                                                                                        10
October forecasts for the Catalan economy predict an intense
growth: +6.4% in 2022
Macroeconomic forecasts for Catalonia                                    After a strong rebound in 2021
(annual percentage change of GDP)
                                                                          (5.9%), the Catalan GDP is
                                                          2022   2023
Generalitat de Catalunya                October 2021       6.4      -     predicted to grow at 6.4 % in 2022.
Chamber of Commerce of Barcelona        January 2022       6.3      -
BBVA                                    January 2022       5.7    5.0    Growth rate is higher than in most
                                                                          euro area countries.
Macroeconomic forecasts for Spain
(% of GDP annual growth)                                                 The balance of risks is moving to
                                                          2022   2023
                                                                          the downside, as a result of
Bank of Spain                       December       2021    5.4    3.9
IMF                                   January      2022    5.8    3.8     increasing geopolitical tensions:
BBVA                                  January      2022    5.5    4.9
Spanish government                  September      2021    7.0      -           Downside risks: bottlenecks in
European Commission                  February      2022    5.6    4.4            supply chains, geopolitical tensions,
                                                                                 rising energy prices, inflation, new
Macroeconomic forecasts for the Euro area                                        COVID waves.
(% of GDP annual growth)
                                                          2022   2023           Upside risks: progress in
Euro area                               February   2022    4.0    2.7            vaccination, economic indicators,
Germany                                 February   2022    3.6    2.6            NGEU, accumulated savings.
France                                  February   2022    3.6    2.1
Italy                                   February   2022    4.1    2.3
Source: European Commission.

                                                                                                                     11
Economic growth in 2022 will be driven by higher household
consumption and investment.
                                            Domestic demand will
                                             have a large contribution
                                             to the GDP growth in
                                             2022 because of the
                                             recovery of household
                                             spending and the boost
                                             in gross capital
                                             formation.

                                            In 2022, the growth of
                                             gross capital formation
                                             will be even more
                                             noticeable because of
                                             the Next Generation EU
                                             funds.

                                            External trade balance
                                             will have a positive and
                                             higher contribution in
                                             2022, as tourism
                                             recovery gains traction.
                                                                  12
The Catalan economy will recover pre-pandemic level of GDP
 by the second half of 2022
   GDP in volume in Catalonia, Spain, and the euro area                     GDP in volume in Catalonia (2019=100)
  (2019Q4=100)

105                                                                         110

100                                                                         105

95
                                                                            100
90
                                                                             95
85

80                                                                           90

75
                                                                             85
       IV    I         II      III    IV        I      II        III   IV
                                                                                  2014 2015 2016 2017 2018 2019 2020 2021 2022 2023
      2019 2020                               2021
       Catalonia            Spain          Euro area
                                                                                   PreCOVID Forecasts (Ministry of the Economy and Finance)
  Source: elaboration based on Idescat, INE and Eurostat data.                     October 2021 Forecasts (Ministry of the Economy and Finance)
                                                                                   GDP
                                                                             Note: pre-COVID forecasts were released in the April 2020 outlook using
                                                                             economic data up to 2019.
                                                                             Source: elaboration from Idescat and Ministry of the Economy and Finance.

                                                                                                                                                 13
Industry and
services
Industry returns to a positive dynamics despite global
bottlenecks
Industrial Production Index (IPI)*                                     Industrial Production Index. 2021
(annual percentage change of 3-month moving average)                   (percentage change compared 2019 and 2020)

6
                                                                                                                 Other non-metallic mineral
4                                                                                                                Pharmaceutical
                                                                                                                 Chemicals
                                                                                                                 Electronic, optical and electrical
2                                                                                                                Mining and quarrying
                                                                                                                 Rubber and plastic
0                                                                                                                Food, beverages and tobacco
                                                                                                                 Metal manufactures
-2                                                                                                               Machinery and equipment
      Euro Germany Spain                France           Italy   CAT                                             Manufacturing
       area
      2021Q3   2021Q4                                                                                            Total IPI

                                                                                                                 Paper and printing
*Calendar adjusted data, not seasonally adjusted data.                                                           Water treatment and supply
Source: Eurostat and Idescat.                                                                                    Other manufactures
                                                                                                                 Energy supply
                                                                                                                 Textiles and leather
 Industrial production has grown by 8.7 %                                                                       Motor vehicles and transport
  compared to 2020, despite supply disruptions.
                                                                       -30     -20   -10      0   10   20   30
 Pharmaceutical and non-metallic mineral
  manufactures have grown notably. Motor
                                                                             2021 compared to 2020      2021 compared to 2019
  vehicles and transport have been affected
  by supply disruptions.                                                *Not adjusted data.
                                                                        Source: Idescat.

                                                                                                                                         15
Domestic tourism becomes a pillar of the sector in 2021,
awaiting for a stronger recovery of foreign tourism
               Tourism indicators of Catalonia
                                          % change   % change
                                                                     % of total
                                         2021/2020   2021/2019
               Hotel overnight stays       Q4 2021      Q4 2021   Q4 2021   Q4 2019
               Total overnight stays        416.9         -31.8         -            -
                from Catalonia              161.5           4.9      23.5         15.3
                from the rest of Spain      280.5          -5.2      16.7         12.0
                from abroad                 897.8         -43.8      59.9         72.8
               Foreign tourism
               Tourists                     421.2         -45.7         -            -
               Spending                     586.5         -53.4         -            -
               Source: Idescat.

   Tourism records were unprecedentedly weak in 2020, especially for international arrivals,
    which fell by 80% in Catalonia as a consequence of tight mobility restrictions.
   In the second half of 2021, internal tourism flows have rebounded, both from residents in
    Catalonia and the rest of Spain. Hotel overnight stays from Catalans in 2021Q4 exceed by
    4.9% those of 2019Q4.
   Foreign tourism improvement is slower, foreign tourists in 2021Q4 are still 45.7% lower
    than in 2019Q4. While their associate spending is 53.4 lower.
   According to card payment data from BBVA, city destinations like Barcelona are encountering
    a more challenging recovery of tourism spending.

                                                                                                  16
Most experts believe international tourism won’t recover its
 pre-pandemic levels before 2024 in Europe
When is international tourism expected to rebound in            When is international tourism expected to return to pre-
Europe? (% of survey respondents)                               pandemic 2019 levels in Europe? (% of survey respondents)
60%                                                             70%                                                64%
                                                          50%
50%                                                             60%

                                  38%                           50%
40%
                                                                40%
30%                                                                                             32%
                                                                30%
20%
                     13%                                        20%

10%                                                             10%           4%
          0%                                   0%
 0%                                                              0%
      by Q1 2022 by Q2 2022 by Q3 2022 by Q4 2022 by 2023 or                 2022               2023           2024 or later
                                                     later
  Source: UNWTO Panel of Experts survey (January 2022).

  The recovery outlook of the tourist sector still faces uncertainties. The emergence of the Omicron
   variant is threatening the recovery of tourism flows, especially in international tourism.
  According to the January 2022 ExcelTUR survey, 36.6% of experts think tourism will be back to
   pre-pandemic levels in 2022 in Catalonia, while the most popular opinion is that pre-
   pandemic levels will be back in 2023 (57.8% of experts). These prospects are more optimistic
   than those of the UNWTO Panel for all Europe.

                                                                                                                               17
Foreign
  Trade
and FDI
The increase in the propensity to export to global markets
represents a structural change in the last decade
External balance of goods and services in Catalonia (percentage of GDP)
15

12                                                                                                         12,3

 9
                                                                                                       6,0 6,3
 6

 3

 0

-3

-6
     2000 2001 2002 2003 2004 2005 2006 2007 2008 2009 2010 2011 2012 2013 2014 2015 2016 2017 2018 2019 2020
        Foreign balance       Balance with Spain        External balance
Source: Idescat.

 Since 2009, the export capacity of the economy has increased significantly. In 2020, amidst
  negative shock in global trade, Catalan exports of goods and services fell by 22.6%.
 Foreign contribution to the external balance of the Catalan economy has fallen from 8.9pp to 6pp
  due to the interruption of tourism.
 The trade surplus with Spain is maintained in parallel with an increasing orientation of Catalan
  exports to international markets since 2009.

                                                                                                                  19
A very powerful exporting sector in the European framework
  External balance of goods and services, 2020 (% of GDP)

  40 38,7
  35
            29,9
  30
  25
  20
  15           12,3 10,7
  10                                        5,8
                                                   4.0
   5                                                        1,6
   0
  -5                                                                           -2,3
                                                                                        -7,5 -8,9
 -10

Source: Idescat and Eurostat.

   Catalonia has the 3rd highest foreign balance among EU countries (12.3%), only behind
    Luxembourg (38.7%) and Ireland (29.9%) and ahead of exporting powers such as the Netherlands
    (10.7%) or Germany (5.8%).
   In 2020, trade flows have fallen more intensely than GDP. Exports of goods and services abroad
    have diminished by 22.6%, while imports have been reduced by 18.3%.
   The external balance gives a high capacity of financing in global markets.

                                                                                                     20
Catalan exports of goods grow remarkably and in 2021
exceed pre-pandemic levels
Evolution of exports of goods in Catalonia            Evolution of exports of goods in Catalonia and selected
(million euros)                                       countries / areas (% of annual change in volume)
87.500                                                18
                                                      14
75.000
                                                      10

62.500                                                6
                                                      2
50.000                                                -2
                                                      -6
37.500
                                                     -10
                                                               2018            2019            2020             2021
25.000                                                             Catalonia           World exports           Euro area
                                                      Note: The actual growth data of Catalonia is obtained by an
                                                      approximation of the deflator's value of Spain's exports of goods.
Source: Idescat.                                      Source: CPB, INE and Idescat.

  Exports of goods show an annual change of 21.5% in 2021 in current values, slightly higher
   than the annual growth of imports (+19.5%). Moreover, in 2021 exports are already 9.0% higher
   than in 2019 and points to a new historical maximum, while imports remain a little bit lower
   (-2.2% with respect to 2019).
  In real terms, exports of goods in Catalonia grew by 12.6% in 2021, above the growth of the euro
   area’s (8.9%) and the world’s exports growth (9.8%).

                                                                                                                           21
The recovery of exports in 2021 is widespread across
 branches
  Exports of goods by industry
  (contribution to annual percentage change)                               Export dynamics were positive
25                                                                          among most branches in the last
                                                                            years. However, 2020 reduced
20
                                                                            international trade severely (exports
15                                                                          decreased by 10.3% in Catalonia).
10
                                                                            The most negative contributions
                                                                            corresponded to the energy sector and
 5                                                                          the equipment goods sector (both -2.8
 0                                                                          pp), while the auto industry detracted
                                                                            2.0 pp. Only the food sector showed a
 -5
                                                                            positive contribution.
-10
                                                                           2021 shows a widespread recovery
-15
         2017            2018         2019            2020         2021
                                                                            (21.5%). The main contributions to
                                                                            growth correspond to semi-
       Consumption goods                       Automobile
       Equipment goods                         Semi-manufactures
                                                                            manufactures (8.7 pp), including
       Energy products and Raw materials       Food                         pharma and chemicals, while
       Total (y-o-y % growth)                                               equipment goods contributes with
  Source: Idescat and AEAT.                                                 4.0 pp.

                                                                                                                     22
High-tech exports performed very well in 2021 and achieve
all-time records
High-tech manufacturing exports                          High-tech manufacturing exports
(% over total exports)                                   (% of annual change in current values)
15                                                      20

13
                                                        15
11
                                                        10
 9

 7                                                      5

 5
          2018       2019         2020           2021   0
                                                                2018          2019           2020     2021
                   Catalonia             Spain           Source: Idescat.
Source: Idescat.

 Exports of goods with high technological               Exports of industrial products by technology level
  content rebounded strongly in 2021 (+8.3%              (2019=100)
  of annual growth), representing 12.8% of                                        2018    2019    2020    2021
  industrial product’s exports.                          High                      84.6     100 104.0 111.8
                                                         Middle-high              102.4     100    86.2 107.3
 In 2021 high-tech exports reached the                  Middle-low                93.6     100    80.1 104.8
  highest value in the historical series, which          Low                       92.5     100    95.8 112.3
  began in 1998.                                         Total industrial prod.    96.2     100    90.1 108.9
                                                         Source: Idescat
                                                                                                                 23
Chemical products and equipment goods are the largest
exporting sectors
Exports by activity branches. 2021                         Imports by activity branches. 2021
(percentage of total)                                      (percentage of total)

 Source: Idescat.

  Catalan exports account for 25.4% of all Spanish exports, while Catalan imports account
   for 26.5%.
  The chemical sector accounts for 27.2% of Catalan exports and 24.3% of imports. Its weight
   in Spain as a whole is 44.1% in the case of exports and 37.5% in the case of imports.
  Exports of machinery and equipment and the automotive sector also have a large weight in
   Catalan exports.

                                                                                                24
The export base of the Catalan economy widened between
2011 and 2019, and followed an upward trend in 2021
Number of regular and non-regular exporting companies*

8.000
7.000
6.000
5.000
4.000
3.000
2.000
1.000
    0
         2008     2009    2010          2011      2012   2013   2014   2015   2016   2017   2018   2019   2020   2021
 Regular exporting companies
 Non-regular exporting companies

*Companies exporting less than 50,000€ are excluded.
Source: ICEX.

 During 2014-2021, the number of regular exporting companies grew by 8,3 %. In 2020
  there is a slight decrease due to the pandemic. Out of the 13,243 exporting companies in
  2021, 7.551 have exported regularly a worth of at least 50,000 euros.
 Regular exporting companies with an exported value over 5 M€ followed an upward trend in
  2021, reaching a total number of 1,266 companies; that is, a 42 % accumulated growth rate
  since 2011.

                                                                                                                        25
Foreign Direct Investment inflows peaked in the period
2016-2020 with respect to the previous 5 years
Foreign direct investment in Catalonia (millions of euros)
5.000                                                                            In the last 5 years, Catalonia has received an
4.000                                                                             average annual FDI inflows over 4,500 M€,
3.000                                                                             26% more than in the previous 5 years.
2.000                                                                            FDI Markets (Financial Times) places
1.000                                                                             Catalonia as the region with the best FDI
    0                                                                             strategy in Europe in 2022 and 2023.
                                                                                 In 2020, FDI flows shrunk globally by 42%
                                                                                  according to UNCTAD, while in Catalonia, FDI
9.000                                                                             inflows registered by the Ministry of Industry
                                                                                  decreased by 18.9%. 2021 data until
6.000
                                                                                  September show an annual increase of
                                                                                  3.3%, totaling more than 1.900 M€.

3.000
                                                                                 Featured foreign investments in 2020-2021:
                                                                                  PepsiCo's global digital hub, Microsoft's R&D
                                                                                  hub specializing in AI, Singapore's European
   0                                                                              technology office TDCX and the Decathlon
        1995       2000         2005         2010         2015          2020
                                                                                  logistics center.
 Note: FDI statistics show strong volatility and it is recommended to analyze
 the evolution over longer periods.                                              In 2021 Barcelona is the 5th best ecosystem
 Source: Ministry of Industry, Trade and Tourism.                                 in the EU for creating a startup, and the 4th
                                                                                  hub in the EU in terms of rounds of funding
                                                                                  raised for startups in venture capital.
                                                                                                                              26
Business
dynamics
Sustained growth of active companies since 2014 and until
the COVID-19 pandemic negative impact
Number of companies in Catalonia
(thousands)                                                                         Many companies closed as a consequence
 645
                                                                                     of the global financial crisis. However,
                                                                                     this trend had been reversed in the
 635                                                                                 recovery period 2014-2019.
 625
                                                                                    Since 2014, there had been a net
 615                                                                                 recovery in the number of active
 605
                                                                                     companies. One of the key challenges to
                                                                                     gain competitiveness is increasing its size.
 595
                                                                                    During 2020, the total number of
 585
                                                                                     companies and those with their registered
 575                                                                                 office in Catalonia decreased 1.1.%, at the
          2015      2016      2017       2018      2019      2020      2021
                                                                                     same rate as the Spanish economy. The
       Total        With head office                                                 greatest drops have been experienced by
                                                                                     small and medium enterprises, and those
*At 1st January of each year.
**The concept of the company as a statistical unit has changed for data with the     sectors affected more intensively by the
reference date 1 January 2019. Consequently, the results from this year are not      restrictions.
strictly comparable with those of previous years.
Source: Idescat and INE.

                                                                                                                               28
Business dynamism rebounds sharply in 2021, after 2020 drop

  Creation and dissolution of mercantile companies in Catalonia*     Net creation of mercantile companies
  (thousands)                                                        (thousands)

  25                                                                  20
                                                                      18
  20                                                                  16
                                                                      14
  15
                                                                      12
  10                                                                  10
                                                                       8
   5                                                                   6
                                                                       4
   0
                                                                       2
  -5                                                                   0
       2010 2011 2012 2013 2014 2015 2016 2017 2018 2019 2020 2021         2012   2013   2014   2015   2016   2017   2018   2019   2020   2021

          Creation           Dissolution           Net creation             Catalunya        Madrid

   *Dissolved companies are indicated in negative number.               Source: INE, from Central Business Register.
   Source: Idescat, from Central Business Register.

 Overall, the creation of mercantile companies showed a positive trend until 2019, with a peak in 2016.
  COVID-19 slowed down the dynamism of previous years due to economic uncertainties and difficulties
  in carrying out administrative procedures,. as severe restrictions were imposed.
 Net creation of mercantile companies in 2021 is the highest since 2017, showing the strong
  recovery of the business sector.

                                                                                                                                            29
Labour
market
Moderate impact in the labour market compared to other
recessions
Social Security affiliations                                                  Social Security affiliations and employees in temporary lay-off
(annual percentage change)                                                    procedures
6                                                                             3.600.000

4                                                                             3.400.000
                                                            3.0         2.7
                                                                  2.4
2                                                                             3.200.000

0                                                                             3.000.000

-2                                                                            2.800.000
                                                                    -2.6
-4                                                                            2.600.000
                                                                                       Jan.       July       Jan.    July    Jan.    July     Jan.
-6                                                                                     2019                 2020             2021             2022
                                                                                        Affiliates in lay-off procedures (ERTO)
-8                                                                                      Affiliations excluding workers in ERTO
     2003 2005 2007 2009 2011 2013 2015 2017 2019 2021                                  Total affiliations
 Source: Ministry of Inclusion, Social Security and Migration.                  Source: Spanish Ministry of Inclusion, Social Security and Migrations.

  During the health crisis, the use of temporary lay-off schemes (ERTE) has allowed
   employment to fall much less than in other recessions. In 2020, Social Security affiliations
   decreased by 2.6% and LFS employment decreased by 3.0%. People affected by temporary lay-off
   schemes are not included in the unemployed population.
  During 2021, labour market has recorded a very positive evolution: affiliations increased by 2.7%,
   LFS employment by 3.2%, and people in ERTE have been declining gradually.

                                                                                                                                                     31
Unemployment rate has reached the lowest figure since 2008
 Employment evolution compared to pre-pandemic situation                     Unemployment rate
 (100 = 2019Q4)                                                              (% unemployed / active population)
105                                                                          30
100
                                                                             25
 95

 90                                                                          20

 85                                                                          15
 80
                                                                             10                                                    10,2
 75

 70                                                                           5
   Q4     Q1     Q2     Q3       Q4      Q1     Q2       Q3          Q4
  2019   2020                           2021                                  0
      Employment    Total hours of work     Social Security Affiliation

 Note: the index of the working hours in each quarter is calculated as the
 index with respect to the corresponding quarter in 2019.                          Catalonia        Spain         Euro area
 Source: own elaboration with data from Idescat and Spanish Ministry of
 Inclusion, Social Security and Migrations                                   Source: Idescat, INE and Eurostat.

   The economic recovery during 2021 has allowed to return to pre-pandemic levels of
    employment.
   Unemployment rate in 2021Q4 has decreased to 10.2%, the lowest rate since 2008.
   The increase in the unemployment has hit particularly young people (the unemployment rate of
    16 to 24 years old is 27.3% in 2021Q4, well above euro area figures).

                                                                                                                              32
Prices
Bottlenecks and rising energy prices push up inflation rate

Contribution of components to inflation
(percentage points)
                                                                Inflation at the end of January 2022 hit an
                                                                 annual 5.9%, one of the highest rates
7,0
                                                                 since 1992. The rise in inflation is mainly
6,0
5,0
                                                                 due to higher energy prices and bottlenecks
4,0                                                              in the supply chains.
3,0                                                             Underlying inflation is gradually rising
2,0                                                              (2.3% y-o-y), probably due to pressure on
 1,0                                                             production costs. Second-round effects
 0,0                                                             are still limited, as shown by agreed salary
-1,0
                                                                 increases in collective agreements (2.32% in
-2,0
                                                                 January).
-3,0
   Jan.         Jan.         Jan.         Jan.   Jan.   Jan.    However, recent geopolitical tensions are
   2017         2018         2019         2020   2021   2022
                                                                 pushing up energy –especially gas- and
        Core inflation (Percentage points)                       other commodity prices, leading to a
        Energy (percentage points)                               global supply shock. These factors may end
        Unprocessed food (percentage points)
                                                                 up increasing the annual inflation rate and
        ICP (y-o-y % growth)
                                                                 could delay consumption and investment
 Source: own elaboration with data from INE.                     recovery.
                                                                There are also structural factors such as the
                                                                 energy transition that represent an upward
                                                                 pressure for inflation (supply inflation).
                                                                                                                 34
Appendix:
International
    rankings
Catalonia and Barcelona, well positioned
European           European           Global Power   European          Global Cities   The World
cities and         regions and        City Index     Attractiveness    Investment      Best Cities
regions of the     cities of the      2021           Survey 2019       Monitor 2020    2021
future             future 2022/2023   The Mori       EY                KPMG            Resonance
2022/2023          FDI Magazine       Memorial                                         Consultancy
FDI Magazine                          Foundation

Top 10 of large  Top 10 of major                                       Number of
European regions European cities –    European       Most attractive   international   Top 10 Best
– FDI Strategy                        ranking        European cities   greenfield      Cities
                 FDI Strategy
                                                     for foreign       investments     1 London
                                                     investors         (2018)          2 New York
1 Catalonia        1 Barcelona        1 London       1 Paris           1 London        3 Paris
2 North Rhine-     2 Milan            2 Paris        2 London          2 Paris         4 Moscow
Westphalia         3 Berlin           3 Amsterdam    3 Berlin          3 Singapore     5 Tokyo
3 Flanders         4 Munich           4 Berlin       4 Frankfurt       4 Dubai         6 Dubai
4 Madrid           5 Moscow           5 Madrid       5 Amsterdam       5 Shanghai      7 Singapore
5 Paris Region     6 London           6 Copenhagen   6 Munich          6 New York      8 Barcelona
6 Silesia Region   7 Sofia            7 Barcelona    7 Madrid          7 Hong Kong     9 Los Angeles
7 Emilia-Romagna   8 Budapest         8 Vienna       8 Warsaw          8 Barcelona     10 Madrid
7Lombardy          9 Amsterdam        9 Zurich       9 Barcelona
                                      10 Stockholm                     9 Madrid
9 Frankfurt        10 Tbilisi                        10 Brussels       10 Tokyo

                                                                                                 36
Barcelona, a European city of reference in innovation
Innovation Cities    Smart cities in the   The Future is       Tech Cities of the     Tech cities index
Index 2021           World 2017            coming: Index of    Future 2020/2021       2019
Innovation Cities    Juniper Research      Cities’ Readiness   FDI Magazine           Savills UK
Program, 2thinknow                         PwC

                                                               Top 10 Tech Cities –
European ranking                                               FDI Performance
                     1 Singapore           1 Singapore                                European ranking
1 Paris                                                        1 London
                     2 London              2 London
2 London                                                       2 Dublin
                     3 New York            3 Shanghai                                 1 London
3 Stockholm                                                    3 Paris
                     4 San Francisco       4 Barcelona                                2 Amsterdam
4 Vienna                                                       4 Amsterdam
                     5 Chicago             5 Moscow                                   3 Stockholm
5 Amsterdam          6 Seoul                                   5 Barcelona            4 Copenhagen
6 Oslo                                     6 New York          6 Berlin
                     7 Berlin              7 Toronto                                  5 Paris
7 Berlin             8 Tokyo                                   7 Madrid
                                           8 Tokyo                                    6 Berlin
8 Istanbul                                                     8 Belfast
                     9 Barcelona           9 Hong Kong                                7 Dublin
9 Moscow                                                       9 Vilnius
                     10 Melbourne          10 Sydney                                  8 Barcelona
10 Munich (…)                                                  10 Bucharest

13 Barcelona

                                                                                                     37
Barcelona is consolidating as a European technological hub
EU-Start-Ups         Digital Startup           Digital Startup           Startup Heatmap         Startup
2020                 Ecosystem                 Ecosystem                 Europe 2021             Ecosystem
                     Overview 2019             Overview 2019             European Startup        Rankings 2020
                     BMWCapital (Source:       BMWCapital (Source:       Initiative              Startup Blink
                     StartupHeatMap, Atomico   StartupHeatMap, Atomico
                     and Dealroom)             and Dealroom)

Top 10 of Europe’s                                                       Top 10 of hubs
biggest startup                                                          preferred by startup
                     Top 10 of European        Top 10 of the
hubs                                                                     creators in the case
                     technology hubs by        European
                                                                         of starting a project   Top 10 of European
                     number of startups        technological hubs
1 London                                                                 again                   cities
                                               by volume of
2 Berlin
                     1 London                  European investment
3 Paris                                                                  1 London                1 London
4 Amsterdam          2 Paris                   1 London                  2 Berlin                2 Berlin
5 Barcelona          3 Berlin                  2 Paris                                           3 Moscow
                                                                         3 Barcelona
6 Munich             4 Amsterdam               3 Berlin                                          4 Paris
                                                                         3 Amsterdam
7 Madrid             5 Madrid                  4 Stockholm                                       5 Amsterdam
                                                                         5 Munich
8 Stockholm          6 Barcelona               5 Barcelona               6 Lisbon                6 Barcelona
9 Dublin             7 Stockholm               6 Hamburg                                         7 Stockholm
                                                                         7 Paris
10 Milan             8 Dublin                  7 Munich                  8 Zurich                8 Kyiv
                     9 Helsinki                8 Cambridge               9 Tallinn               9 Madrid
                     10 Copenhagen             9 Amsterdam                                       10 Munich
                                                                         10 Stockholm
                                               10 Lisbon

                                                                                                                 38
Other international rankings
Statistical        Main             MBA City             Global MBA Ranking         QS University
Report 2019        European         Monitor 2017         2022                       Ranking
International      airports by      ESADE                Financial Times            Top 50 under 50, 2021
congress and       volume of                                                        (universities which are
conventions                                                                         under 50 years old)
                   passengers
association
                   2020             Top 10 cities to
                   ACI Europe       attract                                         1 Nanyang Technological
                                    international        1 Wharton                  University, Singapore
                                    talent to study an   2 Columbia Business School (NTU)
                                    MBA                  3 Insead                   2 The Hong Kong
Number of
                                                         3 Harvard Business School University of Science and
participants                        1 Boston             5 Kellogg School of        Technology
1 Barcelona                         2 New York
                   1 Istanbul                            Management                 3 KAIST - Korea Advanced
2 Paris                             3 London
                   2 Paris CDG                           6 Stanford Graduate School Institute of Science &
3 Madrid                            4 Paris
                   3 London                              of Business                Technology
4 Lisbon                            5 Chicago
                   Heathrow                              7 Univ. of Chicago: Booth  4 Université PSL
5 Vienna                            6 Toronto,
                   4 Amsterdam                           8 London Business School   5 City University of Hong
Number of events                    Barcelona            9 Yale School of           Kong (…)
                   5 Moscow SVO     8 San Francisco -
1 Paris                                                  Management
                   6 Frankfurt      Silicon Valley                               28 Universitat Pompeu
2 Lisbon                                                 10 Iese Business School
                   7 Madrid         9 Route 40 North                             Fabra (…)
3 Berlin                                                 (…)
                   8 Istanbul SAW   Carolina                                     36 Universitat
4 Barcelona        9 Moscow DME
5 Madrid                            10 Singapore,         34 Esade Business      Politècnica de
                   10 Barcelona     Philadelphia         School                  Catalunya

                                                                                                              39
Edited by the Directorate-General for Economic Analysis and
                            Foresight

Website on the Catalan Economy of the Ministry of the Economy
                        and Finance

           http://economia.gencat.cat/

            Last update: March 2022
You can also read