Carlyle Apartment Homes - 436 Unit Value-Add in Shawnee (Kansas City), KS - Avid Realty Partners
←
→
Page content transcription
If your browser does not render page correctly, please read the page content below

Carlyle Apartment Homes
436 Unit Value-Add in Shawnee (Kansas City), KS

                                          www.AgileRealtyCapital.com
                                          www.SummitRoadCapital.com

                                               Craig Berger, CFA CPA
                                               David Cummings, CFP
                                                    Dallas Bligh
                                                    Mark Kuster
                                                  Scott Rosenthal

                                                   February 13, 2017

       Summit Road Capital LLC: Confidential, Do Not Forward
Summit Road Capital LLC: Disclaimer
This presentation has been prepared by Summit Road Capital LLC.
The information contained in this presentation is for informational purposes only.
The information contained in this presentation is not investment or financial product advice and is not intended
to be used as the basis for making an investment decision. This presentation has been prepared without taking
into account the investment objectives, financial situation or particular needs of any particular person. Past
performance is no guarantee of future performance.
No representation or warranty, express or implied, is made as to the fairness, accuracy, completeness or
correctness of the information, opinions and conclusions contained in this presentation. A number of statements
in this presentation have been based on internal estimates by Summit Road Capital LLC and have not been
independently verified. To the maximum extent permitted by law, none of Summit Road Capital LLC or its
directors, employees, managers, members, or agents, nor any other person accepts any liability, including,
without limitation, any liability arising out of fault or negligence, for any loss arising from the use of the
information contained in this presentation. In particular, no representation or warranty, express or implied, is
given as to the accuracy, completeness or correctness, likelihood of achievement or reasonableness of any
forecasts, prospects or returns contained in this presentation. Such forecasts, prospects or returns are by their
nature subject to significant uncertainties and contingencies. Actual future events may vary from these forecasts
and you are cautioned not to place undue reliance on any forward looking statement.
The statements in this presentation are made only as at the date of this presentation unless otherwise stated and
remain subject to change without notice. None of Summit Road Capital LLC or its directors, employees,
managers, members, or agents, nor any other person accepts any obligation to correct or update information in
this presentation.

                         Summit Road Capital LLC: Confidential, Do Not Forward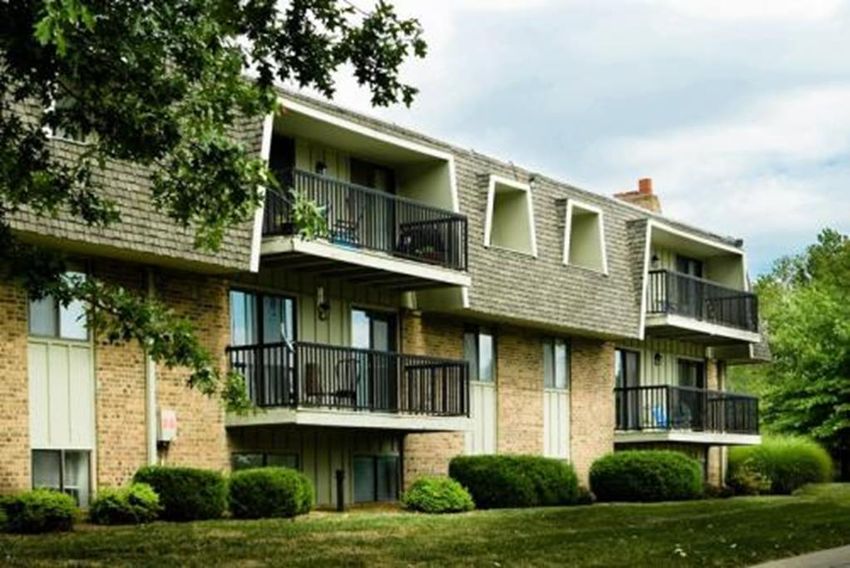
Carlyle Apartment Homes: Property Summary
                                                                   •   Address: 7530 Cody St., Shawnee, KS
                                                                   •   436 Units over 31.74 Acres
                                                                   •   Year Built: 1971
                                                                   •   Rentable Area: 349,611 SF
                                                                   •   Avg. Unit Size: 802 SF
                                                                   •   Avg. Market Rent: $698 or $0.87 per Sq Ft
                                                                   •   Occupancy: 95%

           Summit Road Capital LLC: Confidential, Do Not Forward
Carlyle Apartment Homes: Unit Mix and Amenities
  Unit Type
                   Unit       Square    Total Rentable
                                                         Mix %    Property Amenities
                  Count        Feet        Sq. Feet
STUDIO              10            517          5,170     2.29%
                                                                  • Pool
1BR/1BA            133            626         83,258     30.50%   • Playground
2BR/1BA            132            835        110,220     30.28%   • Fitness Center
2BR/1.5BA           76            879         66,804     17.43%   • On-Site Laundry Facilities
2BR/2BA             60            934         56,040     13.76%   • On-Site Maintenance
2BR/2BA              1          1,143          1,143     0.23%
3BR/2BA             24          1,124         26,976     5.50%
TOTAL/AVG          436         802           349,611     100%

• Carlyle Apartment homes is a quality property with
  scale, in an attractive MSA.
• In-place rents are far below market.
• Amenity rich property
• Much opportunity to eliminate loss to lease as well as
  substantially reduce operating expense.

         Summit Road Capital LLC: Confidential, Do Not Forward
Carlyle Apartment Homes: Background & Pictures

                     Summit Road Capital LLC: Confidential, Do Not Forward
Carlyle Apartment Homes: Background & Pictures

      Old Kitchen                                            Renovated Kitchen

                Summit Road Capital, LLC: Confidential, Do Not Forward
Carlyle Apartment Homes: Background & Pictures
                                                                Broker Notes:
                                                                • Owned by Seller since 1991
                                                                • Good location in top suburban sub-
                                                                  market; good schools w/ middle
                                                                  school across the street
                                                                • Roofs have been redone except for
                                                                  four roofs; Paint job is due since
                                                                  painted 5 years ago; Clubhouse could
                                                                  use some modernizing
                                                                • Rents are too low by about $75-$100
                                                                  with no Renovations, and by $140 per
                                                                  unit with Renos, maybe more.
                                                                • Tours starting around 2/1 and bid date
                                                                  is week of 2/20.
                                                                • Land trades for $10-$12K per door, but
                                                                  this has no frontage so maybe $5K per
                                                                  door. Build some townhomes or 2s/3s
                                                                  given good schools across the Street;
                                                                  Add off leash dog park or frisbee park;
                                                                  land zoned cb2 = 17-19 units per acre.

              Summit Road Capital, LLC: Confidential, Do Not Forward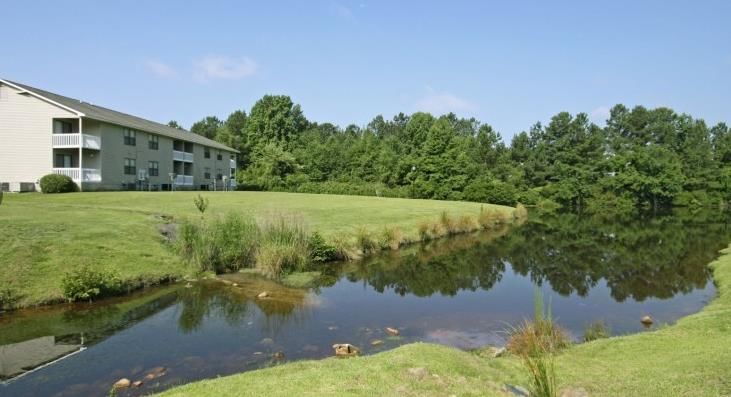
Carlyle Apartments: Kansas City, KS Overview
                                                     • Best Cities for Entrepreneurs - Entrepreneur,
                                                       2016
                                                     • Top 10 Cities for Creatives – Smart Asset, 2016
                                                     • Best Starter Cities for College Grads. – Truila &
                                                       LinkedIn, 2015
                                                     • Top City for Startups – Inc., 2015
                                                     • #1 High-Tech City to Call Home – PC
                                                       Magazine, 2014
                                                     • Hot Startup Hubs - SpareFoot, 2014
                                                     •   Most Attractive Cities for Millennials – The
                                                         Brookings Institution, 2014
                                                     • Top 10 Cities for Young Job Seekers – Business
                                                       Insider, 2013

            Many Good Things are Happening Here!

              Summit Road Capital LLC: Confidential, Do Not Forward
Carlyle Apartment Homes: Key Demographics

                                                             Summit Road Capital, LLC:
Source: http://www.city-data.com/city/Shawnee-Kansas.html   Confidential, Do Not Forward
Carlyle Apartment Homes: Key Demographics

                                                   Summit Road Capital, LLC:
                                                     Confidential, Do Not
                                                           Forward

Source: http://www.city-data.com/city/Shawnee-Kansas.html
Carlyle Apartment Homes: Key Demographics
Summit Road Capital, LLC:
Source: http://www.city-data.com/city/Shawnee-Kansas.html Confidential, Do Not ForwardCarlyle Apartments: Rent Comps Show Upside
One Bedroom Rental Comps. Two Bedroom Rental Comps.
Year Size Average Market Rent Year Size Average Market Rent
Property Property
Built Sq. Feet Market Rent per Sq Ft Built Sq. Feet Market Rent per Sq Ft
Arbor Square 1971 808 $ 668 $ 0.83 Arbor Square 1971 1,000 $ 785 $ 0.79
Lenexa Pointe 1972 720 $ 640 $ 0.89 Lenexa Pointe 1972 928 $ 705 $ 0.76
Louisburg Square 1965 818 $ 751 $ 0.92 Louisburg Square 1965 1,078 $ 957 $ 0.89
The Meadows 1979 748 $ 687 $ 0.92 The Meadows 1979 911 $ 731 $ 0.80
Fox Run 1972 711 $ 668 $ 0.94 Fox Run 1972 1,029 $ 775 $ 0.75
Carlyle 1971 626 $ 587 $ 0.94 Carlyle 1971 871 $ 670 $ 0.77
TOTAL/AVG 1972 739 $ 683 $ 0.90 TOTAL/AVG 1972 970 $ 791 $ 0.80
Three Bedroom Rental Comps.
Year Size Average Market Rent
Property
Built Sq. Feet Market Rent per Sq Ft
Arbor Square 1971 1,200 $ 925 $ 0.77
Louisburg Square 1965 1,528 $ 1,164 $ 0.76
The Meadows 1979 1,273 $ 984 $ 0.77
Carlyle 1971 1,124 $ 803 $ 0.71
TOTAL/AVG 436 1,281 $ 1,024 $ 0.77
Source: Summit Road Capital Summit Road Capital, LLC: Confidential, Do Not ForwardCarlyle Apartment Homes: Transaction Summary Data
Transaction Summary ($US) - Carlyle Apartments Project Debt & Equity Details:
Lot Square Footage 31.74 acres Preferred Equity Interest Rate Paid 8.0% Acquisition Assumptions
Number of Keys / Rooms 436 GP/Sponsor Promote 30.0%
Average Square Feet Per Room 802 sq. ft. Equity Investor Economics 70.0% • Purchase price: $27.5M
Total Livable Square Footage 349,672 sq. ft.
• Rent escalation: $634 per Unit in 2016
Total Project Equity Invested 7,600,000 Deal Sponsor Equity % 2.2%
Total Project Debt Taken On 23,150,000 Institutional Equity % 22.6% rising to $907per Unit in 2021
As of 18-Jan-17 Senior Debt % 75.3%
Acquisition Details: Carlyle Apartments Disposition Details:
Net Cash Flow at Purchase (w/ Capex) 1,414,332 Net Cash Flow at Sale (w/ Capex) 2,724,237 Debt Assumptions
Baseline Purchase Cap Rate 5.3% Project Exit Cap Rate 7.5%
Purchase Price 26,500,000 Sale Price 36,323,166
• LTV: 70%
Fees, Diligence Costs, Loan Origination 1,192,500 Selling Costs (1,271,311)
All Renovations 2,600,000
• Coupon: 5.25%
Safety Capital & Cushion 457,500
Total Uses of Funds 30,750,000 Gross Sale Proceeds 35,051,855
• Term: 25 years
First & Second Lien Debt Taken On (23,150,000) Pay Off Debt Principal (20,865,520)
Net Equity Brought to Project 7,600,000 Net Project Sale Proceeds 14,186,335
Purchase Price Per Key $60,780 Sale Price Per Key $83,310
Total Project Cost Per Key $69,478 Net Proceeds Per Key $32,537 This deal meets our 18% total project
Investor Return Metrics: Carlyle Apartments IRR hurdle with reasonable resale price
Baseline Scenario Downside #1 Scenario and exit cap-rate assumptions.
Project Exit Cap Rate 7.5% Project Exit Cap Rate 8.0%
Cash on Cash Return: Equity Investors 2.21 x Cash on Cash Return: Equity Investors 1.50 x
Cash on Cash Return: Total Project (w/ Sponsor 2.52
Equity)
x Cash on Cash Return: Total Project (w/ Sponsor
1.50Equity)
x
IRR: Equity Investors 16.2% IRR: Equity Investors 8.2%
IRR: Total Project (w/ Sponsor Equity) 18.9% IRR: Total Project (w/ Sponsor Equity) 8.3%
Source: Summit Road Capital Summit Road Capital, LLC: Confidential, Do Not ForwardCarlyle Apartments: Sources & Uses of Cash
Sources and Uses of Cash ($) - Carlyle Apartments Debt Service Test
Loan Amount 23,150,000
Sources of Funds Amount Percent Uses of Funds Amount Percent
Amortization 30
GP/Sponsor Equity 662,500 2.2% Purchase Price 26,500,000 86.2%
Rate 5.25%
Investor Equity 8,262,500 26.9% Closing Costs: Legal, Fees, Taxes 530,000 1.7%
Payment Annual (1,549,127)
Senior Debt 21,825,000 71.0% Financing & Loan Fees 662,500 2.2%
Dec-15 Actual DSCR 1.01
Mezzanine 0 0.0% Room Renovation Spends 1,744,000 5.7%
Other 0 0.0% Property Renovation Spends 856,000 2.8%
2016 DSCR Projected 1.18
Working Capital / Safety Cushion 457,500 1.5% 2017 DSCR Projected 1.34
2018 DSCR Projected 1.51
Total Sources 30,750,000 100.0% Total Uses 30,750,000 100.0% 2019 DSCR Projected 1.69
Source: Summit Road Capital 2020 DSCR Projected 1.80
2021 DSCR Projected 1.89
Summit Road Capital LLC: Confidential, Do Not ForwardCarlyle Apartments: Comes with 9 Acres of Land!!
• As a bonus, this property comes with 9 Acres of undeveloped
land that can be developed, sold off to (slightly) reduce Equity
Requirements after purchase, or turned into other uses.
• This Parcel is zoned CB2, which should allow for 17-19 units
per Acre, or roughly 165 units. We think new construction
aimed at Families is appropriate given this sub-market has
strong schools (including across the Street) and is a desirable
sub-market. At 1200 square feet per unit, this could support
another 198,000 of net leasable feet.
• Other possible uses include turning this parcel into a big off-
leash dog park, an Frisbee park, or Selling it off (for probably
for about $900K).
Summit Road Capital LLC: Confidential, Do Not ForwardCarlyle Apartments: Room Revenue Forecast
Income Statement ($ US) Dec-16 Dec-17 Dec-18 Dec-19 Dec-20 Dec-21 Dec-22 2017-2022
Carlyle Apartments Actual Forecast Forecast Forecast Forecast Forecast Forecast Forecast
Doors / Keys 436 436 436 436 436 436 436 436 • The Carlyle Apartment Homes In
Average Sq Ft per Room 802 802 802 802 802 802 802 802
Total Livable Apartment Sq Ft 349,672 349,672 349,672 349,672 349,672 349,672 349,672 349,672
Place Rents Rates are below
Market Rental Rate per Sq Ft $0.87 $0.90 $0.92 $0.95 $0.98 $1.01 $1.04 $0.97
market rates by about 8%-10%.
YOY % 3.0% 3.0% 3.0% 3.0% 3.0% 3.0% 2.0% • Significant Value-Add opportunity
Monthly Market Rental Rate $698 $719 $740 $762 $785 $809 $833 $775
exists
Actual Rental Rate per Sq Ft $0.79 $0.84 $0.90 $0.97 $1.04 $1.09 $1.13 $0.99
YOY % 6.0% 8.0% 7.0% 7.0% 5.0% 4.0% 6.2% • We assume 5% terminal vacancy
Monthly Actual Rental Rate $634 $672 $725 $776 $830 $872 $907 $797
Market Rate Rental Income 3,650,576 3,760,093 3,872,896 3,989,083 4,108,755 4,232,018 4,358,978 24,321,822 • We forecast roughly 1.5% non-
Loss: Discount to Market (335,685) (246,309) (78,009) 71,446 236,011 329,986 385,506 698,631
collection.
Loss: Discount to Market % -9.2% -6.6% -2.0% 1.8% 5.7% 7.8% 8.8% 2.6%
• We are going to renovate and
Actual Rate Rent Revenues before Losses3,314,891 3,513,784 3,794,887 4,060,529 4,344,766 4,562,004 4,744,484 25,020,454
make these units nice, so we think
Loss: Concessions (8,287) (35,138) (37,949) (20,303) (21,724) (22,810) (23,722) (161,646)
Loss: Concessions % -0.3% -1.0% -1.0% -0.5% -0.5% -0.5% -0.5% -0.7% this forecast has easy upside!
Loss: Vacancy (174,032) (281,103) (265,642) (243,632) (217,238) (228,100) (237,224) (1,472,939)
Loss: Vacancy % -5.3% -8.0% -7.0% -6.0% -5.0% -5.0% -5.0% -6.0%
Loss: Non-Collection of Rent (9,423) (48,490) (52,939) (57,253) (61,913) (65,009) (67,609) (353,213)
Loss: Non-Collection of Rent % -0.3% -1.5% -1.5% -1.5% -1.5% -1.5% -1.5% -1.5%
Net Rental Revenues 3,123,149 3,149,053 3,438,357 3,739,341 4,043,891 4,246,085 4,415,929 23,032,656
Additional Revenues:
Utility Revenues 344,262 340,956 351,555 362,442 373,623 381,096 388,718 2,198,390
Resident Fee Revenues 116,343 115,226 118,808 122,487 126,266 128,791 131,367 742,944
All Other Revenues 90,395 89,527 92,310 95,169 98,105 100,067 102,068 577,245
Total Net Revenues 3,674,149 3,694,761 4,001,030 4,319,438 4,641,885 4,856,039 5,038,081 26,551,234 Summit Road Capital LLC:
YoY% 0.6% 8.3% 8.0% 7.5% 4.6% 3.7% 5.4% Confidential, Do Not Forward
Source: Summit Road CapitalCarlyle Apartments: Income Statement Forecast
Income Statement ($ US) Dec-16 Dec-17 Dec-18 Dec-19 Dec-20 Dec-21 Dec-22 2017-2022
Carlyle Apartments Actual Forecast Forecast Forecast Forecast Forecast Forecast Forecast
Gross Revenues 3,674,149 3,694,761 4,001,030 4,319,438 4,641,885 4,856,039 5,038,081 26,551,234
Monthly Actual Rental Rate $702 $706 $765 $826 $887 $928 $963 $846
Expenses:
Total Utilities (467,155) (476,498) (447,908) (456,866) (466,004) (475,324) (484,830) (2,807,430)
Maintenance Supplies (105,000) (94,500) (96,390) (101,210) (103,234) (105,298) (107,404) (608,036)
Maintenance Labor, Benefits and Taxes (76,237) (77,762) (79,317) (80,903) (82,521) (84,172) (85,855) (490,530)
Manager & Office Staff Labor, Benefits, Taxes(515,610) (412,488) (422,800) (433,370) (444,204) (455,310) (466,692) (2,634,865)
Other Employees Labor, Benefits and Taxes (240,000) (144,000) (146,880) (149,818) (152,814) (155,870) (158,988) (908,369)
Property Taxes (287,000) (292,740) (339,578) (346,370) (353,297) (356,830) (360,399) (2,049,215)
Property Management Fee (128,668) (120,080) (130,033) (140,382) (150,861) (157,821) (163,738) (862,915)
Advertising (19,000) (31,491) (34,384) (37,393) (40,439) (42,461) (44,159) (230,327)
Other Corporate Overhead (132,181) (92,527) (94,377) (96,265) (98,190) (100,154) (102,157) (583,670)
Insurance (104,000) (106,080) (108,202) (110,366) (112,573) (114,824) (117,121) (669,165)
Total Expenses (2,112,851) (1,867,165) (1,919,250) (1,972,710) (2,024,301) (2,068,631) (2,112,321) (11,964,377)
EBITDA 1,561,298 1,827,596 2,081,780 2,346,728 2,617,584 2,787,408 2,925,761 14,586,857
EBITDA Margin % 42.5% 49.5% 52.0% 54.3% 56.4% 57.4% 58.1% 54.6%
Capex Spends (146,966) 0 0 (172,778) (185,675) (194,242) (201,523) (754,218)
Total Property Cash Net Income 1,414,332 1,827,596 2,081,780 2,173,950 2,431,908 2,593,167 2,724,237 13,832,640
Net Property Sale Proceeds 18,754,284 18,754,284
Total Debt Service Payments (1,587,565) (1,587,565) (1,587,565) (1,587,565) (1,587,565) (1,587,565) (1,587,565) (9,525,389)
Net Income after Debt Service (for Equity (173,233)
Investors) 240,032 494,215 586,386 844,344 1,005,602 19,890,957 23,061,535
Source: Summit Road Capital
Summit Road Capital LLC: Confidential, Do Not ForwardCarlyle Apartments: Income Statement % of Revs
Income Summary % of sales Dec-16 Dec-17 Dec-18 Dec-19 Dec-20 Dec-21 Dec-22 2017-2022
Carlyle Apartments Actual Forecast Forecast Forecast Forecast Forecast Forecast Forecast
Gross Revenues 3,674,149 3,694,761 4,001,030 4,319,438 4,641,885 4,856,039 5,038,081 26,551,234
YoY % 0.6% 8.3% 8.0% 7.5% 4.6% 3.7%
Expenses:
Total Utilities -12.7% -12.9% -11.2% -10.6% -10.0% -9.8% -9.6% -10.6%
Maintenance Supplies -2.9% -2.6% -2.4% -2.3% -2.2% -2.2% -2.1% -2.3%
Maintenance Labor, Benefits and Taxes -2.1% -2.1% -2.0% -1.9% -1.8% -1.7% -1.7% -1.8%
Manager & Office Staff Labor, Benefits, Taxes
-14.0% -11.2% -10.6% -10.0% -9.6% -9.4% -9.3% -9.9%
Other Employees Labor, Benefits and Taxes-6.5% -3.9% -3.7% -3.5% -3.3% -3.2% -3.2% -3.4%
Property Taxes -7.8% -7.9% -8.5% -8.0% -7.6% -7.3% -7.2% -7.7%
Legal & Accounting 0.0% 0.0% 0.0% 0.0% 0.0% 0.0% 0.0% 0.0%
Property Management Fee -3.5% -3.3% -3.3% -3.3% -3.3% -3.3% -3.3% -3.3%
Advertising -0.5% -0.9% -0.9% -0.9% -0.9% -0.9% -0.9% -0.9%
Other Marketing -1.0% -0.5% -0.5% -0.5% -0.4% -0.4% -0.4% -0.5%
Office Supplies 0.0% 0.0% 0.0% 0.0% 0.0% 0.0% 0.0% 0.0%
Other Corporate Overhead -3.6% -2.5% -2.4% -2.2% -2.1% -2.1% -2.0% -2.2%
Insurance -2.8% -2.9% -2.7% -2.6% -2.4% -2.4% -2.3% -2.5%
Total Expenses -57.5% -50.5% -48.0% -45.7% -43.6% -42.6% -41.9% -45.1%
EBITDA 42.5% 49.5% 52.0% 54.3% 56.4% 57.4% 58.1% 54.9%
EBITDA Margin %
Capex Spends -4.0% 0.0% 0.0% -4.0% -4.0% -4.0% -4.0% -2.8%
Total Property Cash Net Income 38.5% 49.5% 52.0% 50.3% 52.4% 53.4% 54.1% 52.1%
Net Property Sale Proceeds 0.0% 0.0% 0.0% 0.0% 0.0% 0.0% 359.4% 68.2%
Total Debt Service Payments -44.7% -44.4% -41.0% -38.0% -35.4% -33.8% -32.6% -37.1%
Net Income after Debt Service (for Equity Investors)5.0%
-6.2% 11.0% 12.3% 17.0% 19.6% 380.9% 83.2%
Source: Summit Road Capital Summit Road Capital LLC: Confidential, Do Not ForwardCarlyle Apartments: Total Investor Cash Flows Income Statement ($ US) Dec-16 Dec-17 Dec-18 Dec-19 Dec-20 Dec-21 Dec-22 2017-2022 Base Case Scenario Actual Forecast Forecast Forecast Forecast Forecast Forecast Forecast Gross Revenues 3,674,149 3,694,761 4,001,030 4,319,438 4,641,885 4,856,039 5,038,081 26,551,234 Total Property Cash Net Income 1,414,332 1,827,596 2,081,780 2,173,950 2,431,908 2,593,167 2,724,237 13,832,640 Total Debt Service Payments (1,549,127) (1,549,127) (1,549,127) (1,549,127) (1,549,127) (1,549,127) (1,549,127) (9,294,762) Net Income after Debt Service (for Equity Investors) (134,795) 278,469 532,653 624,823 882,781 1,044,040 15,361,445 18,724,212 Schedule of Investor Cash Flows: Property Sale Net Proceeds14,186,335 14,186,335 Net Income after Debt Service (for Equity Investors) 278,469 532,653 624,823 882,781 1,044,040 15,361,445 3,120,702 Cash in the Bank Available for Equity Investors 457,500 735,969 660,622 677,446 952,227 1,388,267 15,681,320 3,349,309 Less Preferred Interest Payments to Equity Investors 8.0% (608,000) (608,000) (608,000) (608,000) (608,000) (571,169) (3,611,169) Cash In the Bank after Preferred Interest Payments 127,969 52,622 69,446 344,227 780,267 15,110,152 2,747,447 Return of Equity Capital to Investors & Sponsors 0 (460,392) (15,110,152) (15,570,544) Cash in the Bank after Return of Equity Capital 127,969 52,622 69,446 344,227 319,875 0 152,357 Equity Capital Balance Outstanding 7,600,000 7,600,000 7,600,000 7,600,000 7,600,000 7,139,608 0 6,256,601 Upside Cash Flow Payments Equity Investor Upside Payments 70.0% 0 0 0 0 0 5,579,381 5,579,381 GP Sponsor Upside Payments 30.0% 0 0 0 0 0 2,391,163 2,391,163 Total Cash Flows: Equity Investors: Acquisition of Property (7,600,000) 0 0 0 0 0 0 0 Equity Investors: Preferred Interest Payments 608,000 608,000 608,000 608,000 608,000 571,169 3,611,169 Equity Investors: Principal Return 0 0 0 0 460,392 7,139,608 7,600,000 Equity Investors: Upside Cash Flows 0 0 0 0 0 5,579,381 5,579,381 Total Equity Investor Cash Flows (7,600,000) 608,000 608,000 608,000 608,000 1,068,392 13,290,157 16,790,549 GP/Sponsor: Upside Cash Flows 0 0 0 0 0 2,391,163 2,391,163 Total Investor Cash Flows (7,600,000) 608,000 608,000 608,000 608,000 1,068,392 15,681,320 19,181,712 Equity Investor Cash on Cash Returns 8.0% 8.0% 8.0% 8.0% 14.1% 174.9% 2.21 x Total Cash on Cash Returns (w/ Sponsor Equity) 8.0% 8.0% 8.0% 8.0% 14.1% 206.3% 2.52 x IRR: Equity Investors 16.2% IRR: Total Project 18.9% Source: Summit Road Capital Summit Road Capital LLC: Confidential, Do Not Forward
Carlyle Apartment Homes: Apartment Layouts

                   Summit Road Capital, LLC: Confidential, Do Not Forward
Carlyle Apartments: Downside Scenarios Show Safety
Downside Scenario Sensitivities ($ US) Base Case Downside Scenario #1 Downside Scenario #2
Carlyle Apartments 2017 - 2022 2017 - 2022 2017 - 2022
Total Revenue Source: Summit Road Capital 26,551,234 25,223,672 23,896,111
•Downside Scenario #1
Revenue YoY % (Avg) 5.4% 4.6% 3.8% Still yields strong Cash
Monthly Actual Rental Rate (Avg) $803 $757 $717 on Cash Return and IRR
return metrics;
Total Expenses & Capex (12,718,594) (12,539,241) (12,359,888)
Total Property Cash Net Income 13,832,640 12,684,431 11,536,223 •Downside Scenarios
Property Net Margin % 52.1% 50.3% 48.3% include lower revenues,
Total Debt Service (9,294,762) (9,294,762) (9,294,762)
lower income, and a
Net Income after Debt Service (for Equity Investors) 4,537,877 3,389,669 2,241,460 worse Cap-Rate at exit
Exit Cap Rate 7.50% 8.00% 8.50%
Net Sale Proceeds 14,186,335 7,587,893 5,113,198
Total Project Cost Purchase Price Per Door 69,478 69,478 69,478
Gross Sale Price Per Door 83,310 71,854 61,745
Total Equity Investment (7,600,000) (7,600,000) (7,600,000)
Total Investor & GP Cash Flows 19,181,712 11,435,062 7,812,159
Cash on Cash Return: Equity Investors 2.21 x 1.50 x 1.03 x
Cash on Cash Return: Total Project (w/ Sponsor Equity) 2.52 x 1.50 x 1.03 x
IRR: Equity Investors 16.2% 8.2% 0.6%
IRR: Total Project (w/ Sponsor Equity) 18.9% 8.3% 0.6%
Summit Road Capital LLC: Confidential, Do Not ForwardCarlyle Apartments: A Nice Safe Place to Call Home
Summit Road Capital LLC: Confidential, Do Not ForwardAddendum #1: Secondary Market
Demographics Drive Stronger Returns
in MFU Apartments and Hotels
Summit Road Capital LLC: Confidential, Do Not ForwardSome of Our Preferred Markets for Yield
Summit Road Capital LLC: Confidential, Do Not ForwardClass B/C Value-Add in Tier II/III MSAs Maximizes Yield
Tier II Markets
yield 100bps
better than Tier
I Markets;
Class B Assets
yield 150bps
Average 4.50% 5.25% 6.75% 6.25% 7.00% 8.00% 9.00%
better than
Class A Assets;
Class C yields
350bps better
than Class A
Assets.
Average 5.50% 6.00% 7.00% 6.75% 8.00% 9.00% 10.25%
Source: CBRE
We prefer Value-Add in Class B/C (and often
Summit Road Capital LLC:
Confidential, Do Not Forward times Class C) to maximize yields.Class B/C Value-Add in Tier II/III MSAs Maximizes Yield
Tier III
Markets yield
325-425bps
better than
Tier I markets.
Class B Assets
yield 150bps
better than
Class A
Assets; Class
C yields
350bps better
than Class A
Assets.
Average 6.75% 7.50% 8.25% 8.00% 9.25% 10.25% 11.00%
Source: CBRE
We prefer Value-Add in Class B/C (and often
Summit Road Capital LLC:
Confidential, Do Not Forward times Class C) to maximize yields.Fastest Growing MSAs: More Than 750,000 Population
Population MSA: Greater than 750,000 2015 2010
State Change Encompassing Statistical Area
Rank People Estimate Census
33 Austin-Round Rock
Raleigh
TX
NC
2,000,860 1,716,289 16.58% • Growth with Value can still be found
44 1,273,568 1,130,490 12.66% Raleigh-Durham-Chapel Hill, NC MSA
5 Houston- Woodlands-Sugar Land TX 6,656,947 5,920,416 12.44% Houston-The Woodlands, TX MSA in Houston, Dallas, Phoenix, Atlanta,
24 Orlando-Kissimmee-Sanford FL 2,387,138 2,134,411 11.84% Orlando-Deltona-Daytona Beach, FL MSA
25 San Antonio-New Braunfels TX 2,384,075 2,142,508 11.27% Raleigh, Charlotte, San Antonio,
Denver-Aurora-Lakewood CO 10.65% Denver-Aurora-Lakewood, CO Metropolitan MSA
19
4 Dallas-Fort Worth-Arlington TX
2,814,330
7,102,796
2,543,482
6,426,214 10.53% Dallas-Fort Worth, TX-OK MSA
Austin, Jacksonville, Columbus,
36 Nashville-Davidson–Murfreesboro–Franklin
TN 1,830,345 1,670,890 9.54% Nashville-Davidson–Murfreesboro, TN MSATampa, and more
73 North Port-Sarasota-Bradenton FL 768,918 702,281 9.49% North Port-Sarasota, FL MSA
22 Charlotte-Concord-Gastonia NC, SC 2,426,363 2,217,012 9.44% Charlotte-Concord, NC-SC MSA • These are some of our most preferred
12 Phoenix-Mesa-Scottsdale AZ 4,574,531 4,192,887 9.10%
67 McAllen-Edinburg-Mission TX 842,304 774,769 8.72% McAllen-Edinburg, TX MSA markets
15 Seattle-Tacoma-Bellevue WA 3,733,580 3,439,809 8.54% Seattle-Tacoma, WA MSA
41 Oklahoma City OK 1,358,452 1,252,987 8.42% Oklahoma City-Shawnee, OK MSA • Growth but with Poor Value are
29 Las Vegas-Henderson-Paradise NV 2,114,801 1,951,269 8.38% Las Vegas-Henderson, NV-AZ MSA
6 Washington-Arlington-Alexandria
DC, VA, MD, WV
6,097,684 5,636,232
found in San Francisco, Miami,
8.19% Washington-Baltimore-Arlington, DC-MD-VA-WV-PA MSA
8 Miami-Fort Lauderdale-West Palm Beach
Atlanta-Sandy Springs-Roswell
FL
GA
6,012,331 5,564,635 Denver, Seattle
8.05% Miami-Fort Lauderdale-Port St. Lucie, FL MSA
9 5,710,795 5,286,728 8.02% Atlanta-Sandy Springs, GA MSA
40 Jacksonville FL 1,449,481 1,345,596 7.72% Jacksonville-St. Marys-Palatka, FL-GA MSA • We are very selective when shopping
35 San Jose-Sunnyvale-Santa Clara CA 1,976,836 1,836,911 7.62% San Jose-San Francisco-Oakland, CA MSA
48 Salt Lake City UT 1,170,266 1,087,873 7.57% Salt Lake City-Provo-Orem, UT MSA in these markets (we are always
11 San Francisco–Oakland–Hayward CA 4,656,132 4,335,391 7.40% San Jose-San Francisco-Oakland, CA MSA
Portland-Vancouver-Hillsboro OR, WA 2,389,228
selective but particularly wary here)
23 2,226,009 7.33% Portland-Vancouver-Salem, OR-WA MSA
18 Tampa-St. Petersburg-Clearwater FL 2,975,225 2,783,243 6.90%
17 San Diego-Carlsbad CA 3,299,521 3,095,313 6.60% Source: Wikipedia, Summit Road Capital
32 Columbus OH 2,021,632 1,901,974 6.29% Columbus-Marion-Zanesville, OH MSA
13 Riverside-San Bernardino-Ontario CA 4,489,159 4,224,851 6.26% Los Angeles-Long Beach, CA MSA
63 Greenville-Anderson-Mauldin SC 874,869 824,112 6.16% Greenville-Spartanburg-Anderson, SC MSA
46 New Orleans-Metairie LA 1,262,888 1,189,866 6.14% New Orleans-Metairie-Hammond, LA-MS MSA
27 Sacramento–Roseville–Arden-Arcade CA 2,274,194 2,149,127 5.82% Sacramento-Roseville, CA MSA
59 Omaha-Council Bluffs NE, IA 915,312 865,350 5.77% Omaha-Council Bluffs-Fremont, NE-IA MSA
71 Columbia SC 810,068 767,598 5.53% Columbia-Orangeburg-Newberry, SC MSA
34 Indianapolis-Carmel-Anderson IN 1,988,817 1,887,877 5.35% Indianapolis-Carmel-Muncie, IN MSA
16 Minneapolis-St. Paul-Bloomington MN, WI 3,524,583 3,348,859 5.25% Minneapolis-St. Paul, MN-WI MSA
45 Richmond VA 1,271,334 1,208,101 5.23% Summit Road Capital LLC:
61 Bakersfield CA 882,176 839,631 5.07%
52 Grand Rapids-Wyoming MI 1,038,583 988,938 5.02% Grand Rapids-Wyoming-Muskegon, MI MSA Confidential, Do Not ForwardFastest Growing MSAs: 100,000 – 750,000 Population
Population MSA: 100,000 - 750,000 2015 2010 Growth Population MSA: 100,000 - 750,000 2015 2010 Growth
State Encompassing Statistical Area State Encompassing Statistical Area
Rank People Estimate Census % Rank People Estimate Census %
324 The Villages FL 118,891 93,420 27.27% Orlando-Deltona-Daytona Beach, FL MSA 113 Port St. Lucie FL 454,846 424,107 7.25% Miami-Fort Lauderdale-Port St. Lucie, FL MSA
248 Midland TX 166,718 141,671 17.68% Midland-Odessa, TX MSA 282 Sebastian-Vero Beach FL 147,919 138,028 7.17% Miami-Fort Lauderdale-Port St. Lucie, FL MSA
258 Odessa TX 159,436 137,130 16.27% Midland-Odessa, TX MSA 154 Lincoln NE 323,578 302,157 7.09% Lincoln-Beatrice, NE MSA
123 Myrtle Beach-Conway SC, NC 431,964 376,722 14.66% Myrtle Beach-Conway, SC-NC MSA 285 Rapid City SD 144,134 134,598 7.08% Rapid City-Spearfish, SD MSA
79 Cape Coral-Fort Myers FL 701,982 618,754 13.45% Cape Coral-Fort Myers-Naples, FL MSA 323 San Angelo TX 119,659 111,823 7.01%
304 Bismarck ND 129,517 114,778 12.84% 161 Lubbock TX 311,154 290,805 7.00% Lubbock-Levelland, TX MSA
164 Greeley CO 285,174 252,825 12.80% Denver-Aurora, CO MSA 220 Panama City FL 197,506 184,715 6.92%
262 St. George UT 155,602 138,115 12.66% 237 Dover DE 173,533 162,310 6.91% Philadelphia-Reading-Camden, PA-NJ-DE-MD MS
75 Charleston-North Charleston SC 744,526 664,607 12.03% 177 Olympia-Tumwater WA 269,536 252,264 6.85% Seattle-Tacoma, WA MSA
192 Fargo ND, MN 233,836 208,777 12.00% Fargo-Wahpeton, ND-MN MSA 299 Logan UT, ID 133,857 125,442 6.71%
260 Auburn-Opelika AL 156,993 140,247 11.94% Columbus-Auburn-Opelika, GA-AL MSA 292 Morgantown WV 138,176 129,709 6.53% Morgantown-Fairmont, WV MSA
216 Daphne-Fairhope-Foley AL 203,709 182,265 11.77% Mobile-Daphne-Fairhope, AL MSA 326 Lawrence KS 118,053 110,826 6.52% Kansas City-Overland Park-Kansas City, MO-KS M
152 Fort Collins CO 333,577 299,630 11.33% 118 Huntsville AL 444,752 417,593 6.50% Huntsville-Decatur-Albertville, AL MSA
93 Provo-Orem UT 585,799 526,810 11.20% Salt Lake City-Provo-Orem, UT MSA 109 Pensacola-Ferry Pass-Brent FL 478,043 448,991 6.47%
181 Crestview-Fort Walton Beach-Destin FL 262,172 235,865 11.15% 160 Columbus GA, AL 313,749 294,865 6.40% Columbus-Auburn-Opelika, GA-AL MSA
148 Naples-Immokalee-Marco Island FL 357,305 321,520 11.13% Cape Coral-Fort Myers-Naples, FL MSA 124 Killeen-Temple TX 431,032 405,300 6.35%
235 Bend-Redmond OR 175,268 157,733 11.12% Bend-Redmond-Prineville, OR MSA 253 Kahului-Wailuku-Lahaina HI 164,726 154,924 6.33%
211 Hilton Head Island-Bluffton-Beaufort SC 207,413 187,010 10.91% 305 Hammond LA 128,755 121,097 6.32% New Orleans-Metairie-Hammond, LA-MS MSA
105 Fayetteville-Springdale-Rogers AR, MO 513,559 463,204 10.87% 198 Tyler TX 222,936 209,714 6.30% Tyler-Jacksonville, TX MSA
186 Sioux Falls SD 251,854 228,261 10.34% 203 Lafayette-West Lafayette IN 214,363 201,789 6.23% Lafayette-West Lafayette-Frankfort, IN MSA
169 Kennewick-Richland WA 279,116 253,340 10.17% 246 Bowling Green KY 168,436 158,599 6.20% Bowling Green-Glasgow, KY MSA
81 Boise City ID 676,909 616,561 9.79% Boise City-Mountain Home-Ontario, ID-OR MSA 306 Jonesboro AR 128,394 121,026 6.09% Jonesboro-Paragould, AR MSA
98 Durham-Chapel Hill NC 552,493 504,357 9.54% Raleigh-Durham-Chapel Hill, NC MSA 107 Lexington-Fayette KY 500,535 472,099 6.02% Lexington-Fayette–Richmond–Frankfort, KY MSA
91 Des Moines-West Des Moines IA 622,899 569,633 9.35% Des Moines-Ames-West Des Moines, IA MSA 115 Reno NV 450,890 425,417 5.99% Reno-Carson City-Fernley, NV MSA
249 Iowa City IA 166,498 152,586 9.12% Cedar Rapids-Iowa City, IA MSA 337 California-Lexington Park MD 111,413 105,151 5.96% Washington-Baltimore-Arlington, DC-MD-VA-WV
138 Savannah GA 379,199 347,611 9.09% Savannah-Hinesville-Statesboro, GA MSA 77 Stockton-Lodi CA 726,106 685,306 5.95% San Jose-San Francisco-Oakland, CA MSA
171 Wilmington NC 277,969 254,884 9.06% 88 Madison WI 641,385 605,435 5.94% Madison-Janesville-Beloit, WI MSA
187 College Station-Bryan TX 249,156 228,660 8.96% 247 Billings MT 168,283 158,934 5.88%
273 Coeur d'Alene ID 150,346 138,494 8.56% Spokane-Spokane Valley-Coeur d'Alene, WA-ID MSA 135 Salisbury MD, DE 395,300 373,802 5.75%
156 Boulder CO 319,372 294,567 8.42% Denver-Aurora, CO MSA 114 Corpus Christi TX 452,422 428,185 5.66% Corpus Christi-Kingsville-Alice, TX MSA
238 Punta Gorda FL 173,115 159,978 8.21% North Port-Sarasota, FL MSA 90 Deltona-Daytona Beach-Ormond Beach
FL 623,279 590,289 5.59% Orlando-Deltona-Daytona Beach, FL MSA
80 Colorado Springs CO 697,856 645,613 8.09% 209 Bellingham WA 212,284 201,140 5.54%
84 Lakeland-Winter Haven FL 650,092 602,095 7.97% 218 Athens-Clarke County GA 203,189 192,541 5.53% Atlanta–Athens-Clarke County–Sandy Springs, GA
166 Clarksville TN, KY 281,021 260,625 7.83% 121 Vallejo-Fairfield CA 436,092 413,344 5.50% San Jose-San Francisco-Oakland, CA MSA
176 Laredo TX 269,721 250,304 7.76% 199 Prescott AZ 222,255 211,033 5.32%
223 Gainesville GA 193,535 179,684 7.71% Atlanta–Athens-Clarke County–Sandy Springs, GA MSA 116 Asheville NC 446,840 424,858 5.17% Asheville-Brevard, NC MSA
87 Ogden-Clearfield UT 642,850 597,159 7.65% Salt Lake City-Provo-Orem, UT MSA 108 Lafayette LA 490,488 466,750 5.09% Lafayette-Opelousas-Morgan City, LA MSA
236 Columbia MO 174,974 162,642 7.58% Columbia-Moberly-Mexico, MO MSA 136 Gulfport-Biloxi-Pascagoula MS 389,255 370,702 5.00%
Source: Wikipedia, Summit Road Capital Source: Wikipedia, Summit Road Capital
Summit Road Capital LLC: Confidential, Do Not ForwardDallas TX: A Top Market Given Job & Rent Growth
The Dallas-Fort Worth MSA is one of our
top targets because of: Source: Berkadia
1) Tremendous job growth in the area and many
strong educational institutions;
2) Strong population growth over many decades;
3) Attractive cash flow yield opportunities exist
in many strong sub-markets like Irvine,
Grapevine, Lewisville, Plano, and more.
Source: Berkadia Summit Road Capital LLC:
Confidential, Do Not Forward
Dallas Rental Rate gains have been very strong; This
is both a positive (indicating market strength) and a
negative (we are buying with higher NOIs in place). Source: Wikipedia Source: BerkadiaAtlanta GA: A Top Market Given Job & Rent Growth
The Atlanta GA MSA is one of our top
targets because of:
1) Tremendous job growth in the area and
many strong educational institutions;
2) Strong population growth over many
decades;
3) Attractive cash flow yield opportunities
exist in many strong sub-markets like
Northeast Cobb/Woodstock, Kenesaw
and Acworth.
Source: Wikipedia
Source: Marcus & Millichap
Source: Wikipedia
Summit Road Capital LLC: Confidential, Do Not Forward Source: Marcus & MillichapTampa FL: A Top Market Given Job & Rent Growth
The Tampa FL MSA is one of our top
targets because of:
1) Tremendous job growth in the area and
many strong educational institutions;
2) Strong population growth over many
decades;
3) Attractive cash flow yield opportunities
exist in many strong sub-markets like
Northeast and South Tampa.
Source: Marcus & Millichap
Source: Wikipedia
Source: Wikipedia
Summit Road Capital LLC: Confidential, Do Not Forward Source: Marcus & MillichapColumbus, OH: A Top Market Given Job & Rent Growth
The Columbus OH MSA is one of our
top targets because of:
1) Tremendous job growth in the area and
many strong educational institutions;
2) Strong population growth over many
decades;
3) Attractive cash flow yield opportunities
exist in many strong sub-markets like
Dublin/Hillard, Upper Arlington, New
Albany Westerville, and Delaware.
Source: Marcus & Millichap
Source: Wikipedia
Source: ARAnewmark Summit Road Capital LLC: Confidential, Do Not ForwardPhoenix AZ: A Top Market Given Job & Rent Growth
The Phoenix AZ MSA is one of our top
targets because of:
1) Tremendous job growth in the area and
many strong educational institutions;
2) Strong population growth over many
decades;
3) Attractive cash flow yield opportunities
exist in many strong sub-markets like
Peoria, Sun City and Tempe.
Source: Greater Phoenix Economic Council
Source: Marcus & Millichap
Source: Wikipedia
Source: Marcus & Millichap
Summit Road Capital LLC:
Confidential, Do Not ForwardAddendum #2: About Us
and Our Team
Summit Road Capital LLC: Confidential, Do Not ForwardAbout Summit Road Capital: Pride in All We Do!
At Summit Road Capital, we combine our deep rolodex of Capital Relationships with our desire to
build new Development Projects, or reposition existing Assets, to create fantastic Customer
Experiences. We also focus on actively Managing Risk, and being a good Global Citizen too:
• We have a deep rolodex of Capital Relationships with Family Offices, Private Equity firms, Capital Brokers, and
individual wealthy Investors. These relationships have been built over time, and if they support the given project
at hand, can go extremely deep on any given Project (i.e. Billions of Dollars).
• We have a strong desire to continue building New Development Projects and take on Existing Asset
Repositioning in growth markets around the country. Our Team has built many different projects over the years,
with much experience in Hospitality in particular, but also MFU Apartments and Condos, Retail, and Office Space.
We tend to focus on Growth Markets, and Colorado certainly fits the bill, per many Demographic metrics.
• Our focus is on creating Fantastic Customer Experiences. Yes, making money for our Investors is a core principal
we live by, but we want to take pride in the Quality of Projects we develop, with the Customer Experience always
at the forefront of everything we do. When we show people our projects 20 or 30 years from now we want to see
these Assets highly utilized, standing up to the test of time, and still looking great!
• Risk Management is embedded in everything we do – from picking the right Projects to build, to over-capitalizing
our Projects to withstand economic ups & downs, to managing Construction details & timelines to ensure success.
• We focus on Ethics and being a Good Global Citizen too. It is important that we always operate in an Ethical
fashion, from Delivering Investor Returns, to serving the Community we are building in, to supporting our
Employees growth and development, to recognizing that the Environment (Mother Earth) is a key Stakeholder in
our Projects too. We don’t just talk about it, we Live and Breathe it always! Summit Road Capital, LLC:
Confidential, Do Not ForwardOur Team is Strong, with Significant
Project Development & Management
Experience across many vectors
• We have a deep bench of Talent and Experience at Summit Road Capital. Many of us have our own firms and
projects, and we also work together on projects and developments, on a case by case basis. We work together
because we want to, not because we have to, and often it is because of the tremendous Projects that are brought to
the table. This cooperative way of working together has allowed us to scale more projects faster, and with more
hands on deck than most other Development firms.
• Ethics and Integrity is embedded in everything we do. It is worth repeating this critical facet of our Firm Culture.
Summit Road Capital LLC: Confidential, Do Not ForwardCraig Berger, CFA CPA
• Co-Founded Summit Road Capital LLC, Agile Realty Capital, Westminster Hospitality LLC, others: Craig co-founded
Agile Realty Capital and Summit Road Capital to deploy capital intelligently across MFU Apartments, Hotels, and other
Commercial Realty assets. Most recently, he co-founded Westminster Hospitality to build a Starwood Aloft Hotel in
Denver. Previously, Craig acquired the 111-room Ramada Inn Pueblo, where the team is making substantial renovations
and upgrades, while pursuing marketing enhancements, operational initiatives, & cost reduction efforts. Previous to that,
Craig acquired a 95-unit apartment building in St. Louis MO. The team has improved the property, repositioned this asset,
and ramped cash flow. Summit Road Capital continues to make competitive offers on MFU Apartment and Hotel assets in
attractive markets, and expects to acquire additional properties in coming months. Craig leads all property Sourcing and
Underwriting activities, and is the lead sponsor on many existing deals implement Operational Improvements.
• Wall Street & Equity Research: Craig spent more than a decade as a highly acclaimed semiconductor equity research
analyst for firms like Smith Barney Citigroup and FBR Capital Markets. Here, he serviced leading hedge and mutual fund
clients, won several awards, and was one of CNBC's go-to semiconductor market experts with over 75 TV appearances.
• Angel Investor, Consultant, & Corporate Finance Professional. Craig has consulted for
technology startups in market strategy, outsourced CFO, and capital raising roles. He
has been an Angel Investor in various startups like Thirstie.com, BioIQ, and
Revenue.com. Craig worked at Intel Corp. (1999-2002) in the CPU and capital spending
finance groups, closing the books, helping drive the forecasting cycles, and working to
maximize cash return metrics. Here, Craig garnered industry perspective and learned
how large corporations are run from the inside.
Summit Road Capital LLC:
Confidential, Do Not ForwardDavid Cummings, CFP
• Co-Founded Agile Realty Capital LLC in 2014 and is Managing Director at Summit Road Capital. Mr. Cummings, along
with partner Craig Berger, Co-Founded Agile Realty Capital (ARC) in 2014. Agile Realty Capital is carefully deploying
capital into MFU Apartment and Hotel opportunities. Mr. Cummings co-leads ARC’s and SRC’s fundraising efforts,
interfacing with top Family Office and Private Equity firms around the world. His Wall Street M&A background prove
invaluable here. Mr. Cummings has also taken on larger and larger operating roles within our existing and new
development Projects, further developing his skillset and expertise in Commercial Realty.
• Wall Street M&A and Project Experience. Mr. Cummings has been a Co-Founder and Managing Partner of Agile Equity
since 1998, and has over 20 years of corporate finance experience in mergers and acquisitions, equity/debt financing, and
real estate activities. Mr. Cummings has successfully completed over one-hundred M&A transaction with several billion
dollars of enterprise value for both privately held and large multinational public companies. He has authored numerous
corporate finance articles for professional journals, magazines and periodicals. Before co-founding Agile Equity, Mr.
Cummings spent seven years as a Vice President with Fleet Financial Group (now Bank of America) where he developed
acquisition and divestiture strategies. Mr. Cummings began his career with State Street
Research & Management as an equity analyst specializing in technology.
• Finance & Real Estate Industry Experience: Mr. Cummings has also been active in the
Miami Real Estate market for over many years, acquiring, renovating and selling residential
Properties. He has completed a number of transactions in the Miami area, leading deal
sourcing, property selection, project management, property marketing, and other critical
facets of this local business.
Summit Road Capital LLC: Confidential, Do Not ForwardDallas Bligh
• Co-Founded Lizanatay Inc. and Westminster Hospitality LLC. In March 1997, Mr. Bligh formed Lizanatay, Inc, a
firm that owns and operates Hotels. Mr. Bligh has transformed many properties over the years and offers a wealth of
Hotel Management and Ownership experience. In 2001, Mr. Bligh built a brand new La Quinta Inn in Grand
Junction, CO. By 2012, Lizanatay owned five hotels, four restaurants, and had another eight properties under
receivership or with outside management contracts. Most recently, Dallas co-founded Westminster Hospitality LLC
and is helping lead the Planning & Development of this property, a Starwood Aloft in North Denver.
• Located in CO, UT, AZ, & WY, Lizanatay’s properties and projects have included independent and franchised
properties with: Hilton, IHG, Choice, Wyndham, Hampton Inn, Best Western, La Quinta Inn, Crowne Plaza, Holiday
Inn (Express), Comfort Inn, Quality Inn, Ramada, Super 8, ValueStay, and various restaurants like Hoot & Howl, Sal’s
Street Food, Crossroads Barbeque and La Crocevia. Mr. Bligh and Lizanatay has provided services for Private Equity
Funds, Banks, Independent Hotel Owners, Hotel Brokers, Hospitality Management Companies and Court
Appointed Receiverships.
• Turnaround Management Association: Mr. Bligh is a member of the Arizona and Rocky
Mountain Chapters of the Turnaround Management Association, after joining in 2011. As
a turnaround manager, Mr. Bligh quickly brings value to distressed assets. Often as a
court appointed Receiver, Mr. Bligh has been effective in implementing Lizanatay’s
systems and protocols, rapid staff training, and cost effective improvement plans. These
efforts have proven successful in increasing the value of properties by as much as 300%
in 18 months.
Summit Road Capital LLC:
Confidential, Do Not ForwardDallas Bligh, Hotelier & Turnaround Specialist
• Holiday Inn; Ramada; Amelia’s: Salt Lake City, UT – Receivership, Management Agreement
• La Quinta Inn and Suites: Grand Junction, CO – New Construction Project, Investment, Management
• Best Western Plus: Phoenix, AZ – Acquisition, Turnaround, Management
•
Quality Inn and Suites: Rawlins, WY – Acquisition, Turnaround, Management
• Best Western Buffalo: Buffalo, WY – Acquisition, Turnaround, Management
• Super 8: Buffalo, WY - Acquisition, Turnaround, Management
• Comfort Inn and Suites: Safford, AZ – Management Agreement
• Manor House Restaurant: Safford, AZ – Management Agreement
• Ramada Inn: Pueblo, CO – Management Agreement, Acquisition
• Holiday Inn Express; Best Western; Barrymore Hotel: Canon City, CO – Receivership, Management Agreement
• Hampton Inn - Pueblo, CO – Management Agreement
• Quality Inn Stapleton: Denver, CO – Acquisition, Management Agreement
• Valuestay: Pueblo CO – Turnaround Consulting Project
• Hoot & Howl Restaurants: Phoenix, AZ; Rawlins, WY; Buffalo, WY; Denver, CO - Acquisitions, New Construction, Management
• Sal’s Street Food: Denver, CO – Construction Project, Management
• La Crocevia, Italian Restaurant: Buffalo, WY – Construction Project, Management
• Crossroads Bar and Grill: Buffalo, WY – Construction Project, Management
• Hotel Investment Group: San Diego, CA – Management Services, Portfolio of 9 Properties
• Equisource: Las Vegas, NV – Multiple Receiverships, Management Agreements
• SLC Servicing: Salt Lake City, UT – Receivership, Management Agreement
• CO East Bank and Trust: CO Springs, CO – Receiverships, Management Agreements
• RedRock Properties: Phoenix, AZ – Management Agreements
•
InnVite Hospitality: Columbus, OH – Management Services for Portfolio of 10 Properties
• Westmont Hospitality Group: Denver, CO – Management Services for Portfolio of 5 Properties
Summit Road Capital LLC: Confidential, Do Not ForwardMark Kuster
• Construction and Renovation Project Experience: Mark Kuster is a Managing Director, Property
Renovations at Summit Road Capital (SRC) and Agile Realty Capital (ARC), both of which are
Commercial Realty firms focusing on Hotels, MFU Apartment buildings, and New Development. Mark
began buying Single Family Homes and Apartment Buildings on the Courthouse steps in 1980 and built
up a respectable portfolio of rental properties that he self managed for over twenty years.
• Built high-end Spec-Homes. Along the way, Mark also built high-end spec-homes, and performed
many property renovations as part of his fix and flip business. Mark brings 35-years of renovation and
construction experience to our team, where he helps the firm achieve tremendous value-add
renovations without over-spending along the way. Mark is also a licensed Tool and Die Maker, and has
added significant value to his Agile Realty Capital projects with the firm to date.
• Sourcing and Underwriting Expert too. In addition to this, Mark has become an
accomplished MFU Apartment deal underwriter and contributes to our Sourcing and
Underwriting efforts on a regular basis.
Summit Road Capital LLC:
Confidential, Do Not ForwardScott Rosenthal
• Director of Real Estate Development and Partner at Breads of the World, LLC, a Panera
Bread Franchisee. Scott joined Breads of the World in 2006 as the Director of Real Estate
Development. Here, Scott is responsible for all aspects of new bakery-cafe site selection
and evaluation. Scott has developed a quantitative process that assesses any site across
multiple metrics including demographics, competition, financial outcomes, site feasibility,
and more. Scott also is responsible for evaluating existing sites to determine a long term
position strategy, and to assess the potential for drive thru cafe conversions. As part of
this, Scott also works to coordinate development plan approval, entitlement process, and
construction permit process, construction management and more.
• Lease Specialist & Colorado Brokers Real Estate License. In addition to the above site
selection, evaluation, and ongoing assessments, Scott also oversees the process of land
acquisition and long term lease negotiations. Here he works closely with Sellers, other
brokers, attorneys, and more to create positive Outcomes for Breads of the World, and for
the Sellers. Scott has helped negotiate and close over 40 commercial transactions in the
past 10 years.
• Personal Background. Scott attended college at University of Cincinnati and graduated
with a degree in Marketing from Metropolitan State University of Denver. He has an
active Colorado Brokers Real Estate license.
Summit Road Capital LLC: Confidential, Do Not ForwardSummit Road Capital Offers Differentiated Service
We have some Competitive Advantages versus other big New York City firms:
• We are experts in Secondary & Tertiary markets like Dallas, Austin, Atlanta, Phoenix, and others;
Returns are Stronger here. Returns are much stronger in Secondary & Tertiary cities, and in Class B and
Class C properties. We have teams of people in these locations that are capable of helping us Ramp and
Scale the business to at least 500 units in each chosen market (economies of scale engage at that point).
• We have the experience and knowledge to be very successful, and are now scaling our business
further. So Opportunity needs Capital at this particular moment in time. We work with lower overhead
and are less Costly than many others that have been doing this for decades already.
• We provide exclusive Concierge-Level Service while operating with the highest levels of Ethics and
Integrity. Our firm only works with a handful of elite investors that we develop long-term relationships
with, while delivering Concierge-Level Services. We always operate with the highest in Ethics and
Integrity, and are trustworthy and reliable for our Partners. We try to win, have fun, engage our Staff,
and all while creating memorable and positive customer experiences.
• We manage Risk and take a hands-on approach with our Properties and Staff. We actively practice
many different Risk Mitigation techniques. Also, we actively manage our Properties and Staff. Yes, we
do hire 3rd Party Management for all of our properties, but we still work to maximize the effectiveness
of the Staff, the Management Team, and engage relevant parties to maximize our Project effectiveness.
• Our Fee Structure is Very Attractive. We charge very our Low Fees and focus on making our money by
adding value to a variety of projects. We very likely work cheaper
• We buy Quality Assets in Quality Locations and Do Not Overpay. This is a key component to our risk
mitigation strategy – we Do Not Overpay for our Properties. Also, we want to buy reasonably decent
quality in good locations so we can easily exit the asset in the future.
Summit Road Capital, LLC: Confidential, Do Not ForwardExecution Matters: Some of Our Special Sauce
Secret Sauce: Metrics Based Operations
• Managing by metrics is absolutely key to
success in apartment investing. We live by the
maxim ‘If you cannot measure, you cannot
manage’. Our apartment complexes are managed
through a metric driven reporting system called
an MMR (Monday Morning Report), which
includes metrics for occupancy, leasing,
delinquency, financials, marketing, renewals and
evictions. The MMR dashboard brings together
best-in-class apartment reporting metrics from
larger, more scaled competitors, and allows us to
track performance and take remedial action
much faster.
Summit Road Capital LLC:
Confidential, Do Not ForwardRisk Mitigation Thoughts & Techniques
Risk Management is so important that we embed it in every level of the organization, from Managing
staff on site at our Properties, to over-capitalizing each project to ensure success through economic
Upcycles and Downcycles. For Existing Assets:
• We are buying Class B/C value-add projects where we need to roll up our sleeves to upgrade interiors, exteriors,
operations, marketing, and staff oversight;
• We are buying properties with strong in-place cash flows that we will improve further in our first couple years;
• We are buying 1970s-1990s construction properties, where rents are one-half what they are in new construction
apartments; If a recession comes, our properties are supply limited and some portion of Renters will downsize into
our properties from newer more expensive properties.
For All Projects, Including New Development:
• We are buying in fast population growth zones in Central Texas, the Carolinas, the Southeast, and more;
• We Over-Capitalize our projects to be safe and sleep better at night!
• We underwrite all our deals assuming that Cap-Rates increase by 150 bps or more (we model our exits around
8.5%-9.0% Cap-Rates), leaving us some downside protection;
• We buy Quality Assets in Quality Locations and Do Not Overpay.
This is a key component to our risk mitigation strategy. Also, we
want to buy reasonably decent quality in good locations so we can
easily exit the asset in the future.
Summit Road Capital, LLC: Confidential, Do Not ForwardThank You! Craig Berger, CFA CPA (Craig@ARealtyCap.com)
You can also read