Capital Markets Day Presentation - 12th MAY 2021 - UPL
←
→
Page content transcription
If your browser does not render page correctly, please read the page content below
Capital Markets Day
Presentation
12th MAY 2021

Safe Harbor Statement

This document contains certain forward-looking statements with respect to the financial condition, results of
operations and business of UPL Limited (UPL) and certain of the plans and objectives of UPL with respect to these
items. Examples of forward-looking statements include statements made about our strategy, estimates of sales
growth, future EBITDA and future developments in our organic business. Forward-looking statements can be
identified generally as those containing words such as “anticipates”, “assumes”, “believes”, “estimates”, “expects”,
“should”, “will”, “will likely result”, “forecast”, “outlook”, “projects”, “may” or similar expressions. By their nature,
forward-looking statements involve risk and uncertainty because they relate to future events and circumstances
and there are many factors that could cause actual results and developments to differ materially from those
expressed or implied by these forward-looking statements. These factors include, but are not limited to, domestic
and global economic and business conditions, the successful implementation of our strategy and our ability to
realize the benefits of this strategy, our ability to develop and market new products, changes in legislation, legal
claims, changes in exchange and interest rates, changes in tax rates, raw materials and employee costs, our ability
to identify and complete successful acquisitions and to integrate those acquisitions into our business, our ability to
successfully exit certain businesses or restructure our operations, the rate of technological changes, political,
economic and other developments in countries where UPL operates, industry consolidation and competition. As a
result, UPL’s actual future results may differ materially from the plans, goals and expectations set forth in such
forward-looking statements. For a discussion of factors that could cause future results to differ from such forward-
looking statements, see also Risk management, of our Annual Report.
Corporate Overview
    Jai Shroff, Global CEO

                             3
Our values

     Nothing’s impossible.   Always human.      One team, one focus.

         Win win win.               Agile.   Keep it simple, make it fun.

                                                                            4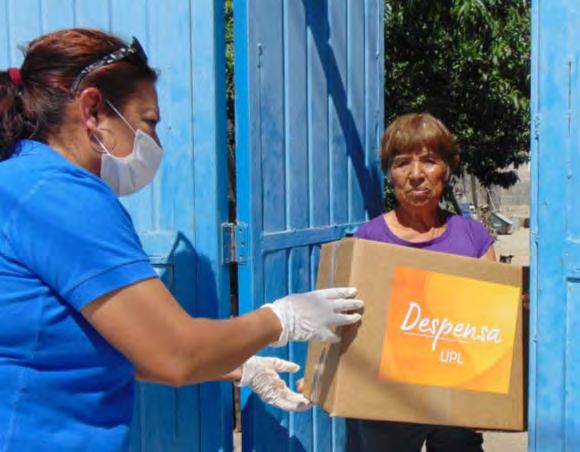
Living our
value of
Always Human

               Stepping up at the
               time of a global crisis

                                         5
The global challenge of                                                                                    UPL delivering effective solutions
feeding the world

                                                                                                              Driving sustainable agriculture

50%                              17%                                                                              Achieving transformational growth through
                                                                                                                  technology integration
More demand                      Harvest losses                           Lead the Agri Solutions space
for food                                                                     through differentiated
                                                                            products, bio-solutions,                 Accelerating the innovation engine to
                                                                                                                     tap new growth markets and
                                                                         digitization and collaborations             opportunities
10Bn                             12M Ha                                               across
                                                                               the food value chain
World population Ag. land loss p.a                                                                               Providing end-to-end solutions for farmers
                                                                                                                 through products and services
 Source: FAO, by the year 2050

                                                                                                            Collaborating across food value chain

                                                             Digitization to accelerate transformational growth

                     Capital Markets Day Presentation 2021                                                                                                    6
OpenAgTM

Reimagining Sustainability with an open network to create sustainable
                growth for all - no limits, no borders.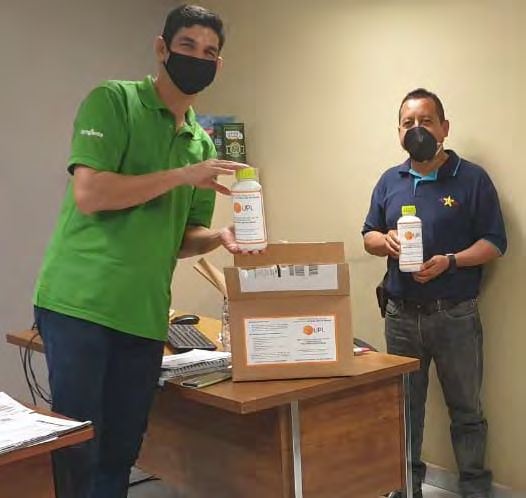
Our Mission

                 Change the game
to make every single food product more sustainable
Snapshot of UPL

    #5                                                      #1                              #1
    In the Industry                                         In BioSolutions                 Ag.chem company
                                                                                            in ESG by Sustainalytics1

₹ 387B                                         21%                            ₹ 86B               26%
FY21 Revenue                                   5Y Revenue Growth              FY21 EBITDA         5Y EBITDA Growth

    1 Based on Sustainalytics report dated 25th Sept 2020                                                               9
    2 Revenue and EBITDA growth from FY16 to FY21
OpenAg in Action
 Business Performance
 Diego Casanello, Global COO
FY2021 Financial Highlights

A Strong Year under Challenging Conditions                                                                           8%
(₹ crore)                                                                 FY 2021           FY 2020       B/(W) LY   Revenue Growth vs LY
                                                                                                                     Strong volume growth in most
 Revenue                                                                  38,694            35,756            8%     regions (11% growth vs FY20),
                                                                                                                     partially off-set by impact of currency
 Gross Margin                                                               41%               40%         +46bps
                                                                                                                     (-3% growth vs FY20) driven by
 Fixed OH                                                                  7,145             6,897            -4%    depreciation of Brazilian Real

 EBITDA                                                                    8,559             7,452            15%    46 bps
 EBITDA %                                                                  22.1%             20.8%        +130bps    higher Gross Margin vs LY
Purchase price allocation effect is removed from FY 2020 numbers.                                                    Favorable mix driven by growth in
                                                                                                                     higher margin Differentiated &
Revenue Development by Region                                                          Revenue Variance              Sustainable solutions

                                                                                                                     15%
                                                                               22%
                                                                                                                     EBITDA Growth vs LY or 147 bps
                            12%
         8%                                                                                                          Higher sales with improved gross
                                                                    3%
                                                 1%                                                                  margin drove the improvement in
  Latin America            Europe         North America             ROW        India
                                                                                                                     EBITDA, partially off-set by 4%
                                                                                                                     increase in overheads

                                                                                                                                                               11
FY2021 Regional Highlights
Latin America North America Europe Rest Of World India
8% 1% 12% 3% 22%
14,863 13,764 7,044 6,815
5,691 5,635 6,422 5,714 4,677 3,828
FY21 FY20 FY21 FY20 FY21 FY20 FY21 FY20 FY21 FY20
Growth despite Supply constraints New product sales continue Strong growth in Asia, Excellent performance in
FX devaluation impacting sales to outpace impact of and flat business a strong market
in Brazil in Q4 banned products in Africa
• Most Latin America countries have • North America growth subdued on • Improved mix and profitability, driven • Double digit growth in South-East • Favorable weather with normal
delivered close to double digit account of open orders due to by accelerated sales of Differentiated Asia, supported by continued monsoons drove higher acreages
growth vs FY20 supply constraints & Sustainable Solutions expansion of Glufosinate solutions in both seasons
• Brazil growth ahead of market, • Strong growth in Sustainable • Strong growth Benelux, Germany, • Accelerated growth in China, driven • Continued volume expansion of
despite significant currency Solutions drove improved margins Poland, Italy and Iberia by volume gains in UPL’s branded Ferio®, Sweep Power®, and
devaluation sales and the Yoloo acquisition accelerated growth of Sustainable
• Increased demand for Interline® • Excellent performance of Argos® in its Solutions
• Sucking Pest Platform (patented (Glufosinate) due to robust ramp first launch year, in addition • Flat growth in Africa, impacted by
Sperto® and Perito®) and Soybean up of resistant-traits acres to Fazor® in potatoes COVID related challenges • New Product Launches creating a
Resistance Management Platform complete portfolio for farmers.
• France sales impacted by declining
(Unizeb® Gold, Tridium® and
market
patented Unizeb® Glory), grew
significantly in Brazil and other
South American countries
12OpenAg smart solutions transforming growth
Journey has begun to become an OpenAg smart Farming Partner
Growth in Revenues (₹ crore)
CAGR: 21% 38694
35756
31616
16680 17506
14660
Reliable Product Supplier OpenAg Smart Farming Partner
Product focused supply of post- Smart Farming Solutions, combining crop
patent & proprietary crop protection protection, biosolutions, digital and
formulations FY16 FY17 FY18 FY19 FY20 FY21 other agronomic services
Portfolio Segmentation (Crop Protection only, excluding others) (%) Value Proposition
13
Low or no chemical residues, water &
Value Proposition FY16 FY21 carbon mgt. programs with focus on
Competitive product, price, yield and resource use
performance and supply reliability
14 Post-Patent Solutions
29 FY 21 Status
Differentiated & Sustainable Solutions Leading Biosolutions portfolio and
ProNutiva offerings, Ag services offered
35% CAGR of Sustainable & Differentiated Solutions 71 in some areas and digital solutions in
86 13% CAGR of Post-Patent Solutions development
13Strategy Update
OpenAg – Reimagining Sustainability
Carlos Pellicer, Global COOOpenAg helps
farmers grow and
prosper.
New ideas, new
ways, new
answers.
15OpenAg is customer centric and agile
OpenSkies Strategies drive UPL’s OpenAg Innovation pull model, developing platforms of solutions to address key
farmer pain points
Traditional Discovery-Driven Push Model
• Higher innovation cost & risk
• Lower speed-to-market of new products
Product for
Farmers
Develop
Applications
In-House AI • Narrower pool of proprietary AIs
Discovery
• Lower ROIC business model
UPL’s OpenAg Innovation Pull Model: Driven by Farmers’ Pain Points • Lower innovation cost & risk
• Higher speed-to-market of new products
• Farmer pain points drive R&D
Develop initial, Create disruptive, • Open approach to technology, a wide AI pool
Farmer Pain Point unique and
agile solutions
patented
solutions
• Platform of solutions to address farmer pain
points, often reinventing or creating new segments
• Higher ROIC business model
16OpenAg brings solutions to farmers from soil to sale
Addressing farmers’ pain points in fast growing segments, to make every single food product more sustainable
Digital
Services
3-4x market CAGR
Weed, Disease
Seeds & Insect Plant Stress
Protection & Stimulation
1-2x market CAGR
3-4x market CAGR
1 x market CAGR
Soil &
Seed Health Crop Residue
Management
2-3x market CAGR Post-Harvest
Resistance 4-5x market CAGR
Management 2-3x market CAGR
1-3x market CAGR
Source: Company Internal Data; comparative CAGR’s to conventional crop protection market
17Soybean Resistance Management Platform for Brazil
Conceptualized in FY11, and growing consistently since launch
Farmer The inability to control fungi due to loss of efficiency of established solutions and higher disease pressure,
Pain Point impacting productivity and return on investment
Major Solution
Launch of Unizeb® Gold as a resistance management tool,
2013/14
creating the protectant segment, applied in conjunction with
established solutions
Our Innovation Launch of patented Unizeb® Glory, a ready mixture of
2017/18
Understanding pain protectant with a systemic fungicide
points of farmers, a Launch of Tridium® (pending patent application) creating a
new protectant 2019/20 treatment program of Unizeb Gold, with Unizeb Glory and
segment was created, Tridium
and multiple Launch of Evolution® (pending patent application), a new
2021/22
subsequent solutions premium multisite stand-alone solution, highly effective
developed to deliver against leaf spots and soybean rust
sustainable growth 2023/24 Launch of Fluarys® , pre-mix formulations containing patented FLUARYS
Fluindapyr, highly effective in controlling soybean rust (+ other Brands)
Multisite Solutions Based
18Soybean Resistance Management Platform for Brazil
Conceptualized in FY11, and growing consistently since launch
Farmer The inability to control fungi due to loss of efficiency of established solutions and higher disease pressure,
Pain Point impacting productivity and return on investment
Launch Year Evolution of our offering Total Available Market (TAM)
2013/14 USD 0.8 Bn
2017/18 USD 1.0 Bn
2019/20 USD 1.3 Bn
2021/22 USD 2.2 Bn
2023/24 FLUARYS USD 4.0 Bn
Solutions in this platform such as Unizeb Glory and Fluarys have IP protection until
2034 and 2033 respectively and more patent applications are pending approval
19Other Examples of OpenAg Innovation Pull Model
Through the creation of Platforms of Differentiated and Sustainable Solutions
PLATFORM CONTROL OF SUCKING PLATFORM ANTI-SPROUTING
PESTS FOR POTATOES
Solutions • Sperto®, Perito®, and more… Solutions • Argos®, Fazor®, and more…
Highlighted solution Sperto® systemic and contact Highlighted solution Argos® biological sprout
insecticide suppressant for potatoes
• Launched in 2017 in Brazil to • Launched in 2020 in the EU to
control sucking pests in suppress the formation of
soybeans, which became a sprouts in potatoes, as a
problem for farmers after the sustainable alternative to
introduction of soybean GMO CIPC, recently banned in the
traits EU
• Patented, optimized • Solution developed from in-
formulation house Biological (via
acquisition) and applied in
• Fast track registration conjunction with Fazor®
• TAM: $1.1 Bn • TAM: ~ $100 m
20How to become an OpenAg smart farming partner?
OpenAg
OpenSkies
Reimagining ① Strategies
Sustainability
OpenAg
with an open network to ② Innovation
create sustainable growth
OpenAg
for all - no limits, no ③ Collaboration
borders.
④ OpenAg
Services
Digital and
21OpenSkies Strategies are built from farmer paint points
OpenSkies Country Strategies
Program initiated in FY21 for Strategies are created through a
the development of long-term customer centric approach, with
growth strategies for UPL’s the identification of major farmer
top 20 countries, representing pain points in key crops
80% of the market
Levering our OpenAg Innovation approach, Platforms of Solutions1 to be
developed, creating sustainable growth for all
Invent / Execute / Protect
1Examples of platforms include: Control of Sucking Pests, Soybean Resistance Management and Anti-Sprouting for Potatoes
22Strategy Update
OpenAg – Reimagining Sustainability
Adrian Percy, CTOOpenAg Innovation driven by Farmer Leading to solutions and
Pain Points collaborations
“Best-in-class” at re-inventing chemistry and
creating crop solutions 103 78
New Technology Collaborations with
Deploy a “field to lab” approach that combines
Evaluations External Partners
deep market insights to solve grower pain
points using proven and novel technologies to Novel Technologies¹ to Address Unmet Needs
build platforms of solutions Enhancing activity of molecules and overcoming
resistance issues
Utilize OpenAg Innovation to access new
technologies, including biological and digital, Microbial-based products to support sustainable
with a strong focus on advancing agriculture
sustainable agriculture 2nd Gen biological-inspired molecules for strong
biocontrol
Maximize ROIC through excellent capital
allocation and cost consciousness Novel biological approaches to control viruses in high
value crops
1Limited examples of new and unique technologies that are being developed through UPL’s OpenAg
Innovation in collaboration with Partners
24UPL’s Capabilities for Delivering OpenAg Innovation
Through agility, creativity and collaboration, we are committed to solving pain points
that drive sustainable agriculture and farmer resiliency.
Field Stations, Chemistry and Formulation R&D
Labs 750+ 20+ >2.5%
R&D Professionals R&D Facilities Annual Revenue
reinvested into R&D
Recent Investments
• Launched a globally-facing R&D hub, the OpenAg Center, in
Research Triangle Park, NC, USA
• OpenAg Farm launched in Brazil in an area of 25,000 ha divided
into 7 farms, partnering with multiple growers to optimize plant
health and sustainability
• Opened new field trial stations in Bujalmoro, Spain and Shray
Hill, Shropshire, UK
• Additional field trial stations planned in Mexico, Brazil and North
America.
25Connecting Innovation to Farming at Scale
Bringing OpenAg Innovation and OpenAg Collaboration together
• The OpenAg Farm is an area of 25,000 ha divided into 7 farms in the state of Mato
Grosso
• UPL has partnered with farmers and farming companies to realize this innovative
vision
• By farming at scale, we live the farmer pain points, create and validate solutions at
the farm level
26OpenAg Innovation pipeline is transforming UPL
>$2.5 Bn
Innovation Rate¹
>$4.5 Bn
21.8% Total Risk Adjusted Peak Est. Projected Risk Adjusted
20.8% 20.8%
Sales3 Outlook Revenue in 5 years
~50% 15
FY 19-20 FY 20-21 FY 21-22²
Increase in PPV from last year New Molecules in
Development Pipeline
FY2021 Revenues Breakdown by Products New Products Pipeline Peak Sales Breakdown Medium Term Revenues Breakdown by Products
% % %
Post Patent
Differentiated 20 Differentiated
29 and Sustainable and Sustainable
50 50
Post Patent 71 80 Differentiated Post Patent
and Sustainable
Post-Patent Solutions 1Defined as the % of total sales from products launched in the last 5 years
2Projected Innovation Rate
Differentiated & Sustainable Solutions 3Considers the highest expected sales by project in any given year, risk adjusted per internal estimates 27
assigning technical probability of success to the best of our knowledge at the time of the projectionBuilding Sustainable Solutions for the Soil and Seed Health Segment
Flupyrimin, Novel Insecticide GAXY, Proprietary Biostimulant
with new mode of action with optimizing plant potential
expanded application
TAM: ~$1.6 Bn TAM: ~$ 0.1-0.2 Bn
• Inability to protect seeds and seedlings from insects • Inability to grow crops to full yield due to abiotic stresses during
during vital period of crop establishment growing cycle
• Significant yield losses due to available solutions • Growing regulatory and societal pressure to reduce the use of
Farmer Pain Point
being under regulatory pressure or losing efficacy fertilizers and chemicals
• Flupyrimin is a systemic insecticide to control key • GAXY is a novel extract proven to demonstrate:
pests in multiple crops when applied as a seed • Improved nitrogen use efficiency in row crops
treatment or in-furrow. • Improved root architecture for row crops and vegetables
• With a new mode of action, it affords resistance • Improved reproductive heat stress tolerance in row crops, TNV
Solutions management and has a favorable regulatory profile and vegetables
against pollinators. • Initial launch expected in 2022/23
• Initial launch expected in 2025/2026
• Licensed from Meiji Seika Pharma Co. • Developed internally
• Patented, New MOA subgroup • Patented
IP
28Strategy Update
OpenAg – Reimagining Sustainability
Carlos Pellicer, Global COOOpenAg Collaboration - Our way of life
We connect and collaborate in new ways to resolve challenges and create
new opportunities together
OpenAg Center Collaboration portal Agronomical Collaboration
Collaboration with FIFA Foundation Collaborations for Access to
technologies
Digital Collaborations Soil Health Collaboration
30OpenAg Collaboration - Our way of life
Enhanced Tool Kit of Solutions
Description
Partner
Date March 2021 • Addition of core active ingredient to develop new family of
value-added solutions to growers, with 17 formulations in
AI/Service Chlorantraniliprole the pipeline
TAM $5.0 Bn • Early access to commercialize Chlorantraniliprole (CTPR)
insecticide in key markets prior to patent expiration
• UPL to toll manufacture/ supply Chlorantraniliprole to FMC in
India
31OpenAg Collaboration - Our way of life
Enhanced Tool Kit of Solutions
Description
Partner • Flupyrimin, discovered by Meiji, is a patented insecticide with a new
MOA subgroup
Date 2018, 2020 and May 2021
• Latest license agreement provides UPL exclusive access to Flupyrimin
AI/Service Flupyrimin, IP Protected formulations for foliar application on Rice in several countries1 in
TAM ~$2.5 Bn Southeast Asia
• Prior agreements provide exclusive access for Rice in India plus Crop
Establishment applications globally with exclusions2
• With these agreements, UPL will now have a complete portfolio for
Rice in Asia and India, while also strengthening our Crop
Establishment offering
1 Countries include Indonesia, Philippines, Malaysia, Thailand, Vietnam, Myanmar, Cambodia, Pakistan, and Bangladesh
2 Excluding territories: Japan, South Korea and Taiwan; non-exclusive arrangement in China
32OpenAg Collaborations drive growth
Enhanced Tool Kit of Solutions
Partner
Date January 2021 May 2021
Service: Scalable sensor on an artificial Soil Health Collaboration
AI/Service intelligence platform
Technology to monitor the Two-year collaboration to help
Description temperature, humidity and carbon dioxide enhance our understanding of the soil,
(CO2) levels of stored grain helping UPL develop the right solutions
Data driven insights to influence how grain is for farmers to enhance soil health
stored, handled and transported to help
reduce food waste, improve food quality and
increase sustainability.
33OpenAg Digital Universe
We help farmers be
more resilient by
making agriculture
simpler, more
predictable and
sustainable
34OpenAg Digital Universe accelerating Smart Farming Solutions
Agronomic advice Omni-Channel Platform
in real time to that allows farmers to
farmers order inputs and sell
outputs online
Farm Commercialization
Management
Farm Management
FinTech Business Intel
New alternative Services to farmers
Financial Products and distributors
leveraging farmer data that help optimize
access their business
35OpenAg Growth Ambition
OpenAg smart Farming Partner Journey • Long Term Revenue Growth Ambition of 7 – 10% p.a.
7% to 10% CAGR
• OpenSkies Strategies will focus our efforts to create
Services Platforms of Solutions that will address farmers’ pain
points and to become an OpenAg Farming Partner
• Deliver our $4.5 Bn (at peak) R&D pipeline
OpenAg Innovation
• Achieve 50% of revenues from Differentiated and
Sustainable Solutions by FY26:
Organic Growth
• Accelerate Biostimulants adoption
FY21 FY26
• Customer centric approach to create new Biologicals
Portfolio Segmentation Evolution (Crop Protection only, excluding Other) (%)
• Continue to expand our ProNutiva offerings
FY21 FY26
• Implement our OpenAg Digital Concepts
29 Post-Patent Solutions
Differentiated & Sustainable Solutions 50 50 • Continuous focus on increasing ROCE
71
36Robust Financials in
a Challenging Environment
Anand Vora, Global CFOTrack record of Superior Financial Performance
Total Revenue* (₹ in crore) EBITDA* (₹ in crore)
CAGR: 21% CAGR: 26%
35,756 38,694 8,559
31,616 7,452
6,312
16,680 17,506 8% 15%
14,660 3,429 3,517
2,711
FY16 FY17 FY18 FY19 FY20 FY21 FY16 FY17 FY18 FY19 FY20 FY21
PAT**@ (₹ in crore) Net Debt (₹ in crore)
EPS Net Debt / EBITDA*
18.54 34.06 26.51 19.52 23.24 36.42 1.5 1.0 1.1 4.2 3.0 2.2
26,466
CAGR: 28% 22,061
3,692 18,922
2,798
2,093 2,026 14%
1,814
1,081 32%
4,069 3,466 3,737
FY16 FY17 FY18 FY19 FY20 FY21 FY16 FY17 FY18 FY19 FY20 FY21
Consistently delivered on guidance with continued focus on deleveraging
Note: @ Profit before exceptional items and minority interest
*Considers Arysta numbers for full year FY2019 and before adjustment for purchase price allocation
**Considers Arysta numbers for two months for FY2019 (acquisition in Feb 2019) and after adjustment for purchase price allocation
38Q4 Profit and Loss Account
₹ crore
Particulars Q4 FY21 Q4 FY20 Change
Reported % Reported % %
Total Revenue from operation 12,797 100% 11,141 100% 15%
Variable Cost 8,061 63% 7,188 65%
Gross Margin 4,736 37% 3,953 35% 20%
Fixed Overheads 1,896 15% 1,784 16%
EBITDA 2,839 22% 2,169 19% 31%
Other Income / (Loss) (139) (243)
Amortization / Depreciation 576 595
Finance Cost 421 187
PBT 1,704 13% 1,144 10% 49%
Tax 320 212
PAT 1,384 11% 932 8% 48%
Income/(Loss) from Associate Co. and JV 60 23
Minority Interest 298 167
Profit After Tax, Associate Income & Minority Interest 1,145 9% 789 7% 45%
Exceptional Cost 81 171
Net Profit 1,065 8% 617 6% 72%
39FY2021 Profit and Loss Account
₹ crore
Particulars FY2021 FY2020 Change
Reported % Reported % %
Total Revenue from operation 38,694 100% 35,756 100% 8%
Variable Cost 22,990 59% 21,756 61%
Gross Margin 15,704 41% 14,000 39% 12%
Fixed Overheads 7,145 18% 6,897 19%
EBITDA 8,559 22% 7,103 20% 20%
Other Income / (Loss) 51 (226)
Amortization / Depreciation 2,173 2,012
Finance Cost 2,060 1,481
PBT 4,377 11% 3,384 9% 29%
Tax 685 586
PAT 3,692 10% 2,798 8% 32%
Income/(Loss) from Associate Co. and JV 42 3
Minority Interest 624 402
Profit After Tax, Associate Income & Minority Interest 3,110 8% 2,399 7% 30%
Exceptional Cost 238 623
Net Profit 2,872 7% 1,776 5% 62%
5% increase in EBITDA considering PPA impact of 349cr in 12M FY20. Adjusted EBITDA 7,452cr, and adjusted PAT after Associates Income minority and exceptional cost 2125 cr.
40Breakdown of Finance Cost
₹ crore
Particulars FY2021 FY2020 Change Q4 FY21 Q4 FY20 Change
Total Interest Cost on Borrowings 1,305 1,401 (96) 265 298 (33)
Other Finance Charges (refer to table below) 341 103 238 227 30 197
MTM on IC Loans and hedges 158 (159) 317 (121) (200) 79
NPV – Interest & Finance 256 136 120 50 59 (9)
Total Finance Cost 2,060 1,481 579 421 187 234
Particulars FY2021 FY2020 Change Q4 FY21 Q4 FY20 Change
Other Finance Charges
Prepayment cost on make whole offer and open market buy back of bonds 98 - 98 98 - 98
Amortization cost on prepayment of term loans 93 - 93 93 - 93
Others 140 103 37 36 30 6
Total 238 197
Lower interest cost, finance charges higher due to one-time costs of pre-payment of debt
41Working Capital Analysis
FY21: 9,422cr FY21: 11,874cr FY21: 13,789cr
FY20: 7,850cr FY20: 11,428cr FY20: 11,555cr
131
113 118 119
90
81 80
71
Inventory Receivables Payables Net Working Capital
FY2021 FY2020
Note: As a risk management measure, the company has been selling its receivables on non-recourse basis to banks. Receivables sold as of 31st March 2021
were 7,623 crore (31st March 2020 7,023 crore)
42Summarised Cash Flow Statement (1st April 2020 to 31st March 2021)
Cash generation from business ₹ crore Appropriation of cash ₹ crore
Particulars Amount Particulars Amount
PBT 4,377 Interest paid (1,655)
Non cash items 4,047 Interest Income & Others 202
Working capital and other changes (504) Exp on Financing of Debt & Issue of Equity (99)
Exceptional item (285) Dividend paid (458)
Net cash from operating business 7,634 Financing costs and Dividends (2,010)
Income tax paid (725) Borrowings & Bond Issue (4,219)
Capex (2,122) Payment for Acquisition (177)
Lease obligation and others (282) Total Appropriation (6,406)
Net cash generation from business 4,506 Cash & Bank net of appropriation (1,900)
Movement of Gross and Net Debt ₹ crore
Particulars FY21 FY20
Opening Gross Debt 28,813 29,317
Opening Cash and cash equivalent 6,752 2,851
Opening Net debt 22,062 26,466
Reduction in Gross debt 4,219 2,870
Others incl. mark- to- market on Loans 820 (2,365)
Gross Debt 23,774 28,813
Cash and Cash equivalent 4,852 6,752
Net Debt 18,922 22,062
43Guidance: FY2022
+7-10% +12-15%Open Ag - Reimagining Sustainability
Economic
Sustainability
Environment Supply
Sustainable Growth for All
45The True Heroes of our Story
46Appendix
47Cost and Revenue synergy targets and achievements
Cost Synergy Target, run rate (USD Mn) Cost Synergies Achieved (USD Mn)
882 Crore
200+
120
Year 1 Year 2
Revenue Synergies Target, run rate (USD Mn) Revenue Synergies Achieved (USD Mn)
1,421 Crore
350+
100
Year 1 Year 3
Actual synergies accrued to P&L 48Debt Profile: FY2021
Debt Maturity—Long term (USD Mn) Debt Distribution by currency (USD Mn)
As of March 31, 2021 As of March 31, 2021
• +99% unsecured debt
• $500mn acquisition loan replaced with
sustainability loan @30bps lower
interest and extended maturity by 2
years
• Committed to Investment Grade Credit
58% FY2024 43% USD 04% INR
Rating
27% FY26-28 39% EUR 03% BRL
15% FY28 & beyond 11% JPY 01% Others
49Balance Sheet: FY2021
₹ crore
Particulars YTD Mar'21 YTD Mar'20 Particulars YTD Mar'21 YTD Mar'20
Equity Share Capital 153 153 Fixed Assets 1
Perpetual bonds 2,986 2,986 Tangible Assets 7,352 6,655
Retained earnings 17,748 16,143 Intangible Assets 11,147 11,857
Total Equity 20,887 19,282 Right of use assets2 695 642
Minority Interest 3,693 3,312 Goodwill 17,689 18,241
Borrowings 23,774 28,813 Total Fixed Assets 36,883 37,395
Long term Finance lease obligation 736 682 Investments 618 558
Other long-term liabilities 798 45 Inventory 9,422 7,850
Deferred Tax 996 1,122 Trade receivables 11,874 11,428
Provisions and others 1,776 1,814 Trade payables (12,525) (10,233)
Total Liabilities 52,661 55,071 Other liabilities (1,264) (1,321)
Working Capital 7,508 7,724
Cash and Bank 4,852 6,752
Loans and advances and other current assets 2,800 2,642
Total Assets 52,661 55,071
1 Fixed Assets includes Arysta Assets at its Fair Value.
2 IND-AS 116 accounting standard for lease implemented in FY2020
50You can also read