Business Update February 25, 2022 - Edison International
←
→
Page content transcription
If your browser does not render page correctly, please read the page content below
Business Update February 25, 2022
Forward-Looking Statements
Statements contained in this presentation about future performance, including, without limitation, operating results, capital expenditures, rate base growth, dividend policy, financial
outlook, and other statements that are not purely historical, are forward-looking statements. These forward-looking statements reflect our current expectations; however, such statements
involve risks and uncertainties. Actual results could differ materially from current expectations. These forward-looking statements represent our expectations only as of the date of this
presentation, and Edison International assumes no duty to update them to reflect new information, events or circumstances. Important factors that could cause different results include, but
are not limited to the:
• ability of SCE to recover its costs through regulated rates, including uninsured wildfire-related and debris flow-related costs, costs incurred to mitigate the risk of utility equipment
    causing future wildfires, costs incurred to implement SCE's new customer service system, costs incurred as a result of the COVID-19 pandemic, and increased labor and materials costs
    due to supply chain constraints and inflation;
• ability of SCE to implement its Wildfire Mitigation Plan and capital program;
• risks of regulatory or legislative restrictions that would limit SCE’s ability to implement Public Safety Power Shutoff (“PSPS”) when conditions warrant or would otherwise limit SCE’s
    operational PSPS practices;
• risks associated with implementing PSPS, including regulatory fines and penalties, claims for damages and reputational harm;
• ability of SCE to maintain a valid safety certification;
• ability to obtain sufficient insurance at a reasonable cost, including insurance relating to SCE's nuclear facilities and wildfire-related claims, and to recover the costs of such insurance or,
    in the event liabilities exceed insured amounts, the ability to recover uninsured losses from customers or other parties;
• extreme weather-related incidents (including events caused, or exacerbated, by climate change, such as wildfires, debris flows, droughts, high wind events and extreme heat events) and
    other natural disasters (such as earthquakes), which could cause, among other things, public safety issues, property damage, operational issues (such as rotating outages and issues due
    to damaged infrastructure), PSPS activations and unanticipated costs;
• risk that California Assembly Bill 1054 (“AB 1054”) does not effectively mitigate the significant exposure faced by California investor-owned utilities related to liability for damages
    arising from catastrophic wildfires where utility facilities are alleged to be a substantial cause, including the longevity of the Wildfire Insurance Fund and the CPUC's interpretation of
    and actions under AB 1054, including its interpretation of the prudency standard established under AB 1054;
• ability of Edison International and SCE to effectively attract, manage, develop and retain a skilled workforce, including its contract workers;
• decisions and other actions by the California Public Utilities Commission, the Federal Energy Regulatory Commission, the Nuclear Regulatory Commission and other governmental
    authorities, including decisions and actions related to nationwide or statewide crisis, determinations of authorized rates of return or return on equity, the recoverability of wildfire-
    related and debris flow-related costs, issuance of SCE's wildfire safety certification, wildfire mitigation efforts, approval and implementation of electrification programs, and delays in
    executive, regulatory and legislative actions;
• ability of Edison International or SCE to borrow funds and access bank and capital markets on reasonable terms;
• risks associated with the decommissioning of San Onofre, including those related to worker and public safety, public opposition, permitting, governmental approvals, on-site storage of
    spent nuclear fuel, delays, contractual disputes, and cost overruns;
• pandemics, such as COVID-19, and other events that cause regional, statewide, national or global disruption, which could impact, among other things, Edison International's and SCE's
    business, operations, cash flows, liquidity and/or financial results and cause Edison International and SCE to incur unanticipated costs;
• physical security of Edison International's and SCE's critical assets and personnel and the cybersecurity of Edison International's and SCE's critical information technology systems for
    grid control, and business, employee and customer data;
• risks associated with cost allocation resulting in higher rates for utility bundled service customers because of possible customer bypass or departure for other electricity providers such
    as Community Choice Aggregators (“CCA,” which are cities, counties, and certain other public agencies with the authority to generate and/or purchase electricity for their local residents
    and businesses) and Electric Service Providers (entities that offer electric power and ancillary services to retail customers, other than electrical corporations (like SCE) and CCAs);
• risks inherent in SCE’s capital investment program, including those related to project site identification, public opposition, environmental mitigation, construction, permitting, changes in
    the California Independent System Operator’s transmission plans, and governmental approvals; and
• risks associated with the operation of electrical facilities, including worker and public safety issues, the risk of utility assets causing or contributing to wildfires, failure, availability,
    efficiency, and output of equipment and facilities, and availability and cost of spare parts.
Other important factors are discussed under the headings “Forward-Looking Statements”, “Risk Factors” and “Management’s Discussion and Analysis” in Edison International’s Form 10-K
and other reports filed with the Securities and Exchange Commission, which are available on our website: www.edisoninvestor.com. These filings also provide additional information on
historical and other factual data contained in this presentation.

February 25, 2022                                                                                                                                                                                     1
Edison International is leading the transformation of the
electric power industry

                    Holding company focused on opportunities in clean energy,
                    efficient electrification, grid of the future, and customer choice

                    One of the nation’s largest electric-only utilities, serving over 15
                    million residents

                    EIX’s principal subsidiary, with ~$5+ billion annual electric
                    infrastructure investment opportunity

                    Growth driven by investment in strengthening and modernizing
                    the grid and advancing California’s aggressive climate goals

                    Wires-focused rate base of ~$39 billion, with limited ownership
                    of power generation capacity (
EIX is well positioned for a decarbonized future, with no coal
or gas LDC exposure and high electric sales growth potential
UTY1 EEI Index2
Electric-Only & No stranded asset risk with
No Gas LDC Exposure
(# of Companies)
6 of 20 12 of 39 increased electrification
No Coal Generation No coal generation or contracts
Ownership
(# of Companies)
5 of 20 9 of 39 in SCE’s portfolio
100% Carbon-free SCE’s aggressive target is
Electricity by 20453,4
(# of Companies)
5 of 20 14 of 39 strongly aligned with California’s
net zero goal
Electric Sales per Relatively low per-customer usage
13–38 12–53
Customer 16 will grow with electrification,
Avg: 24 Avg: 24
(MWh/year)5 which supports affordability
1. Philadelphia Utilities Index (UTY) consists of 20 geographically diverse public utility stocks, including one water utility. Values shown include EIX
2. EEI Index consists of 39 publicly traded companies that are members of Edison Electric Institute, which includes 18 of the companies also in UTY. Values shown include EIX
3. Company counts reflect the number of companies with goals of net zero or carbon-free electricity targets by 2045 or sooner
4. For EIX, defined as 100% carbon-free electricity delivered to SCE customers in terms of retail sales by 2045
5. Based on latest available data for year ended 2020
Source: EIX research, S&P Capital IQ Pro
February 25, 2022 3
Sustainability is central to Edison’s vision to lead the
transformation of the electric power industry
We are committed to achieving net-zero GHG emissions by 2045 and have other
 long-term ESG goals related to clean energy, electrification, DE&I, and safety
Environmental                                                           Social                                                                Governance
2045 goals: net-zero GHG                                                Recipient of several awards for                                       Highest level governance score
emissions across Scopes 1, 2, and                                       workplace diversity & inclusion2                                      from ISS
3 and 100% carbon-free power
delivered (~42% in 2021)1                                               Long-standing community                                               Board oversight of ESG risks such
                                                                        partnerships, incl. $2.4B annual                                      as safety, climate change impacts,
Over $800 million in approved                                           spend with diverse suppliers                                          and cybersecurity
SCE funding to expand
transportation electrification                                          Publish expansive data2 on
                                                                                                                                              8 of 12 directors diverse by
                                                                        workforce, supplier, and
                                                                                                                                              gender, race/ethnicity, and/or
SCE named to SEPA 2021 Utility                                          community investment diversity
                                                                                                                                              LGBTQ, including 5 women3
Transformation Leaderboard for
progress toward carbon-free grid                                        Committed to gender parity in
                                                                        executive roles by 2030 and                                           50% of executive annual incentive
Winner of EEI’s Edison Award for                                        broader DEI actions                                                   pay tied to safety & resiliency-
innovative suite of Transportation                                                                                                            related goals for 2022
Electrification programs                                                $20 million per year in
                                                                        philanthropic contributions with                                      Recognized as a CPA-Zicklin
Committed to SCE vehicle fleet                                          at least 80% going to diverse and                                     “Trendsetter” in political
electrification goals by 2030                                           underserved communities                                               accountability and disclosure4
1.   Net zero goal is enterprise-wide. Delivered power goal is SCE-specific and percentages refer to power delivered to SCE customers. Reflects no coal generation of delivered electricity
2.   View data in our annual Diversity, Equity & Inclusion Report, as well as awards and recognition in our annual Sustainability Report, both found on our Sustainability site
3.   In April 2022, William P. Sullivan is expected to retire from the Board, at which point 8 of 11 directors will be diverse, including 5 women
4.   Edison International is recognized as a “Trendsetter” on the Center for Public Accountability (“CPA”)-Zicklin Index of Corporate Political Disclosure and Accountability. The Trendsetter category
     highlights leaders in the S&P 500 for commitments to transparency and accountability in political spending

February 25, 2022                                                                                                                                                                                         4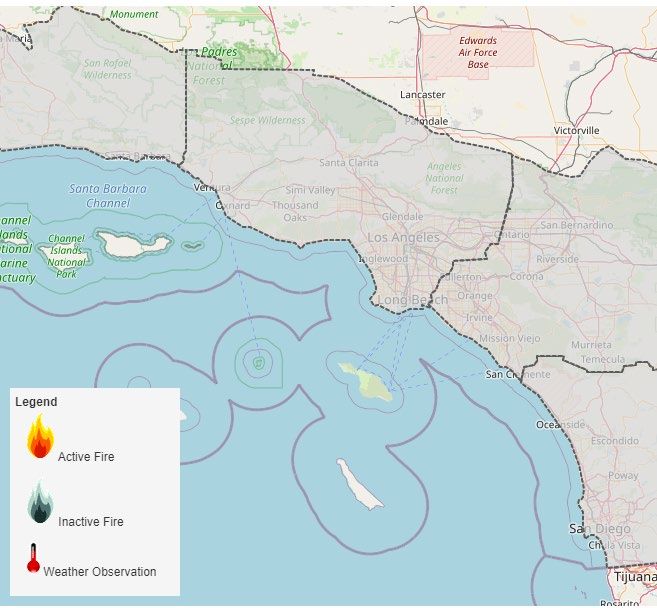
Our sustainable financing activities underscore the strong link
between our strategy and financings

Green, Social, and Sustainability instruments will fund         Edison’s Sustainable Financing
projects that provide distinct environmental or social benefits Framework aligned with
Eligible Project Categories Included in Sustainable Financing Framework                       ICMA’s Green Bond Principles,
                                                                 U.N. Sustainable Development Social Bond Principles, and
              Primary Category1                                         Goals Alignment       Sustainability Bond Guidelines
Green Renewable Energy
                                                                                                                                     Vigeo Eiris2, second-party
                                                                                                                                     opinion provider, rated
              Clean Transportation
                                                                                                                                     framework’s Contribution to
                                                                                                                                     Sustainability as “Advanced”
              Energy Efficiency &                                                                                                    (highest rating)
              Carbon Reduction
                                                                                                                                     SCE has issued $2.1 billion of
              Climate Change
                                                                                                                                     sustainable bonds for eligible
              Adaptation
                                                                                                                                     projects under the framework
Social Socioeconomic                                                                                                                 and $0.5 billion of green
       Advancement and                                                                                                               securitization bonds3
       Empowerment, Including
       Gender Inclusion
1. Excludes projects with GHG intensity above 100 gCO2e / kWh and bioenergy projects that do not have a sustainable feedstock (i.e., does not negatively impact food security or contribute to
   deforestation). Excludes any expenditures on fossil fuel-fired generation, nuclear generation or large hydro (>30 MW)
2. Vigeo Eiris was acquired by Moody’s Corporation in 2019 and has rebranded as Moody’s ESG Solutions since providing their second-party opinion
3. Issued independent of Edison’s Sustainable Financing Framework; Vigeo Eiris separately provided an additional second-party opinion on offerings alignment with ICMA’s Green Bond Principles

February 25, 2022                                                                                                                                                                                5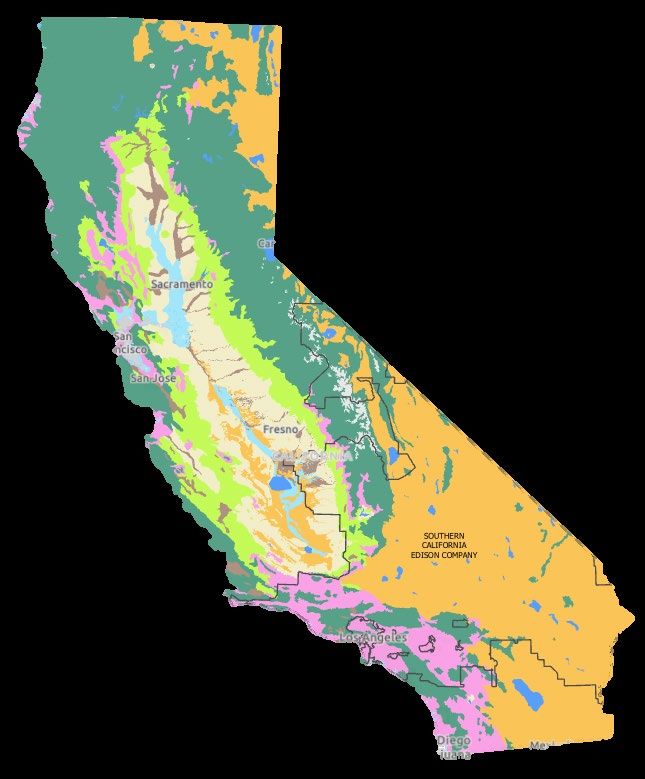
Thesis: Wires-focused electric utility with regulated rate base
growth aligned with state’s aggressive clean energy goals
                                                       Decoupling of sales
                    Constructive California and        Forward-looking ratemaking
                    Federal regulatory structures      Premium California ROE
                                                       Wildfire prudency standard

                    Aggressive climate goals met       California GHG reduction
                    with clean, efficient, economy-    Helping customers make
                    wide electrification               clean energy choices

                                                       Address wildfire risk and
                    Significant investment required    climate adaptation needs
                    to strengthen and modernize
                                                       Infrastructure replacement
                    the electric grid
                                                       Electrification infrastructure
                                                       7–9% average annual 2021–
                    Investment in electric-led clean   2025 rate base growth
                    energy future results in strong
                    rate base and dividend growth      Target dividend payout of
                                                       45–55% of SCE core earnings
February 25, 2022                                                                       6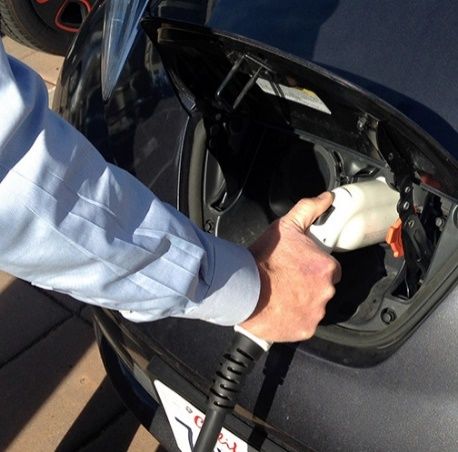
California’s regulatory mechanisms provide revenue certainty,
even as load and payment patterns change

 Revenue Decoupling Long-standing regulatory mechanism that breaks the link between retail
      means earnings aren’t electricity sales and revenue; promotes energy efficiency, helps stabilize
      affected by changes in customer bills, and supports environmental goals
              electricity sales
                                Changes in sales only affect timing of cash collection

    Balancing Accounts SCE has several balancing accounts, including for variances in sales
   allow SCE to collect and volume, such as those related to COVID-19
       refund differences to
         authorized revenue Balancing account established for residential uncollectibles

       COVID-19 Related CPUC approved COVID-19 Pandemic Protections Memo Account
        Memo Accounts (CPPMA) where SCE tracks non-payment of billed amounts for
  allow SCE to track cost residential and small business customers
                                                                  1

and payment changes for
                          CPUC approved establishment of Medium-Large Commercial and
  cost recovery requests
                          Industrial memo account to track incremental costs of disconnection
                          moratorium on these customers and related uncollectibles

                                                     Eligible COVID-19-related costs record to CEMA

                                                     Each requires seeking approval to recover costs recorded to them
1. Residential bad debt expense records to the Residential Uncollectibles Balancing Account (RUBA) (not the CPPMA) and does not require additional approval before recovering in rates

February 25, 2022                                                                                                                                                                        7
CLEAN ENERGY TRANSITION LEADERSHIP
Reaching California’s 2045 GHG goals requires a near-
complete transformation of energy use economy wide
Pathway 2045: Key steps California must take to reach carbon neutrality

100% of grid sales       76% of light-duty     30% of space and       Natural gas capacity      Sequestration can be
with carbon-free         vehicles need to be   water heating to be    provides a crucial role   achieved through
electricity              electric              electrified by 2030    for reliability and       additional natural
                                                                      affordability; however,   resources or
80 GW of utility-scale   67% of medium-duty    70% of space and
                                                                      consumption will          engineered solutions
clean generation         vehicles need to be   water heating to be
                                                                      decline 50% by 2045
                         electric              electrified by 2045                           Emerging
30 GW of utility-scale                                                  40% of remaining gas technologies and
energy storage           38% of heavy-duty     Building electrification will need to be low  practices will be
                         vehicles need to be   will increase load       carbon fuels (e.g.,  required to find the
30 GW of generation      electric              significantly by
and 10 GW of storage                                                    biomethane,          most economical
                                               2045—representing        hydrogen)            method to remove
from DERs, including                           15% of the total load
50% of single-family                                                                         carbon at this scale
homes

  Edison will continue working in partnership with state and federal governments
   and with other stakeholders, including the communities we serve, to advance
                       policies that rapidly cut GHG emissions
February 25, 2022                                                                                                      9
SCE is a catalyst for achieving California’s aggressive GHG
and clean energy goals via economy-wide electrification
Achieving 80% GHG reduction by 2050 will require fuel Electricity sales required to be
use changes in all sectors 100% carbon-free by 2045
State Carbon Emissions Reduction Pathway
California GHG Emissions, Annual million metric tons (MMT) Decarbonizing transportation
sector, ~40% of GHG emissions,
requires widespread vehicle
400
Electricity electrification
State’s commitment highlighted by
300 40% by 2030 requiring all new passenger
(260 MMT)
vehicles sold to be zero-emission
by 2035 and operations of MD/HD
200 Transportation Carbon Neutrality vehicles2 be zero-emission by 2045
by 2045
(108 MMT)
Electrification of buildings and
80% by 2050
100 Industrial (86 MMT) industrial processes also a key
factor
Buildings and Other1 Remaining emissions require offset
– or sequestration to reach carbon
2015 2020 2025 2030 2035 2040 2045 2050 neutrality
1. Buildings and Other includes residential, commercial, and agriculture
2. Medium- and heavy-duty (MD/HD) vehicles shall be 100% zero-emission by 2045 where feasible, with the mandate going into effect by 2035 for drayage trucks
Source: SCE’s Pathway 2045 analysis
February 25, 2022 10Significant incremental grid investments required by 2045 to
serve load growth and integrate renewables and storage
At least a third of incremental grid investment fits CAISO-wide investment required at
squarely within IOU jurisdictions various voltage levels and to address
CAISO-wide grid investment in Pathway 2045 Balanced Scenario specific system needs
~$75 billion
(2019$) CAISO estimates $30 billion of
transmission investment needed
through 20402; generally consistent
Infrastructure to interconnect
Transmission for and integrate resources with SCE’s Pathway 2045 analysis3
Out-of-State
Imports May be mix of investment by Upgrades at lower voltages are
utilities, generators, and other clearly utility-owned; transmission
market participants projects may be competitively bid
ISO Interconnections
Local Capacity
Potential additional utility investment
Utility infrastructure additions upside from storage
Subtransmission and upgrades – Pathway 2045 analysis showed
Predominantly investments by ~$54 billion1 need for battery
Distribution
utilities in their service areas storage CAISO-wide
CAISO Grid Investment – May be opportunities where
2031–2045 utilities are natural owners
1. In 2019 dollars under Balanced Scenario
2. Source: CAISO Draft 20-year Transmission Outlook published January 31, 2022, which is long-range conceptual plan of the transmission grid in 20 years to provide context for and framing of issues in
CAISO’s 10-year Transmission Plan. The 20-year outlook is not a tariff-based project approval process that focuses on project approvals
3. SCE estimates that CAISO’s Draft 20-year Transmission Outlook includes approximately $8 billion of transmission investments in the utility’s service area, which may be competitively bid
Source: SCE’s Pathway 2045 analysis. See Pathway 2045 Appendices for additional information on the analysis and its methodology
February 25, 2022 11A decarbonized, electrified world produces energy cost
savings for an average household
Total energy cost for an average household decreases By 2045, a greater reliance on
by about one-third by 2045 electricity, combined with
Annual residential household energy costs (2019$)1 population and economic growth,
will result in a 60% increase in
$4,550
Home Solar electricity sales from the grid
Electricity Bill Household savings driven by
$3,130 reduced gasoline consumption due
Home Gas Bill to high market penetration of
electric vehicles
Improvements in equipment
Gasoline efficiency, energy efficiency, and
demand response programs further
reduce consumption
2019 2045
1. Reflects annual energy costs using SCE data and does not account for the cost of equipment. Assumes average customer in 2045 would have electric vehicle, solar, and electric water and space
heating
Source: SCE’s Pathway 2045 analysis
February 25, 2022 12SCE’s average rate has grown less than inflation over the last
20 years, even with recent increases to mitigate wildfire risks
Among California IOUs, SCE has SCE’s system average rate has grown at an annualized
the lowest system average rate ~2.3% vs. local inflation of ~2.6% since 20012
System Average Rate1 Cents per kWh Cents per kWh
25
28.0
Los Angeles Area
25.1 +26%
vs SCE
Inflation
22.3 +13%
vs SCE
20
SCE System
Average Rate
15
10
SCE PG&E SDG&E 2001 '06 '11 '16 2021
1. All rates include California Climate Credit
2. Inflation data based on CPI Los Angeles-Long Beach-Anaheim region: through December 31, 2021
Sources: SCE Advice 4651-E/A effective Jan. 1, 2022, PG&E Advice 6408-E-B effective Jan. 1, 2022, SDG&E Advice 3881-E effective Jan. 1, 2022
February 25, 2022 13Edison International has one of the strongest electrification
profiles in the industry
Transportation Building Energy
Electrification Electrification Storage
Largest U.S. IOU EV charging SCE recently proposed $677 SCE has installed or procured
programs with over $800 million plan to accelerate ~3.2 GW of storage capacity
million of approved funding adoption of 250,000 heat
pumps SCE constructing ~535 MW of
Substantial state budget
utility-owned storage to
commitments to accelerate State’s proposed $962 million support reliability
zero-emission vehicles investment in building
1 in 7 U.S. EVs are in SCE’s decarbonization complements Project 30 GW of utility-scale
service area1 SCE’s plan storage needed California-
wide by 2045
Current trajectory of 4.7 million Target to have 20 million
EVs in CA (1.7 million in SCE’s residential heat pumps in
Growing energy storage
area) by 2030, and need to California by 2045
capacity supports reliability as
achieve 7.5 million2
Represents ~2.2 million MWh economy increasingly relies
Represents ~6.7 million MWh of incremental load in SCE’s on electricity
of incremental load in SCE’s area by 2030 ~9.8 million
area by 2030 and ~50 million MWh by 2045
MWh by 2045
1. As of December 2021. Source: DMV on data provided by EPRI
2. Based on SCE analysis. SCE’s Pathway 2045 analysis estimates that 7.5 million light-duty EVs are needed by 2030 for California to meet its decarbonization target
February 25, 2022 14SCE leads the largest utility transportation electrification
initiatives and programs in the U.S.
Edison’s large suite of TE programs enables By 2030, SCE will administer over $1
California’s leadership of EV adoption billion of EV purchase incentives and
Approved Electric Utility Transportation Electrification Portfolios other equity focused programs funded
>$200 Million; $ in Millions (capital and O&M)
via California’s LCFS program1
EIX $872
By 2027, SCE’s offerings will have:
– Added >40,000 light-duty vehicle
PCG $414 chargers and ~8,500 medium-
and heavy-duty vehicles
ED $367 – Directly contributed to
electrification of >550,000
vehicles with ~50% in
SRE $235
disadvantaged communities
PEG $205 EIX/SCE received the prestigious EEI
Edison Award for SCE’s innovative suite
of TE programs
NEE $205
1. Low Carbon Fuel Standard. The LCFS program at the California Air Resources Board (CARB) funds SCE’s vehicle rebate programs through the sale of LCFS credits to market participants and not
through customer rates. These amounts are distinct from funding approved for SCE’s transportation electrification programs
Sources: EEI Electric Transportation Biannual State Regulatory Update (November 2021), SCE
February 25, 2022 15SCE’s future load growth is highly levered to EV adoption,
which is a critical component of reaching state GHG goals
Electric vehicles in SCE’s service area added ~2,250 GWh To date, ~1 in 7 U.S. electric
of load in 2021 and could grow to 50,000+ GWh by 2045 vehicles have been sold in SCE’s
Electric load from electric vehicles in SCE’s service area, GWh1 service area2
60,000 – ~330,000 EVs in SCE’s area2
Pathway 2045
Trajectory
50,000
SCE’s Charge Ready programs are
expected to stimulate growth in EV
Current adoption and the build out of
40,000
Trajectory charging infrastructure
30,000 More durable
SCE’s programs include a focus on
funding for
transportation serving multi-family unit dwellings
20,000 market required and disadvantaged communities
to close the gap
10,000 Proposed state budget funding of
$10 billion to accelerate zero-
0 emission vehicles represents
2020 '25 '30 '35 '40 2045 significant progress in helping spur
adoption
1. Includes both light duty and non-light duty EV load
2. As of December 2021. Source: DMV data provided by EPRI
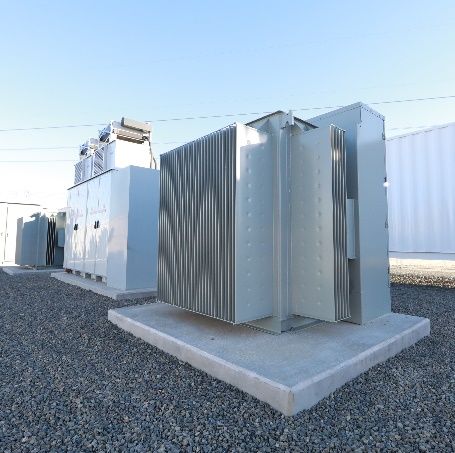
February 25, 2022 16Increased energy storage is essential to support the
transition to a carbon-free future
SCE has installed or procured ~3.2 GW of storage SCE is in the process of procuring
capacity and must procure ~3.2 GW more by 20261 2,800 MW for 2023 and 2024
Energy storage capacity procured and online (MW)
7,000 CPUC mid-term reliability decision
Future Procurement Requirements
requires SCE to procure ~3,706 MW
6,000
Procured or Under Construction
of energy storage to be online 2023
Online
through 2026 and ~350 MW of
5,000 baseload renewables (e.g.,
geothermal) by 20261
4,000
SCE constructing ~535 MW of
3,000 utility-owned storage on track to
be in service by August 2022 to
2,000 help alleviate reliability risks
1,000 SCE estimates that California will
need 10 GW of utility-scale energy
– storage by 2030 and 30 GW by
2020 2021 2022 2023 2024 2025 2026 2045 to support the transition to
100% carbon-free power
1. SCE’s proportional procurement obligation under D.21-06-035
February 25, 2022 17SCE WILDFIRE MITIGATION: APPROACH, PROGRESS, AND RESULTS
AB 10541 provides a strong regulatory construct for
determining wildfire liability and cost recovery

         Established safety Under AB 1054, SCE can obtain an annual safety certification upon submission of
 certification process and required safety information, including an approved wildfire mitigation plan
        additional wildfire
                            Safety certifications valid for 12 months and remain valid until CPUC Wildfire Safety
           safety oversight
                                                      Division acts on SCE’s request for a new safety certification

          Codified prudency Provided a utility is “safety certified,” establishes a prudency standard that assumes
     standard that assumes utility is prudent, unless intervenors create serious doubt
     utility prudency unless
                             Prudency based on reasonable utility conduct with potential for full or partial
      serious doubt created
                                                      recovery, considering factors within and beyond a utility’s control (e.g., humidity,
                                                      temperature, winds)

                                                      Standard survives even if Wildfire Insurance Fund is depleted

   Established ~$21 billion Enhances liquidity available to pay wildfire claims
   Wildfire Insurance Fund
                                                      Reimburses utility for eligible claims payments above the higher of $1 billion and
                                                      required insurance coverage

       Caps utility liability If found prudent, no requirement to reimburse fund for claims covered by fund
        exposure if utility
                              If found imprudent or partially imprudent, shareholders reimburse fund.
         found imprudent
                              Reimbursement capped if utility has valid safety certification2. The cap covers trailing
  (SCE 2022 cap: ~$3.4Bn)
                                                      three-year period and limits reimbursement to 20% of electric T&D equity rate base
                                                                                                                     3

1. California Assembly Bill 1054, executed by the governor of California on July 12, 2019
2. And has not been found to have acted with conscious or willful disregard of the rights and safety of others
3. Excluding general plant and intangibles

February 25, 2022                                                                                                                            19
AB 1054 and the Wildfire Insurance Fund provide clear
pathway to determine IOU’s prudency and ceiling on liability
AB 1054 Wildfire Insurance Fund Mechanics1
IOUs contribute $10.5 billion Customers contribute non-bypassable charge
PG&E: $4.8Bn initial + $193MM annually through 2028 Customers contribute $0.9Bn annually through 2035.
SCE: $2.4Bn initial + $95MM annually through 2028 May be directly contributed to Fund or used to support
SDG&E: $0.3Bn initial + $13MM annually through 2028 issuance of up to $10.5Bn in bonds by California DWR
Wildfire Insurance Fund
• “Covered Wildfire” means any wildfire ignited on or after July 12, 2019, caused by an electrical corporation as
determined by the governmental agency responsible for determining causation, in excess of annual utility retention
• Size of fund equal to $21.0–24.0 billion2. Currently, fund has ~$10 billion in assets as of November 30, 20213
• Funds invested/managed by California Earthquake Authority (CEA)
• Fund reimbursed if imprudent (see below right), but does not have a separate replenishment mechanism
Fund payment of “eligible claims”4 If found imprudent, IOU reimburses
• Pay out claims to claimants subject to fund Wildfire Fund up to 3-year rolling cap
CPUC
administrator approval • Liability cap of 20% of T&D Equity Rate
prudency
• Subrogation claims settled at ≤40% Base5 (~$3.4Bn for SCE for 2022) unless
determination
approved unless exceptional facts and found to have acted with conscious or
of operations
circumstances; higher amounts may be willful disregard
(serious doubt
approved by fund administrator • Liability cap lapses when fund exhausted
standard)
If found prudent, IOU does not reimburse
Wildfire Fund
1. This summary is based on Edison International’s interpretation of Assembly Bill 1054
2. Range based on whether customer charge finances DWR bonds or is contributed directly to Wildfire Fund
3. Source: California Earthquake Authority Financial Report presented at the January 27, 2022 California Catastrophe Response Council meeting
4. “Eligible claims”: claims for third-party damages from covered wildfires less annual utility retention (larger of $1.0 billion or required insurance layer per fund administrator)
5. Excluding general plant and intangibles
February 25, 2022 20Wildfire Fund Illustrated: Eligible claims paid by Fund and IOUs
reimburse up to cap only to degree found imprudent1,2
Example of Wildfire Insurance Fund operations, reimbursement, and IOU liability from a
hypothetical wildfire resulting in $5 billion of paid claims
$ in Billions; Example based on SCE’s 2022 Liability Cap
SCE does not reimburse Fund for
eligible claims1 above annual
If found aggregate retention of $1 billion
100%
prudent2
1.0 4.0 $5.0
$5 billion SCE cost
cost of paid recovery SCE’s Wildfire
Utility
claims3 application Insurance/
Shareholders
Insurance
(Wildfire Fund reimburses and CPUC Retention Fund
utility for claims paid
above IOU retention) review
1.0 3.4 0.6 $5.0
If found
100%
imprudent2 Liability cap (20% of T&D equity rate base)
reduced by IOU reimbursement on 3-year
rolling basis for subsequent events2
1. Eligible claims are those that exceed the greater of $1 billion or the amount of the utility's wildfire insurance as required by the Fund administrator. Liability cap applies unless SCE is found to have
acted with a conscious or willful disregard of the rights and safety of others
2. Costs in application may be allocated for cost recovery in full or in part considering factors within and beyond utility’s control, including humidity, temperature, and winds
3. Claims typically settle at a percentage of the asserted damages
February 25, 2022 21Many of SCE’s wildfire mitigation practices have been in
place for years and have greatly evolved since 2018
Longstanding Foundational Advance technology Update of long-term
wildfire mitigation strategy established and risk modeling system hardening
efforts at SCE in 2018–2019 capabilities strategy
Pre-2018 practices GS&RP (2018) and 2020 WMP & 2022 WMP Update
and enhancements 2019 WMP 2021 WMP Update
Fire prevention planning Grid hardening Improving wildfire risk Expanded grid hardening
- Special procedures for - Covered conductor assessments & models - Updated risk analysis for
Red Flag Warnings - Fire resistant poles - Analytical granularity covered conductor
- Automated recloser - Current limiting fuses - Transition to Technosylva deployment & targeted
(RAR) blocking on fire fire spread model undergrounding
- Additional RAR
weather days installations Inspection strategy Updating veg. mgmt. risk
Engineering and design evolution prioritization
Bolstering situational
- RARs installed to awareness capabilities - Expanded inspections - Tree risk index
sectionalize grid based on emergent fuel - Risk prioritized pole
- HD cameras
- Principles to reduce conditions brushing methodology
- Weather stations
possibility of debris Continued minimizing of Continued reduction of
contacting equipment Enhancing operational PSPS impacts PSPS impacts
practices - Sectionalization
Veg. mgmt. and other Adding new mitigation
- Extra-sensitive (“fast - Customer care programs
inspection programs strategies
curve”) relay settings
Standard operating - PSPS operational Aerial fire suppression - Transmission wires down
practices, emergency enhancements Advancing new - Vibration dampeners
planning & response, and - Expanded line clearances technologies - Secondary conductor
outreach activities during and new hazard tree - Open Phase Detection ignitions
a wildfire event program - Additional customer care
- Rapid Earth Fault Current
Limiter pilots
- Early Fault Detection
February 25, 2022 22Publicly available real-time data enhances situational
awareness and informs critical operational decisions
Cameras on ALERT Santa Ana Wildfire Emergency Operations
Wildfire Network HD Weather Stations Threat Index Center (EOC)
Live HD camera feeds Provide real-time weather Helps fire agencies and the SCE’s Emergency Operations
provide critical information data, including wind speed public prepare for a wildfire Center acts as the
to fire agencies for and gust, temperature, and threat during a high wind company’s nerve center for
effectively deploying air humidity event 24/7 planning and
and ground resources emergency response
Enables circuit-level Users can see this
monitoring to inform information in real-time to
critical operational decisions help understand threat of
wind-driven wildfires
RELATED LINKS FOR VIEWING
http://www.alertwildfire.org/orang https://www.sce.com/weatherstatio
Cameras WeathernsStations Threat Index
https://fsapps.nwcg.gov/psp/sawti
EOC Virtual Tour
https://players.brightcove.net/979328848001/
default_default/index.html?videoId=6142883
ecoca/index.html 567001
February 25, 2022 23Covered conductor is one of the most effective measures to
reduce wildfire and PSPS risks in SCE’s service area
Covered conductor is a very valuable tool to expeditiously and cost-effectively
reduce wildfire risk specific to SCE.
Undergrounding considered for certain locations based on risk profile
Geography Cost to Implement Execution Speed Unique Factors
Contact from vegetation and Covered conductor Covered conductor can be Undergrounding is considered
other objects is a key risk installation costs significantly deployed within 16–24+ where there is:
factor in much of SCE’s area lower than undergrounding months, and sometimes faster • High burn frequency
Covered conductor is very Undergrounding costs vary Undergrounding generally • Limited egress
effective in mitigating these depending on construction takes 25–36+ months • Wind speeds exceeding
risks methods, locational, and covered conductor PSPS
operational factors thresholds
Vegetation Type Cost per mile1 Actual installed miles of • Exceptionally high potential
consequence (>10,000
Evergreen Forest
Deciduous Forest $ in Millions covered conductor vs.
2
Broadleaved Forest
Chaparral hypothetical undergrounded acres)
Grassland ~5.5 miles 3
Desert Scrub
Chaparral (brushland) ~65–90%
presents different lower Covered Several hundred miles
primary risk factors
Conductor ~2,900+
than heavily forested currently under
areas ~1.5 consideration
~0.6 for additional enhanced
Under- ~A few mitigation, including
ground Hundred undergrounding
Click to view
https://library.sce.com/conten
t/dam/eix/documents/investo
rs/wildfires-document- Under- Covered
larger image
library/Wildfire_CaliforniaBiom
es.pdf
ground Conductor
1. Based on data provided in SCE’s 2022 WMP Update
2. Through December 31, 2021
3. Undergrounded miles is a hypothetical approximation of underground lines that could have been constructed through December 31, 2021, based on SCE’s assumptions and experience with planning
and executing undergrounding projects
February 25, 2022 24California has continued to increase investments in wildfire
suppression and prevention1
CAL FIRE budget support Substantial increase in Governor’s proposed budget
along with actions to wildfire suppression budget would increase funding to
increase staffing and to address shifting support firefighters,
improve effectiveness risk factors equipment and forest mgmt.
2016-17 & 2017-18 2018-19 through 2020-22 2022-23
Budget Years Budget Years Budget Year
CAL FIRE Budget2: ~$2.0bn/year ~$2.5–2.8bn/year ~$3.7bn
CAL FIRE Positions: ~6,900 ~7,180–8,769 ~10,050
Extended peak staffing period Increases to firefighting crews Additional firefighters
Began procurement process to Helicopter fleet replacement Helicopter acquisition completion
replace helicopters to enhance
initial attack effectiveness Air tanker funding Air asset expansion
Advanced modeling and analytics Wildfire & Forest
Additional year-round engines
to inform suppression strategy Resilience Strategy
(Add’l. $1.2bn across depts. and years3)
Surge capacity
Resilient Forests & Landscapes
New wildfire cameras and Wildfire Fuel Breaks
communications equipment
deployed Reforestation
Regional Investments
Fuel reduction projects
Community Hardening
$1.5 billion Wildfire & Forest Science-Based Management
Resilience Strategy3
Forest Sector Stimulus
1. Total state funding and resources for wildfire suppression and prevention are also reflected in budgets of other departments, counties, and the State Mutual Aid System
2. As initially enacted. Does not include subsequent Emergency Fund funding. 2022-23 Budget refers to the Governor’s Proposed Budget
3. Budgeted across departments and budget years. Composed of $536 million in 2020-21, $988 million in 2021-2022. The additional $1.2 billion proposed in the 2022-23 budget includes spending
during budget years 2022-23 and 2023-24. Portions of the funding for the Wildfire & Forest Resilience Strategy are captured within CAL FIRE’s overall budget and the action in this reference
February 25, 2022 25SCE’s execution of its wildfire mitigation strategy is reducing
risk of wildfires associated with utility infrastructure
2021 Completed
2021 Completed Completed/Target Since 2018
Completed/Target
110% Since 2018
400/375 107% 1,460+
Distribution 179,600/163,000 completed 764,000+ weather stations installed weather stations
Equipment inspections inspections Weather completed installed
Inspections Stations
Cameras currently provide
High-Definition visibility to about 90% of our
2021 Completed Completed
Completed/Target Since 2018 Wildfire Cameras high fire risk areas (HFRA) and Since 2018
Transmission 20,800/16,800 124% 106,900+ the planned additional 166
cameras in 2022 and beyond
Equipment inspections completed inspections cameras installed
will increase coverage to
Inspections nearly all of HFRA
SCE contributed $18 million to support the creation
Completed
2021
Since 2018
of a quick reaction force of aerial firefighting assets
Completed/Target across counties in SCE's service area to coordinate
1,500/1,000 150% 2,900+
circuit miles Aerial Fire and reach wildfires in their early stages. These
Insulated Wire circuit miles installed completed unique water and fire retardant dropping helitankers
(Covered Conductor)
installed Suppression have the capability to operate day and night
Resources
2021 Completed 2021 Completed Since
Completed/Target Since 2018 Completed/Target July 2020
350/330 106% 13,300+ 6,000/3,600
batteries provided to 167% 6,740+
fuses installed or fuses installed or batteries provided to
replaced
completed Critical Care eligible customers completed
Fast-Acting Fuses replaced eligible customers
Backup Battery
2021 Completed
Completed/Target Since 2018 64 8
131,400/120,000 110% 359,000+ sites
available
vehicles
available
Hazard Tree trees assessed completed trees assessed Community Community Crew
Management Resource Centers Vehicles
Note: Data as of December 31, 2021. Blue check marks indicate met or exceeded target
Hazard Tree Management target was adjusted from 150,000 to 120,000. Pending Q4 change order approval from Office of Energy Infrastructure Safety
February 25, 2022 26The 2021 fire season marks 3 consecutive years without a
catastrophic wildfire associated with SCE’s infrastructure1
SCE’s grid hardening and SCE’s improved PSPS California investment in
situational awareness execution and community wildfire suppression and
measures support prevention
~30% of overhead 70%+ reduction in ~45% increase in
wires in HFRA with PSPS outage time in CAL FIRE positions
covered conductor2 2021 on frequently since 20174
impacted circuits3
80%+ of circuits2
programmed with fast 6,000+ critical care 60+ aircraft in CAL
curve settings to backup batteries FIRE’s fleet — largest
protect against faults deployed in 2021 to civil aerial firefighting
1,460+ weather support customers fleet in the world4
stations providing
real-time weather data 64 Community $2.7 billion State
resource centers to budget support for
166 HD cameras provide resources and Wildfire & Forest
providing thorough support for customers Resilience Strategy4
coverage of HFRA during PSPS events
1. While there is not universal consensus on the threshold that qualifies a wildfire as “catastrophic,” both OEIS and the SB 901/AB 1054 statutory framework use the term to guide wildfire mitigation
activities and regulatory requirements. For purposes of this presentation, SCE is using OEIS’s definition of a “catastrophic wildfire,” which is as follows: A wildfire directly causing one or more deaths,
damaging or destroying more than 500 structures, or burning more than 140,000 acres of land
2. HFRA = High Fire Risk Areas; refers to distribution infrastructure in HFRA
3. Based on 2021 weather and fuel conditions
4. CAL FIRE positions based on the 2017-18 California State Budget as originally enacted and the Governor’s Proposed 2022-23 Budget. Includes all CAL FIRE positions. Source of size of CAL FIRE fleet is
CAL FIRE. Budget support for Wildfire & Forest Resilience Strategy includes $1.5 billion included in the 2021-22 state budget and $1.2 billion included in the Governor’s Proposed 2022-23 Budget
February 25, 2022 27SCE has made substantial progress on grid hardening and
situational awareness measures
Investments to harden the grid and enhance situational awareness targeted through 2023
Green shading represents completed measures through December 31, 2021, as proportionate to the 2023 forecast in
SCE’s 2022 WMP Update filed on February 18, 2022
Targeted
by 2023
Overhead Distribution
Covered 56% ~5,330 Lines in HFRA
Conductor circuit miles Circuit Miles
Total Covered
Fast-Acting Miles To-Date1
94% ~14,270
Fuses Tier 3 ~5,700 ~2,110
Tier 2 ~4,000 ~870
Sectionalizing Total
82% 174 ~9,700 ~2,980
Devices HFRA
SCE has focused on
Wildfire 85%
deploying covered
196 conductor on the highest-
Cameras
risk circuits first to
expeditiously reduce
Weather 86% wildfire risk
~1,708
Stations
1. About 200 circuit miles of covered conductor of storm restoration work was distributed evenly between the tiers
February 25, 2022 28SCE is making meaningful progress in mitigating wildfire risk
for its customers
Covered Expanded High fire risk Today’s PSPS use
conductor has vegetation inspection would have
reduced faults, management program has prevented majority
which could lead and tree removal reduced of damage from
to ignitions has reduced faults remediation needs past wildfires
71% 52% 66% >90%
fewer fewer lower reduction
faults on fully tree-caused defect find of structures
covered circuits1 faults2 rate3 damaged4
On segments where SCE has covered bare wire, there has not been
a CPUC-reportable ignition from the drivers that covered
conductor is expected to mitigate
1. Measured by faults covered conductor is expected to mitigate per 100 circuit miles on fully covered circuits as compared to bare circuits in 2021 in HFRA
2. Measured by average monthly tree caused circuit interruptions in HFRA in 2020–2021 as compared to the average from 2015–2019
3. Measured as Total Defect Find Rate (percentage of inspections) in 2021 as compared to 2019 (inception of program) for structures inspected every year
4. Measured as structures damaged or destroyed in wildfires greater than 1,000 acres associated with SCE’s infrastructure during 2015–2020, using red flag warning days as a proxy for PSPS conditions.
Please note, however, that a red flag warning, alone, would not necessarily result in a decision to implement a PSPS
February 25, 2022 29SCE estimates its wildfire mitigation and PSPS have reduced
probability of losses from catastrophic wildfires by ~65-70%1,2
SCE expects to further reduce risk and decrease the need for PSPS with continued grid
hardening investments
Pre- Q4 PSPS
2018 2021 Estimated Risk Reduction Contribution
Decreasing
dependency
Annual Risk of ≥$1.0 ~65% reduction on PSPS
~7.6% ~2.6% in estimated probability of accessing
billion loss3 the Wildfire Fund
vs. 55% as of Q2 2021 30%
of total risk
reduction
Risk of ≥$3.5 billion ~70% reduction
drawn from Fund ~4.2% ~1.3% in estimated probability of exceeding
vs. 40% as of
over 3 years3 AB 1054 liability cap
Q2 2021
vs. 65% as of Q2 2021
1. Baseline
1. Baselineriskriskestimated
estimated by RMS
by Risk using itsSolutions,
Management wildfire Inc.
model,
(RMS)the location
using of SCE’s
its wildfire model,assets,
relyingand SCEfollowing
on the reported ignitions
data providedfrom 2014-2020.
by SCE: the location Risk reduction
of SCE’s assets, calculated by applying
reported ignitions SCE-
from 2014–
2020, mitigation
provided effectiveness
mitigation and locations
effectiveness of installedof
and locations covered conductor,
covered tree removals,
conductor, inspections,
tree removals, line clearing,
inspections, lineand PSPS de-energization
clearing, and PSPS. Range criteria
may vary for other loss thresholds
2.
2. There are risks
Includes 50,000inherent in the simulation
year-long simulations analyses,
using models
20 years andofpredictions
weather and of SCE
fireand RMS relating
modeling to the likelihood
weighted of and
for the last damage
5 years due to wildfires.
to reflect As with anyand
recent experience simulation analysis or model
climate-change related
impacts
to physical systems, particularly those with lower frequencies of occurrence and potentially high severity outcomes, the actual losses from catastrophic wildfire events may differ from the results of
3. the
Annual losses represent potential claims resulting from wildfire. Total
simulation analyses and models of RMS and SCE. Range may vary for other loss thresholds
potential insured losses, such as damages to assets of homeowners and businesses, estimated by RMS,
and uninsured
3. Includes losses, such
(i) total potential as losses
insured personal injury,byfire
estimated suppression,
RMS, and (ii) totaland damage
potential to publicly-owned
uninsured losses estimatedassets
by SCEestimated by SCE based
based on management on management
experience experience
and consultation and judgment
with insurance industry
4. experts.
Fund refers
“Fund” torefers
AB 1054
to CAWildfire
AB 1054 Insurance Fund. SCE
Wildfire Insurance Fund.used the one-year
SCE used RMS lossalong
RMS loss estimates estimates
with itswith its estimates
estimates of uninsured for losses
the size of uninsured
to quantify losses to
the reductions quantify the
in estimated reduction
probability. in
Q4 2021
probability
results of experiencing
now include a “Post Loss$3.5 billion inFactor”
Amplification losseswhich
overaccounts
a three-year period, excess
for dimensions of $1 billion
like post-event resourceaggregate each
scarcity (e.g., year,
labor, after which the AB 1054 liability cap would apply
materials)
February 25, 2022 30FINANCIAL INFORMATION
SCE has significant capital expenditure opportunities driven
by investments in the safety and reliability of the grid

Capital deployment expected to increase beyond the current                                                                            Total 2021–2025 capital plan of
GRC cycle and will be proposed in future applications                                                                                 $27–30 billion driven by
Capital Expenditures, $ in Billions                                                                                                   investments in safety and
 Future Requests1                                                                                                                     reliability

                                                                                                                 6.8                  GRC track 1 and other approvals
                                             6.2                                          6.0                                         underpin spending through 2023
                                                                5.5–5.7
                      5.4
                                                                                                                                      Primary 2023+ potential:
                                                                                                                                        – Deployment of incremental
                                                                                                                                          miles of covered conductor3
                                                                                                                                        – Investment to support
                                                                                                                                          infrastructure replacement
                                                                                                                                          and load growth
                                                                                                                                        – Transmission and energy
                                                                                                                                          storage investments to meet
                                                                                                                                          long-term state GHG targets
Range                2021                  2022                   2023                   2024                  2025
Case2                 n/a                   6.0                    5.2                    5.2                   5.2
1. Forecast for 2024 includes amounts expected to be requested in track 4 of SCE’s 2021 GRC. Forecast for 2025 includes amounts currently expected to be requested in SCE’s 2025 GRC filing.
   Additionally, reflects non-GRC spending subject to future regulatory requests beyond GRC proceedings and FERC Formula Rate updates
2. Annual Range Case capital reflects variability associated with future requests based on management judgment, potential for permitting delays and other operational considerations; GRC forecast is
   in line with authorized spend over the 2021 GRC track 1 cycle
3. The final decision in track 1 of SCE’s 2021 GRC established a cost recovery mechanism that would allow SCE to install additional covered conductor miles above the 4,500 circuit-mile level approved
   in the decision, including within the track 1 GRC period, subject to after-the-fact reasonableness review

February 25, 2022                                                                                                                                                                                         32
2021 GRC track 1 decision provides rate base visibility
through 2023; future applications expected to extend growth
From a 2021 base, rate base growth forecast of 7–9% Forecast includes recovery of
through 2025, reflecting future incremental investment utility-owned storage for
Rate Base1 $ in Billions summer 2022 reliability and SCE’s
Future Requests building electrification request
~9%
2021–2025 CAGR 49.4 Substantial longer-term rate base
46.0
growth potential from:
41.3–41.8
38.7 – Deployment of incremental
35.3 miles of covered conductor3
– Investment to support
infrastructure replacement
and load growth
– Transmission and energy
storage investments to meet
long-term state GHG targets
Range 2021 2022 2023 2024 2025
Case2 n/a 38.5 41.2 43.8 46.6
1. Weighted-average year basis. Excludes rate base associated with ~$1.6 billion of wildfire mitigation-related spend that shall not earn an equity return under AB 1054
2. Range Case rate base reflects capital expenditure Range Case forecast
3. The final decision in track 1 of SCE’s 2021 GRC established a cost recovery mechanism that would allow SCE to install additional covered conductor miles above the 4,500 circuit-mile level approved
in the decision, including within the track 1 GRC period, subject to after-the-fact reasonableness review
February 25, 2022 33SCE’s long-term growth drivers are highly aligned with
California’s public policy goals
Overarching Goals SCE Growth Drivers
Sustained investment required to reach
Infrastructure
and maintain equilibrium replacement
Safe, Reliable, and Replacement
rate
Affordable
Electricity Service Significant investment in infrastructure
Wildfire
and practices that mitigate wildfire risk,
Mitigation
and bolster prevention and response
Accelerate the adoption and
Grid
integration of renewables and other
Modernization
distributed energy resources
Electrification of Investments to support electrification
Transportation of light-, medium-, and heavy-duty
Decarbonization of and Other Sectors vehicles, buildings, and other sectors
California
Energy storage essential to increasing
Energy Storage
carbon-free generation and reliability
Future needs to meet renewables and
Transmission clean energy mandates driven by
CAISO planning process
February 25, 2022 34Cash flow from memo account recovery and securitization
strengthens our balance sheet and credit metrics
GRC, Uncollectibles, Wildfire-related, and Wildfire Insurance Applications
$ in Millions
Approved Applications
Balance @ Recovery Rate Recovery by Year
Application / Account Dec. 31 Through 2022 2023 2024 2025
GRC Track 1 (Jan.–Sept. 2021 Balance) 642 Dec. ’23 321 321 – –
GRC Track 2 401 Feb. ’25 111 134 134 22
2020–2021 Residential Uncollectibles 1 193 Feb. ’25 129 34 26 4
WEMA1 189 Dec. ’22 189 – – –
2019 CEMA 62 Dec. ’22 62 – – –
Total 1,487 812 489 160 26
Pending & Future Applications (Subject to CPUC Authorization)
Expected Expected Rate Recovery by Year3
Application Request2 Amort.2 2022 2023 2024 2025
GRC Track 3 497 12 months 290 207 – –
WEMA2 215 12 months 125 90 – –
2022 CEMA (to be filed)4 212 12 months – – 212 –
2021 CEMA 132 12 months – 77 55 –
Total 1,056 415 374 267 –
Expected Securitizations5
AB 1054 Capital Included In: Amount 2022 2023 2024 2025
GRC Tracks 1 & 2 (completed) 518 518 – – –
GRC Track 3 730 – 730 – –
Total 1,248 518 730 – –
1. 2020–2021 Residential Uncollectibles are tracked in a balancing account authorized by the CPUC and implemented in rates without a separate application
2. Requested revenue requirement for GRC track 3, WEMA2, 2022 CEMA, and 2021 CEMA; and securitization of AB 1054 capex for GRC tracks 1–3. Amounts and amortization subject to CPUC approval
3. Actual timing will depend on the timing of CPUC authorizations and implementation in customer rates or execution of securitization transactions
4. In 2022, SCE expects to file CEMA requests for 2020 Emergency Wildfire Restoration for recovery of amounts incremental to authorized revenue requirements. Final requested amount may change
5. Amounts reflect capital costs recovered upfront via securitization. Recovery in customer rates of costs to service the bonds takes place over the tenor of the debt at a fixed recovery charge rate
February 25, 2022 352017/2018 Wildfire/Mudslide Events Update: Less than 22%
of best estimate remains
SCE continues to make substantial progress resolving claims1 SCE has not admitted wrongdoing
Remaining expected potential losses, $ in Billions or liability as part of any
settlements
7.5
California Attorney General's
Office completed investigation of
Less than 22% of best Thomas Fire and Woolsey Fire
estimate remains to be without pursuing criminal charges
resolved
SCE will seek CPUC recovery
of prudently-incurred, actual
losses in excess of insurance2
1.6
– SCE may seek recovery of
2017 and 2018 events in
separate applications
Best Estimate of Remaining Expected
Total Losses Potential Losses
1
(At 12/31/2021)
1. After giving effect to approximately $131 million in fixed payments due under settlements executed before December 31, 2021, but not paid at December 31, 2021. In addition, the CPUC approved
the SED Agreement in December 2021, but its approval has been legally challenged. SCE's obligations under the SED Agreement will only commence after CPUC approval of the SED Agreement is
final and non-appealable
2. Other than for CPUC-jurisdictional rate recovery of the $375 million of losses foreclosed from cost recovery if the agreement with the Safety and Enforcement Division of the CPUC becomes final and
non-appealable
February 25, 2022 36You can also read