Building Trust through Execution - March 2022 - Seeking Alpha
←
→
Page content transcription
If your browser does not render page correctly, please read the page content below
Building Trust through Execution
           March 2022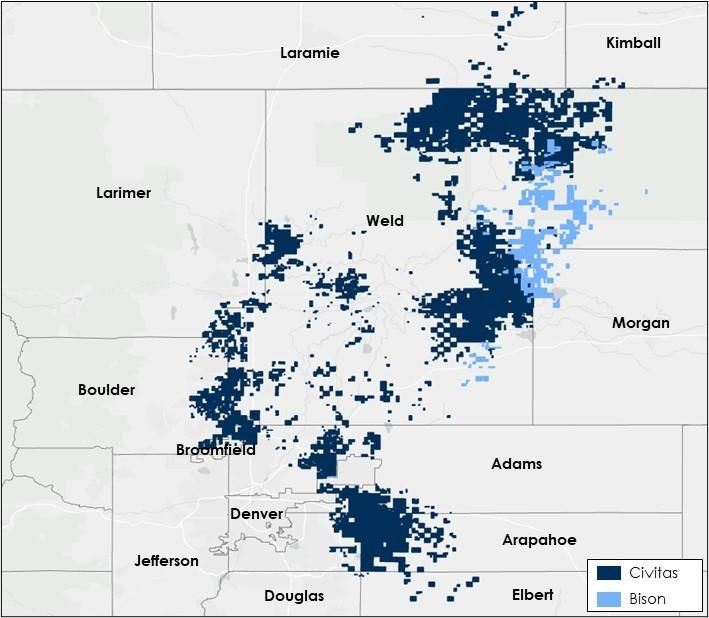
Cautionary Statement Regarding Forward-Looking Statements
and Important Disclosures
Forward-Looking Statements and Cautionary Statements
Certain statements in this presentation concerning future opportunities for Civitas, future financial performance and condition, guidance and any other statements regarding Civitas’ future expectations, beliefs, plans, objectives, financial conditions,
assumptions or future events or performance that are not historical facts are “forward-looking” statements based on assumptions currently believed to be valid. Forward-looking statements are all statements other than statements of historical facts.
The words “anticipate,” “believe,” “ensure,” “expect,” “if,” “intend,” “estimate,” “probable,” “project,” “forecasts,” “predict,” “outlook,” “aim,” “will,” “could,” “should,” “would,” “potential,” “may,” “might,” “anticipate,” “likely” “plan,”
“positioned,” “strategy,” and similar expressions or other words of similar meaning, and the negatives thereof, are intended to identify forward-looking statements. Specific forward-looking statements include statements regarding Civitas’ plans and
expectations with respect to the Transactions and the anticipated impact of the Transactions on Civitas’s results of operations, financial position, growth opportunities and competitive position. The forward-looking statements are intended to be
subject to the safe harbor provided by Section 27A of the Securities Act of 1933, as amended, Section 21E of the Securities Exchange Act of 1934, as amended, and the Private Securities Litigation Reform Act of 1995.

These forward-looking statements involve significant risks and uncertainties that could cause actual results to differ materially from those anticipated, including, but not limited to, Civitas’ future financial condition, results of operations, strategy and
plans; the ability of Civitas to realize anticipated synergies in the timeframe expected or at all; changes in capital markets and the ability of Civitas to finance operations in the manner expected; the effects of commodity prices; and the risks of oil
and gas activities. Additionally, risks and uncertainties that could cause actual results to different materially from those anticipated also include general economic conditions, whether internationally, nationally or in the regional and local market
areas in which we do business; the effects of disruption of our operations or excess supply of oil and natural gas due to the COVID-19 pandemic and the actions by certain oil and natural gas producing countries; the scope, duration and severity of
the COVID-19 pandemic, including any recurrence, as well as the timing of the economic recovery following the pandemic; ability of our customers to meet their obligations to us; our ability to generate sufficient cash flow from operations,
borrowings, or other sources to enable us to fully develop our undeveloped acreage positions; the presence or recoverability of estimated oil and natural gas reserves and the actual future sales volume rates and associated costs; uncertainties
associated with estimates of proved oil and gas reserves; the assumptions underlying forecasts, the assumptions underlying forecasts, including forecasts of production, well costs, capital expenditures, rates of return, expenses, cash flow and cash
flow from purchases and sales of oil and gas; the possibility that the industry may be subject to future local, state, and federal regulatory or legislative actions (including additional taxes and changes in environmental regulation); environmental risks;
seasonal weather conditions; drilling and operating risks, including the risks associated with the employment of horizontal drilling and completion techniques; our ability to acquire adequate supplies of water for drilling and completion operations;
availability of oilfield equipment, services, and personnel; exploration and development risks; competition in the oil and natural gas industry; our ability to secure adequate processing capacity for natural gas we produce, to secure adequate
transportation for oil, natural gas, and natural gas liquids we produce, and to sell the oil, natural gas, and natural gas liquids at market prices; continued hostilities in the Middle East, South America, and other sustained military campaigns or acts of
terrorism or sabotage; and other economic, competitive, governmental, legislative, regulatory, geopolitical, and technological factors that may negatively impact our businesses, operations, or pricing. Expectations regarding business outlook,
including changes in revenue, pricing, capital expenditures, cash flow generation, strategies for our operations, oil and natural gas market conditions, legal, economic and regulatory conditions, and environmental matters are only forecasts
regarding these matters.

Additional information concerning other risk factors is also contained in Civitas’ most recently filed Annual Report on Form 10-K, Quarterly Reports on Form 10-Q, Current Reports on Form 8-K and other Securities and Exchange Commission (“SEC”)
filings.

All forward-looking statements speak only as of the date they are made and are based on information available at that time. Civitas does not assume any obligation to update forward-looking statements to reflect circumstances or events that
occur after the date the forward-looking statements were made or to reflect the occurrence of unanticipated events except as required by federal securities laws. As forward-looking statements involve significant risks and uncertainties, caution
should be exercised against placing undue reliance on such statements.

Non-GAAP Measures
To provide investors with additional information in connection with our results as determined in accordance with generally accepted accounting principles in the United States (“GAAP”), we disclose certain non-GAAP financial measures. The non-
GAAP financial measures include Net Debt, Adjusted EBITDAX, PV10, free cash flow and related calculations. We believe the non-GAAP financial measures provide users of our financial information with additional meaningful comparisons between
the current results and results of prior periods, as well as comparisons with peer companies. These non-GAAP financial measures are not measures of financial performance in accordance with GAAP and may exclude items that are significant in
understanding and assessing our financial results. Therefore, these measures should not be considered in isolation or as an alternative or superior to GAAP measures. You should be aware that our presentation of these measures may not be
comparable to similarly-titled measures used by other companies. Reconciliations of each non-GAAP financial measure to the applicable most comparable GAAP measure can be found in the Appendix section of this presentation.

                                                                                                                                                                                                                                                               1
Delivering on All Aspects of the New E&P Business Model
Pure Play DJ Basin Operator
                                                                                                                 High Quality Asset Base Delivers Low F&D Costs
                                                                                                    ✓            High-return, low-cost wells across DJ Basin asset base

                                                                                                                 Low-Cost Operations Enable Significant FCF Generation
                                                                                                    ✓            Sub-$4.00/boe LOE + cash G&A underpins over 20% FCF yield(1)

                                                                                                                 Fortress Balance Sheet and Operational Flexibility
                                                                                                    ✓            ~0.2x net leverage and minimal midstream commitments

                                                                                                                 Returning Capital to Shareholders
                                                                                                    ✓            Base dividend of $1.85/sh annually and significant variable dividend

                                                                                                                 Undergoing Opportunistic Consolidation
                                                                                                    ✓            Bison assets acquired at discount to PDP PV-12 and 1.6x 2022E EBITDA(2)

                                                                                                                 Leading-Edge Corporate Governance
                                                                                                    ✓            100% of executive incentive compensation in stock, 75% based on share
                                                                                                                 price performance

                                                                                                                 Industry-Leading Commitment to Sustainability
                                                                                                    ✓            First carbon neutral E&P operator in Colorado

                  (1)   Reflects unhedged free cash flow at $75/bbl (WTI) and $4.00/mmbtu (Henry Hub) pricing. See slide 6 for free cash flow yield definition.
                  (2)   Based on February 25, 2022 NYMEX strip pricing. Bison acquisition closed on March 1, 2022.
                                                                                                                                                                                           2
High Quality Asset Base
Contiguous acreage position facilitates development optimization
                                   Approximate                                                                                                       Civitas Leasehold Positions
 Development Area                                                                  Geography
                               DJ Basin Net Acres(1)

     Western                              160,000                             Suburban / Rural
                                                                                                                                                          Northern
     Eastern                              124,000                                        Rural

     Southern                             105,000                             Suburban / Rural                                                    Western

     Northern                             128,000                                        Rural

                Combined Q4 2021 Production Mix(2) (%)

                 26%                                                                                                                                                               Eastern
                                                                                   Oil
                                          40%                                                                                                                                 Southern
                        153.5
                                                                                   Gas
                       MBoe/d

                                                                                   NGL

                   33%

                    (1)   Net acres as of December 31, 2021, adjusted to include ~35,000 net acres from Bison acquisition.
                    (2)   Represents the combined Q4 2021 Civitas production from all predecessor companies - BCEI, XOG, and Crestone. Excludes Bison 2021 volumes.
                                                                                                                                                                                             3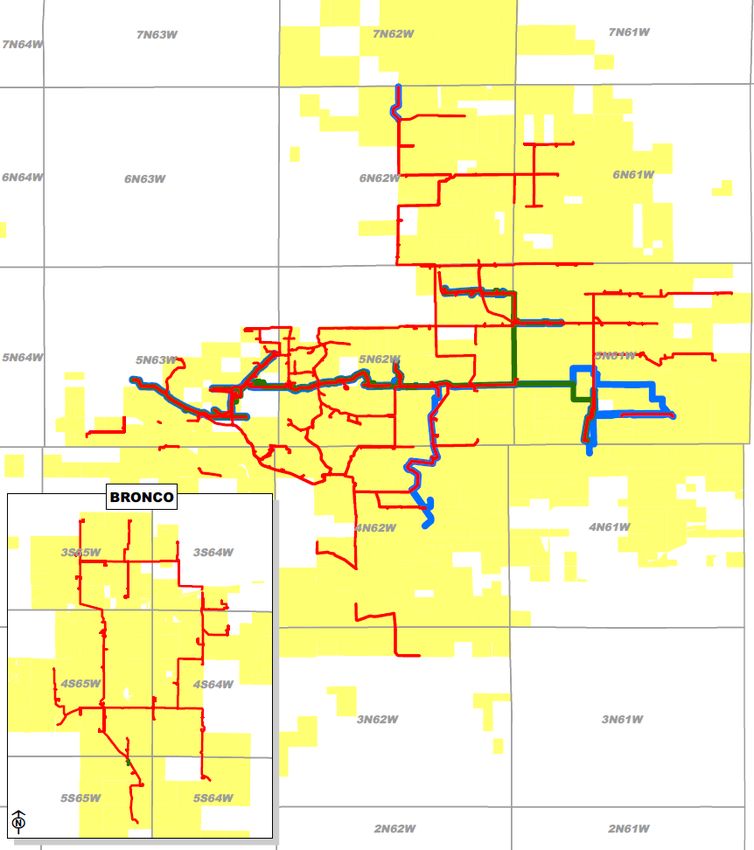
High Quality Asset Base
High-return wells across acreage position
                                                                             B-TAX Single Well IRRs at $55 WTI
           100%                                                                      Southern                Western                 Eastern

           90%
                                                                                                                                                                           Undeveloped Locations by Area
           80%
                                                                                                                                             Area                             Total           % of Total   Weighted Avg. IRR
           70%                                                                                                                               Southern                            407            42%              43%
                                                                                                                                             Western                             301            31%              66%
           60%                                                                                                                               Eastern                             256            27%              29%
 IRR (%)

                                                                                                                                              Total                              964            100%             46%
           50%

           40%

           30%

           20%

           10%

            0%
                  0     100                     200                     300                   400          500           600                                               700            800              900
                                                                                            Gross Operated Future Locations

                                                 Robust, highly economic inventory of ~1,000 gross operated locations (1)(2)

                      Note: Single well economics valued at $55/bbl (WTI) / $2.75/mmbtu (Henry Hub) / NGL realizations of 40% of WTI. Average lateral length of ~8,900’.
                      (1) As of December 31, 2021. Includes 102 locations from the Bison acquisition.
                      (2) As of January 31, 2022 Civitas had 268 fully approved well permits. The Bison acquisition adds 38 permits.
                                                                                                                                                                                                                           4
Midstream Ownership                                                                                    Civitas Midstream Infrastructure

Expands upstream returns                                                                          Eastern

• Total book value of ~$300mm

• Infrastructure focused on operated production and results in lower differentials and
  transportation expense

                 315 MMcf/d of gas gathering capacity
      Eastern

                 280 miles of gas gathering, gas-lift, and sales lines
                 26 pipeline interconnects to 5 midstream gas processors
                 22 centralized compressor sites, 67,000 total centralized hp
Gas

      Southern

                 Compressor stations - Pony 5,500hp & Mustang 5,600hp
                                                                                                  Southern
                 Optional phase II expansion at Mustang of 30 MMcf/d                                   Pony Compressor
                                                                                                            Station

                                                                                          Mustang
                                                                                         Compressor
      Oil line to NGL (Riverside), Taproot (Buckingham), Black Diamond                     Station

      5 CPFs with total 77 Mbo/d capacity                                                                                            CIVI Leasehold
Oil

                                                                                                                                     Compressor Station
      35 miles of total oil gathering
                                                                                                                                Pipeline
      Building new oil gathering system in Southern area in 2022                                                                     Oil
                                                                                                                                     Oil – Under Construction
H2O

                                                                                                                                     Gas
      54 miles of water gathering/delivery connected to three 3rd party disposal wells
                                                                                                                                     Water

                                                                                                                                                            5
Low-Cost Operations Enable Significant FCF Generation
Peer-Leading Operating Cost ($/Boe)                                     (1)(2)                                           Oil Price vs. Estimated 2022 FCF Yield (3)(4)

                               Operating Costs ($/Boe)                   % Oil                         $10.73                                          $1,500                                                                             35%
                                                                                            $10.28

                                                                                                                                Free Cash Flow ($MM)

                                                                                                                                                                                                                                                Free Cash Flow Yield
                                                                                                                                                                                                                                          30%
                                                                                 $8.29
                                             $7.47       $7.62       $7.65                                                                             $1,000
                                                                                                                                                                                                                                          25%
                                   $6.40
                    $6.05
                                                                                                                                                                                                                                          20%
                                                                                                                                                        $500
   $3.85   $3.94
                                                                                                                                                                                                                                          15%

                                                                     80%
                                                                                                                                                          $0                                                                              10%
                                                                                  64%                    65%
                     57%                                  55%                                53%                                                                      $65 WTI                 $75 WTI               $85 WTI
   45%                             45%        44%
            33%
                                                                                                                                                                Hedged Free Cash Flow                   Unhedged Free Cash Flow
    CIVI   Peer A   Peer B     Peer C       Peer D      Peer E      Peer F       Peer G     Peer H      Peer I
                                                                                                                                                                Hedged Free Cash Flow Yield             Unhedged Free Cash Flow Yield
   2022E

  • Relentless focus on controllable cash operating costs                                                                     • Attractive 2022E unhedged free cash flow yield of >20%
    (lease operating expense and cash G&A expense                                                                               at $75/bbl flat pricing
    highlighted in chart)
                                                                                                                              • 2022E reinvestment rate is higher than target due to
  • Low-cost structure and oily mix enhances recycle ratio                                                                      continuing the Bison 2022 development program. Civitas
    and corporate level returns                                                                                                 expects to bring reinvestment rates in line with target in
                                                                                                                                2023, further increasing FCF yields

                             (1)    Represents reported Q4 2021 lease operating expense and cash G&A for all peers except for Peer D and Peer F, which represent reported Q3 2021 metrics due to Q4 2021 metrics not yet reported.
                             (2)    Oil-Weighted peers include CDEV, CPE, ESTE, MGY, MTDR, MUR, OAS, PDCE, and ROCC.
                             (3)    Free cash flow yield represents 2022E operating cash flow before working capital changes less capital expenditures divided by CIVI’s market capitalization as of February 25, 2022, with 85 MM shares outstanding.
                                                                                                                                                                                                                                                                       6
                             (4)    Free cash flow metrics include Bison. Price decks assume $4.00/mmbtu (Henry Hub) and NGL realizations of 40% of WTI.
Fortress Balance Sheet
($ in millions)
Pro Forma Capitalization as of 3/1/22                                             PF For Bison Key Highlights:
Rev olv ing Credit Facility ($1bn BB; $800 ECA)                                             $0 • PDP coverage of ~11x total debt
7.5% Senior Unsecured Notes due April 2026                                                 100
5.0% Senior Unsecured notes due October 2026                                               400 • Financial policy and goals include:
Total Debt                                                                               $500
(-) Cash                                                                                  (136)     • Maintaining production with reduced reinvestment rates
Net Debt                                                                                 $364
                                                                                                    • Operate at front end of cost curve
Pro Forma PDP PV-10
          (1)                                                                                                         • Maintain low leverage, with a target of 0.5x Debt to
PDP PV-10                                                                                ~$5,300
                                                                                                                        EBITDAX

Credit Statistics                                                                                                     • Prioritize cash returns to shareholders
PDP PV-10 / Total Debt                                                                        10.6x
PDP PV-10 / Net Debt                                                                          14.6x
                                 (2)
Net Debt / 2022E Hedged EBI TDAX                                                               0.2x
                                     (2)
Net Debt / 2022E Unhedged EBI TDAX                                                             0.2x
                    (3)
Liquidity ($800 ECA)                                                                          $924

                   Note: “BB” refers to “Borrowing Base” and “ECA” refers to “Elected Commitment Amount.”
                   (1) Reflects year-end 2021 PDP PV-10 with an effective date of December 31, 2021 at $75/bbl (WTI) / $4.00/mmbtu (Henry Hub) pricing.
                   (2) 2022E EBITDAX reflects $75/bbl (WTI) / $4.00/mmbtu (Henry Hub) pricing.
                                                                                                                                                                               7
                   (3) Liquidity adjusted for ~$13 MM in letters of credit.
Returning Capital to Our Shareholders
Stockholder Return Philosophy                                                                                  2022E Dividend Yield(1)
• Quarterly base dividend: $0.4625/share to be paid on 3/30 to                                                     10.2%
                                                                                                                                                                                                     Base         Variable
                                                                                                                             9.9%
  shareholders of record on 3/18                                                                                                       9.4%

                                                                                                                                              7.2%
                                                                                                                                                     6.6%   6.5%
     • Peer-leading 3.9% base              yield(1)                                                                 6.3%
                                                                                                                             7.2%      7.1%
                                                                                                                                                            3.7%
                                                                                                                                              6.1%
     • Potential to increase based on synergies from future                                                                                          5.2%
                                                                                                                                                                    1.9%   1.8%     1.8%   1.8%   1.8%
       consolidation                                                                                                3.9%
                                                                                                                             2.6%      2.3%                 2.8%                                           0.4%      0.1%
                                                                                                                                              1.2%   1.4%

                                                                                                                    CIVI     CTRA      CHK    DVN    PXD      EOG   MGY    OAS      MUR    FANG   PDCE    MTDR        SM
• First quarterly variable dividend: $0.75/share to be paid on
  3/30 to shareholders of record on 3/18:
                                                                                                               Dividend History
     • 50% of Civitas’ 2021 combined 12-month average
                                                                                                                     Base     Variable                                                                   $1.2125
       quarterly free cash flow

     • See appendix for additional calculation detail                                                                                                                                                    $0.7500

                                                                                                                                                                              $0.4625                    $0.4625
                                                                                                                             $0.3500                  $0.3500

                                                                                                                              2Q21                     3Q21                       4Q21                    1Q22

                   Source: Market data per Eikon as of February 25, 2022.
                   Note: All figures are pro forma for any acquisitions or transactions, where applicable.
                   (1) Based on 2022E fixed and variable distributions per share and share prices as of February 25, 2022.
                                                                                                                                                                                                                             8
Firm Believers in Opportunistic Consolidation
• Civitas will continue to be a disciplined transaction partner                                                                 DJ Basin Acreage Summary
                                                                                                                                  Laramie                           Kimball
     • Focus on value creation and accretion

     • Increase efficiencies with economies of scale

     • Operating expertise across the basin                                                                                                 Weld

                                                                                                                Larimer
     • Maintain low pro forma leverage with a through cycle target of 0.5x

     • Focus on offsetting acreage and operatorship

• Bison acquisition case study
                                                                                                                                                              Morgan

     • Total consideration of 1.6x 2022E EBITDA is a discount to PDP PV-12                                    Boulder
       with no consideration given to 102 undeveloped locations

     • 38 drill-ready permits                                                                                    Broomfield                                   Civitas (1)

                                                                                                                                                              Bayswater
     • Accretive to NAV, 2022E production, EBITDA and FCF                                                                                          Adams
                                                                                                                                                              Confluence
                                                                                                              Jefferson Denver
     • No incremental G&A                                                                                                                          Arapahoe   Mallard

                                                                                                                                                              PDC (2)
     • Pro forma leverage of 0.2x                                                                                             Douglas               Elbert    Verdad

                   Source: Enverus.
                   (1) Includes leasehold from Bison acquisition.
                   (2) Pro forma acreage for PDC Energy’s announced acquisition of Great Western Petroleum.
                                                                                                                                                                              9
Reducing Operational Emissions
“Through our
Civitas is committed to driving down operational emissions through the use of commitment to highly
innovative best management practices and implementation of new technologies(1) responsible operations,
we will work to produce
energy in a way that is
safe, efficient, and
environmentally
sustainable while
meeting the world’s
Zero routine flaring in Electric rigs, Tier IV Closed-loop 70% liquids produced
all new developments and eFrac Tank Gauging at facilities with non- energy demands.”
completion fleets emitting pneumatics
- Ben Dell, Chairman
Use pipelines where Utilize NextGen Facilities designed to Monthly LDAR
feasible (transport oil flowback to pipeline mitigate maintenance and daily visual
and water) infrastructure emissions inspections
(1) Emissions reduction mitigation measures implemented where technologically, economically and practicably feasible.
10Demonstrating Climate Leadership
Colorado’s first carbon neutral energy producer (Scope 1 & 2 basis) 2020 GHG Intensity (mt CO2e/MBOE)
• Eliminate operational emissions as first priority 29.5
• Offset remaining Scope 1 emissions using only certified offset credits 24.9
• All credits sourced from largest and most credible registries: Gold
Standard, Verra, ACR, CAR
14.1
• Offset Scope 2 emissions using only Green-e certified RECs 12.9
• All RECs sourced to date from the Rockies sub-grid region as a best
6.7
practice
• Move Scope1 emissions to Scope 2 wherever possible, consistent with
energy transition goals
Peer 1 Peer 2 Peer 3 Civitas Peer 4
Source: 2020 EPA Subpart W Data.
11Valuing Community Engagement
Civitas Community Fund Plugging Colorado’s Orphaned Wells
• Civitas is focused on remaining a trusted, engaged partner in our Civitas committed to plugging all orphaned wells in
communities the Greater Denver Area and Northern Front Range of
• The Civitas Community Fund will source revenue from specific Colorado
developments that will provide community project grants and
scholarships with special dispensation for community members Abandoned by former operators whose clean-up
located closest to our operations would otherwise be the responsibility of the state of
Colorado
Developing Community Solar Investing in EV Transition
• Civitas is forming a • Civitas has committed to When wells are left unplugged, they can emit
partnership to develop installation of electric vehicle greenhouse gases such as methane and carbon
community solar gardens charging stations in the dioxide, which amplify the effects of climate change
throughout Colorado’s Front communities where we
Range operate
“We are proud to eliminate these wells for the benefit of the
• These initiatives will reduce • We have begun converting communities where we live and work”
utility costs for neighboring our own work fleet to EV
subscribers and help hybrid utility vehicles and EVs,
Colorado meet its renewable saving emissions and costs
energy goals
12Leading-Edge Corporate Governance
• Director service compensated in stock • Diversity of gender, race and industry experience
and held through duration of service
• Annual board elections • Dedicated ESG Board Committee
Brian Steck Howard Willard III
Ben Dell Carrie Fox Independent Director Independent Director
Chairman of the Board Independent Director Chair, Nomination & Chair, Compensation
Governance Committee Committee
Morris Clark Carrie Hudak James Trimble Jeffrey Wojahn
Independent Director Independent Director
Independent Director Independent Director
Chair, Audit Committee Chair, ESG Committee
132022 Guidance
Production • D&C program reflects ~3.5 rigs / ~3 frac crews
Total Production (MBoed) 156 – 167
• Expected oil price differential of -$6.00/Bbl relative to WTI
Oil Production (MBbld) 69 – 75
• CIVI does not expect to pay cash income tax in 2022 at
% Liquids 68 – 70% $75/Bbl WTI oil and $4.00/MMBtu Henry Hub gas prices
Unit Costs ($/Boe, unless stated) • Guidance includes Bison acquisition which closed on March
1, 2022
Lease Operating Expense $2.50 – 2.75
Gathering, Transportation & Processing $3.25 – 3.50 2022E Operated Development Schedule
Midstream Operating Expense $0.50 – 0.60 Gross Horizontal Wells Drilled 190-210
Recurring Cash G&A ($ in millions) $70 – 75 Average WI% / Lateral Length 82% / 2.1 miles
Production Taxes (% of revenue) 8 – 9% Gross Horizontal Wells Completed 165-175
Capital Expenditures ($ in millions) Average WI% / Lateral Length 83% / 2.2 miles
Drilling & Completion $825 – 950 Gross Horizontal Wells Brought Online 155-165
Land, Midstream and Other $70 – 90 Average WI% / Lateral Length 85% / 2.0 miles
Note: Guidance assumes $75/bbl (WTI) and $4.00/mmbtu (Henry Hub) pricing.
14Appendix
Q1-2022 Dividend Calculation
• Quarterly base dividend of $0.4625/share                                                          Q1 2022 Total Dividend Calculation ($MM)
                                                                                                                                               (1)

• Quarterly variable dividend framework
                                                                                                                                                               (2)
                                                                                                    Av erage Quarterly Free Cash Flows Ov er Prior 12 Months          $167
     • 50% of FCF (before changes in working capital
       and after base dividend)                                                                     Less: Quarterly Base Div idend                                    ($39)
     • Based on average quarterly FCF over prior 12
       months                                                                                       Av erage Quarterly Free Cash Flow After Base Div idend            $128

     • To be paid in combination with base dividend,                                                Variable Div idend: 50% Payout                                    $64
       commencing March 2022
                                                                                                       Variable Dividend / Share                                     $0.7500
• Total first quarter dividend of $1.2125/share

• To be paid on March 30th to shareholders of record as                                                (+) Base Dividend / Share                                     $0.4625
  of March 18th
                                                                                                       (=) Total Dividend / Share                                    $1.2125

                   (1)   Per share calculations based on 85 MM shares outstanding.
                   (2)   Free cash flow is calculated as operating cash flow before working capital changes less capital expenditures.
                                                                                                                                                                              16
Year-End 2021 CIVI Proved Reserves
Net Oil Net Gas Net NGL Net BOE SEC PV-10(1) $75/bbl PV-10(2)
Reserve Category
(MMBBL) (BCF) (MMBBL) (MMBOE) ($MM) ($MM)
PDP 98 714 85 302 $4,302 $4,859
PDN 6 35 4 16 $162 $201
PUD 40 140 17 80 $864 $1,090
Total Proved 144 888 106 398 $5,327 $6,150
Proved Reserves by Commodity Proved Reserves by Category PV-10 by Category
PUD reserves reflect a conservative booking policy of 234 gross operated locations, which is less than two years of activity at our current rig pace
Note: Excludes Bison acquisition.
(1) SEC Pricing Assumptions: $66.56/bbl (WTI), $3.598/mmbtu (Henry Hub); PV-10 graph above reflects SEC PV-10.
(2) Assumes $75/bbl (WTI) and $4.00/mmbtu (Henry Hub). Excludes ~$390 MM in PDP PV-10 value for the Bison assets.
17Oil Hedge Positions Summary
Civitas Oil Hedges (Bbl/d)
35,000
32,740
30,000
24,717
25,000 $44.15 - $59.56
21,045
20,000 18,669
$41.52 - $64.00
$42.35 - $66.22
15,000
$42.39 - $67.38
10,000
$47.36
5,000 $49.56 $47.00 $46.84 3,231
1,884 1,675 1,527
$45.77 - $64.05 795 1,005 692
$48.10 - $57.69 $47.91 - $57.48 $49.04 - $56.49 $45.00 - $56.25 $51.81 $56.50
– $45.42 $46.29 $46.79 $46.75 $55.65
Q1 2022 Q2 2022 Q3 2022 Q4 2022 Q1 2023 Q2 2023 Q3 2023 Q4 2023 Q1 2024 Q2 2024 Q3 2024
Oil Swaps Oil Collars
Note: Hedge positions as of Feb 28, 2022, pro forma for closed Bison acquisition.
18Gas Hedge Positions Summary
Civitas Gas Hedges (MMBtu/d)
175,000
NGL OPIS Swaps
157,162 2022: 4,000 Bbl/d OPIS swaps at $20.22/Bbl
148,879 146,105
150,000 144,058
$2.18 - $2.78
125,000
$2.42 - $3.31 $2.59 - $3.67 $2.60 - $3.68
100,000
75,000
$2.84
55,098
50,000 $2.07 - $3.23 45,979 45,767 45,613
$2.28 - $2.91 $2.34 - $2.96 $2.38 - $2.96
31,702 31,587 31,468
$2.66 $2.67 $2.67 $2.50 - $3.37 $2.21 - $2.90 $2.50 - $3.16
25,000 $2.51 $2.51 $2.51 $2.51
$2.57 $2.57 $2.57
–
Q1 2022 Q2 2022 Q3 2022 Q4 2022 Q1 2023 Q2 2023 Q3 2023 Q4 2023 Q1 2024 Q2 2024 Q3 2024
Gas Swaps Gas Collars
Note: Hedge positions as of Feb 28, 2022, pro forma for closed Bison acquisition.
19Adjusted EBITDAX Reconciliation
Source: Company disclosure. $ in thousands.
20You can also read