FY2021 Results Presentation - 23 August 2021 - RWC
←
→
Page content transcription
If your browser does not render page correctly, please read the page content below

FY2021 Results
Presentation
23 August 2021

RELIANCE WORLDWIDE CORPORATION LIMITED
ABN 46 610 855 877

Important Notice
This presentation contains general information about Reliance Worldwide Corporation Limited’s activities at the date of presentation (23
August 2021). It is information given in summary form and does not purport to be complete.

The presentation is not an offer or invitation for subscription or purchase of or a recommendation of securities in any jurisdiction. It is not
intended to be relied upon as advice to investors or potential investors and does not take into account the investment objectives, financial
situation or needs of any particular investor. These should be considered, with or without professional advice, when deciding if an
investment is appropriate.

Information, including forecast or forward looking information, in this presentation should not be considered as a recommendation in relation
to holding, purchasing or selling shares, securities or other instruments in Reliance Worldwide Corporation Limited. Due care and attention
has been used in the preparation of forecast and forward looking information. However, actual results may vary from forecasts and any
variation may be materially positive or negative. Forecasts by their very nature are subject to uncertainty and contingencies many of which
are outside the control of Reliance Worldwide Corporation Limited and Reliance Worldwide Corporation Limited cautions against reliance on
any forward looking statements or forecasts, particularly in light of the current economic climate and the significant volatility, uncertainty and
disruption caused by COVID-19. Past performance is not a reliable indication of future performance. Except as required by applicable
regulations or laws, Reliance Worldwide Corporation Limited does not undertake any obligation to publicly update or review any forward
looking statements whether as a result of new information or future events.

This presentation contains references to the following non-IFRS measures: EBITDA, EBIT, Adjusted NPAT and Adjusted EPS. These
measures are used by RWC to assess operating performance and are defined in the accompanying Results Announcement dated 23 August
2021. These measures have not been subject to audit or review.

All figures are presented in Australian Dollars unless indicated otherwise. The sum totals throughout this presentation may not add exactly
due to rounding differences.

The information in this presentation remains subject to change without notice. Circumstances may change and the contents of this
presentation may become outdated as a result.

                                                                                                                                                     2
This presentation forms part of a package of information about Reliance Worldwide Corporation Limited. It should be read in conjunction
with the Appendix 4E, 2021 Annual Report and Results Announcement also released on 23 August 2021.
FY21 Results Overview

                        3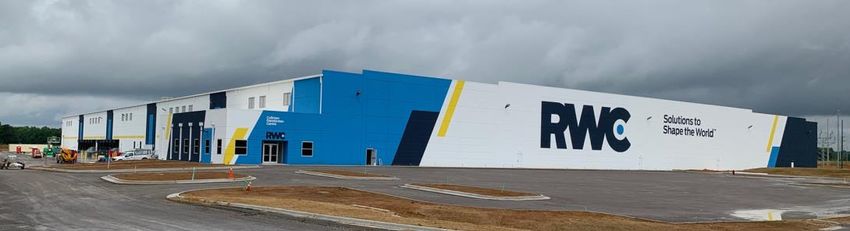
Introduction
FY21 a record year: revenue and earnings growth driven by continued strength
in repair and remodelling activity in all regions
▪   Net sales growth of 25% on a constant currency basis
    • Americas recorded 27% constant currency sales growth: continued strength of US repair and remodelling
      activity; US winter freeze event in the second half further drove volume growth
    • Asia Pacific constant currency sales 18% higher, driven by growth in Australia and inter-co sales to the US

    • EMEA sales up 25% in constant currency due to strength of UK R&R market and recovery in Continental
      European markets
▪   Operating margin expansion in all regions: Group Adjusted EBITDA margin of 26.1% up 450 basis points
    on pcp due to operational leverage from higher volumes coupled with tight cost management
▪   Cost reduction initiatives achieved savings of $22.3m in FY21
▪   Adjusted Net Profit after Tax of $211.9m, up 63%
▪   Continued strong cash generation, cash flow from operations up 20% to $334.3m
▪   Financial position strengthened, with net debt reduced by $128.3m, net leverage ratio of 0.51 times
▪   Cash dividends paid: $101.8m                                                                                    4
FY21 Financial Highlights
Net sales Adjusted EBITDA Adjusted NPAT
$1,341 million $349.2 million $211.9 million
+15% growth overall1 +39% on pcp +63% on pcp
+25% in constant currency
Operating cash flow Net debt reduction Final dividend
$334.3 million $128.3 million 7.0 cps
Total FY21 dividends
+20% Net debt $173.9 million
Cash conversion: 98% Net leverage ratio2 at 0.51x 13.0 cps
1 Growth rates expressed as change over comparative period for the year ended 30 June 2020
2 Net Debt/FY21 Reported EBITDA of $340.7m
5Strong operating cash flow performance
Cash generated has enabled further reduction in net debt and higher FY21 dividend
Cash Flow from
$m Operations Net Debt/EBITDA Total Dividends Declared ($m)
1.8 120
400 1.67
1.6 102.7
350 334.3 100
1.39
1.4
300 278.3
1.2 80
71.1
250
1.0
200 60 55.3
178.9
0.8
150
0.6 0.51 40
100
0.4
20
50 0.2
0 0.0 0
FY19 FY20 FY21 FY19 FY20 FY21 FY19 FY20 FY21
6The story of the year
Strong demand in all major markets persisted throughout the year with volume
growth along with tight cost control contributing to higher operating margins
Markets
▪ Strong volume growth in all key markets, US sales boosted further by winter freeze event in second half
▪ Repair and remodel markets were resilient, new housing construction also performed strongly
▪ Commercial sector continued to recover more slowly than residential markets
Operations
▪ Meeting strong demand was a major challenge in FY21 while also managing the operational impacts of COVID across
all major manufacturing facilities
▪ Cost reduction initiatives delivered $22.3m in realised cost savings in FY21, year end run rate of $25m p.a.
▪ Plans to expand and rationalise distribution and logistics operations in the US and UK were finalised during the year
Financial Performance
▪ Operating margin expansion as a result of volume driven operating leverage and tight cost management
▪ Continued strong cash generation enabled further debt and leverage reduction
▪ Price increases implemented to offset input cost increases and other inflation pressures
▪ Significantly enhanced financial position ensures RWC is well positioned to capture future growth opportunities
7RWC 5-Year Post-IPO Performance History
Net Sales A$m Adjusted EBITDA A$m Adjusted NPAT A$m
5 Year CAGR: 22% 400 5 Year CAGR: 30% 5 Year CAGR: 34%
349 250
1,600 350
212
1,400 1,341 300
277 200
1,162 251
1,200 1,104 250 158
1,000 150
200 130
800 769
151
150 100
602 121
600 79
66
100
400
50
50
200
0 0 0
Net Sales Adjusted EBITDA Adjusted NPAT
8
CAGR: Compound annual growth rate FY17 FY18 FY19 FY20 FY21Group Financial
Performance
9Summary of FY21 Performance
A$m FY20 FY21 %
Change ▪ FY21 net sales were 15% higher than pcp, up by 25%
on a constant currency basis
Net Sales 1,162.4 1,340.8 15%
▪ Adjusted EBITDA increased 39% to $349.2m, driven by
Reported EBITDA 217.9 340.7 56% stronger sales in all regions
Adjusted EBITDA 251.3 349.2 39% ▪ EBITDA margin increased as a result of the positive
operational leverage impact of higher volumes
Adjusted EBITDA Margin 21.6% 26.1% 450bps
▪ Adjusted EBIT up 55% and Adjusted EBIT margin
Adjusted EBIT 189.3 292.9 55% increased by 560 bp
▪ $8.5m restructuring expense incurred to meet costs of
Adjusted EBIT Margin 16.3% 21.9% 560bps
US and UK warehousing and distribution changes
Reported NPAT 89.4 188.2 111%
▪ Adjusted NPAT of $211.9m, up 63%
Adjusted NPAT 130.3 211.9 63% ▪ Final dividend of 7.0 cents declared:
Earnings per share (cps) 11.4 24.0 111% • Total dividend for the year 13.0 cents
Adjusted earnings per share (cps) 16.6 27.1 63% • 55% of Reported NPAT
▪ Cash flow from operations up 20% resulting from
Cash flow from operations 278.3 334.3 20%
higher sales and tight working capital management
10Summary of FY21 Performance in US$
US$ reporting from 1st Quarter FY22 will better reflect Group performance trends
US$m1 FY20 FY21 %
Change ▪ A$ reported Sales growth of 15% versus:
Net Sales 781.6 1,001.6 28% • Constant currency Sales growth of 25%
Reported EBITDA 145.8 254.3 74%
• US$ sales growth of 28%
Adjusted EBITDA 168.3 260.7 55%
Adjusted EBITDA Margin 21.5% 26.0% 450bps
Adjusted EBIT 138.0 220.8 60%
Adjusted EBIT Margin 17.7% 22.0% 430bps
Reported NPAT 59.0 141.0 139%
Adjusted NPAT 86.5 158.8 84%
Earnings per share (cps) 7.5 18.0 139%
Adjusted earnings per share (cps) 11.0 20.3 84%
1 US$ figures represent RWC management’s translation of historical
Cash flow from operations 186.7 249.6 34% earnings and have not been subject to audit or audit review
11FY21 Adjusted EBITDA up 45% in constant currency
Strong volume growth the major driver, cost reduction initiatives offset inflation
▪ FY21 Adjusted EBITDA increased 45% on
a constant currency basis, up 39% on a
reported basis
▪ EBITDA margin on a constant currency
basis was 27.2%, up from 22.3% pcp
▪ Volume growth was the main driver of the
increase in EBITDA
▪ $22.3m cost savings from restructuring
initiatives delivered in the year, in line with
target of $25m in annualised savings run
rate
▪ $7.0m in savings in T&E, advertising and
promotions
12Cost inflation was a feature of FY21
Commodity price, inflation impacts and COVID costs impacted results
Cost Items FY21 Impact (A$m) Cost Reduction Initiative FY21 Savings (A$m)
Copper 7.2 Product development savings 4.9
Other input materials incl. resins 3.5 Relocation of HoldRite plant 1.0
Freight incl. airfreight 9.0 US restructure 3.2
Packaging 2.4 UK restructure 3.8
COVID costs 6.2 Procurement initiatives 2.5
Manufacturing/CI initiatives 4.3
Other 2.6
TOTAL 28.3 TOTAL 22.3
▪ Cost reduction initiatives implemented during the year realised $22.3m in savings, achieved year end run rate of $25m p.a.
▪ Product prices were increased in all regions to recover higher commodity costs and other cost inflation
▪ RWC average copper cost in FY21 was US$6,560/tonne versus US$5,965/tonne in FY20. Second half average copper cost was
US$7,440/tonne1
13
14 Month Lagging PricingSegment results: Americas
Sustained growth in repair and remodel activity, US winter freeze boosted 2nd half demand
US$m FY20 FY21 % US$m 1H21 % over pcp 2H21 % over pcp
Net Sales 495.8 629.9 27% Net Sales 289.6 22% 340.2 32%
EBITDA 64.9 116.6 80% EBITDA 54.8 49% 61.9 119%
Adjustments 14.4 3.5 n/m Adjustments - n/m 3.5 n/m
Adjusted EBITDA 79.3 120.2 52% Adjusted EBITDA 54.8 49% 65.4 54%
Adjusted EBITDA margin 16.0% 19.1% 310 bps Adjusted EBITDA margin 18.9% 340 bps 19.2% 270 bps
Commentary
Americas Quarterly Revenues US$m
180 ▪ Sales growth recorded in all channels due to continued strength of
160 repair and remodelling activity levels
140
120 ▪ Winter freeze impacting Texas and surrounding US states drove
100 higher sales in the 2nd half – FY21 estimated sales impact US$42m
80
▪ Market growth includes price increases in second half that helped
60
40
to offset copper and other input cost rises
20
▪ Operating margin expansion due to higher manufacturing overhead
0
recoveries along with cost reduction initiatives
Q1 Q2 Q3 Q4
FY19 FY20 FY21 14Americas: 27% revenue growth in FY21
Excluding US freeze, Americas recorded 19% constant currency sales growth in FY21
Values are in US$
15
Market growth source: LIRA. LIRA values are nominal and are not adjusted for price inflationSegment results: Asia Pacific
Volume growth from Australian R&R activity and intra-Group exports to Americas
A$m FY20 FY21 % A$m 1H21 % over pcp 2H21 % over pcp
Net Sales 244.8 277.3 13% Net Sales 138.1 10% 139.1 17%
EBITDA 44.3 66.2 50% EBITDA 29.9 31% 36.3 21%
Adjustments - - - Adjustments - - - -
Adjusted EBITDA 44.3 66.2 50% Adjusted EBITDA 29.9 31% 36.3 21%
Adjusted EBITDA margin 18.1% 23.9% 580bps Adjusted EBITDA margin 21.6% 340bps 26.1% 820 bps
Commentary
Asia Pacific Quarterly Revenues A$m
80 ▪ External sales growth reflects stronger Australian new housing
70 construction and repair and remodel markets
60
▪ Increased Australian single family construction has offset decline in
50 multi-family
40
30 ▪ Higher inter-company sales due to strong demand in the Americas
20
▪ EBITDA margins have improved due to operational leverage from
10
higher manufactured volumes
0
Q1 Q2 Q3 Q4 ▪ $10.9m realisation of profit in stock arising from increased sales
FY19 FY20 FY21 Americas: $1.8m inventory realisation, $9.1m FX translation gain16Segment results: EMEA
Rebound in activity in UK R&R and Continental Europe volumes
GBPm FY20 FY21 % GBPm 1H21 % over pcp 2H21 % over pcp
Net Sales 172.7 216.8 26% Net Sales 104.6 11% 112.2 43%
EBITDA 43.2 70.3 63% EBITDA 34.6 22% 35.7 142%
Adjustments 6.3 1.2 - Adjustments - - 1.2 -
Adjusted EBITDA 49.5 71.5 45% Adjusted EBITDA 34.6 22% 36.9 75%
Adjusted EBITDA margin 28.7% 33.0% 430 bps Adjusted EBITDA margin 33.1% 310 bps 32.9% 30 bps
Commentary
EMEA Quarterly Revenues GBPm
60 ▪ Sales growth driven by strong UK repair and remodel markets
50 ▪ Continental Europe sales also up strongly, particularly Germany,
40 France and Spain
30 ▪ Increased exports of FluidTech products to Americas and APAC
regions
20
10 ▪ EBITDA margin increase driven by growth in volumes and
operational leverage, along with further cost reductions
0
Q1 Q2 Q3 Q4
FY19 FY20 FY21 17Strong cash flow: balance sheet strengthened
Cash flow performance Commentary
A$m 30 Jun 2020 30 Jun 2021 %
▪ Cash flow from operations up 20%, cash conversion ahead
Reported EBITDA 217.9 340.7 56%
of 90% target at 98%
Changes in working capital 60.4 (6.4) -
▪ Higher cash dividend payments reflect payment of deferred
Cash flow from operations 278.3 334.3 20% FY20 interim dividend in FY21 as well as FY20 final and
Operating cash flow conversion 128% 98% - FY21 interim dividends
Cash dividends paid 39.1 101.8 260%
Net working capital
A$m 30 Jun 2020 30 Jun 2021 ▪ Working Capital/Sales: 23.4% versus 26.7% pcp
Trade and other receivables 263.2 293.2 ▪ Inventory levels rebuilt from low levels at start of FY21:
Inventories 215.4 260.4
largest increase in Americas in finished goods inventories
Trade and other payables (168.4) (240.0) ▪ Higher sales drove increased receivables balances in FY21
Net working capital 310.2 313.6 ▪ Partly offsetting these movements were increases in
payables, prepayments and accruals
Debt metrics
A$m 30 Jun 2020 30 Jun 2021 ▪ Net debt reduced by $128.3m since 30 June 2020
Cash and cash equivalents 82.2 28.4 ▪ $27.2m reduction in net debt due to foreign currency
Gross debt 384.4 202.3 translation impacts
Net debt1 302.2 173.9 ▪ Headroom of $583m available in cash and undrawn
Net debt / EBITDA 1.39x 0.51x committed debt funding 18
1 Net debt excludes lease liabilitiesCapital expenditure
FY22 forecast of A$80m to A$90m includes a range of capacity expansion projects
90 6.3%
80 6.0%
5.0% $70m $90m
70 5.0% Maintenance
60 3.7% 3.7% 4.0%
50 Growth
40 $38m 3.0%
$49m
30
$43m % of Sales
2.0%
20
1.0%
10
0 0.0%
FY18 FY19 FY20 FY21 FY22F
Capacity expansion Expansion of product Production expansion Americas – production Americas:
supporting core PTC range, capacity and in the US and UK expansion • Expansion of T&P Valves and
product growth in the US efficiency in PEX pipe, PEX Pipe capacity
HydroFlame Pro and New product EMEA capacity expansion – • 4th SharkBite line
EvoPEX development including core fittings manufacture and • US distribution expansion
HydroFlame pipe extrusion, assembly
Planned expansion at EMEA:
John Guest New ERP system for • Increased capacity for Speedfit
EMEA and FluidTech production
New ERP system for • New pipe and fittings products
APAC tooling/production
APAC:
• Moulding and curing capacity 19
expansionConsolidating distribution in US and UK
FY21 one-off costs of $8.5m will enable future warehousing and logistics improvements
Americas EMEA
▪ New 600,000 sq ft facility in Alabama ▪ Consolidate 5 warehouse locations across the UK (130,000
sq ft) into single facility in centre of UK
▪ Will enable consolidation of sub-optimal locations in
Alabama into one location ▪ Expansion capability from 140,000 sq ft to 280,000 sq ft
▪ Brings broader distribution network in alignment with our ▪ Migrate own fleet to more efficient outsourced fleet
long-term growth needs
▪ Greater flexibility, efficiency, scalability, sustainability and
▪ Improved operational efficiencies and lower fixed costs enables cost saving
▪ FY21 one-off costs: A$6.3m ▪ Real-time load visibility and customer order tracking
▪ FY21 one-off costs: A$2.2m
20Strategy and Outlook
21RWC strategy summary
22Strategy overview
Our strategy remains focused on driving growth in core and adjacent markets
▪ Solutions for the end customer: Pro-plumbers and DIY customers
• Smart product solutions which make the lives of our end customers easier and improves their productivity
▪ Strong Distributor relationships: helping our channel partners grow value through:
• Expanding product ranges available on their shelves
• Offering industry leading service
• Investing in our brands to ensure that they continue to attract end-users into their stores
▪ Operational excellence: delivering margin expansion through efficient and low-cost operations
• Delivering highest quality products via a strong logistics capability
• Ensuring channel partners always have the right products in stock when they need them
▪ Underpinned by our people focus: supporting and developing our people, supporting and caring for
the broader communities in which we operate
▪ M&A remains a potential growth path in addition to the pursuit of organic growth initiatives
23RWC’s Capital Management approach
Capital management approach aims to minimise the cost of capital and ensure
ongoing access to funding to meet future requirements
Strong Financial
Value creation Capital management
Focus
Improving long term Organic Capital Capital Consistent Capital
Acquisitions
margins and returns Growth Investment structure dividends returns
• Margin expansion through Above-market Ongoing M&A aligned Target Target On-market
continuous improvement growth in 3 investment in: with strategy: Leverage Dividend Share
initiatives regions: • capacity Range: Payout Ratio: Buybacks:
• Americas expansion • Fill gaps in
• Strong operating cash flow • APAC • core new product Net Debt to 40-60% of Preferred
performance • EMEA product range EBITDA of 1.5 - NPAT means of
development • Expand 2.5 times distributing
• Maintenance of investment distribution Franked to the excess cash
grade equivalent credit metrics Ongoing or end-user extent possible beyond
assessment of scope – estimated at dividends
• Improving return on equity operational • Broaden less than 30%
footprint and geographic Assessed when
supply chain presence appropriate
optimisation
24Outlook for FY22 1
RWC will provide expanded quarterly trading updates from the first quarter of FY2022
PRICES:
▪ Average price rises announced in FY21 of 6% will mitigate inflation impacts
▪ Price increases will flow through to Sales in FY22, regional variations will reflect different product mix and cost bases
▪ Price increases may be margin dilutive by up to 1% where they are applied to offset equivalent cost increases with no net
contribution to gross margins
COSTS:
▪ Price increases are expected to fully offset commodity input cost increases
▪ Commodity prices and other cost inflation will require a dynamic approach to pricing and cost management
▪ Expenditure on travel, entertainment and marketing expected to increase in FY22 from suppressed levels in FY21
CASH FLOW:
▪ Cash flow from operations will be impacted as we re-build inventory levels in the first half
▪ Cash for investing activities will include:
• Payment on completion of LCL acquisition for A$37m
• Increased capital expenditure of A$80m to A$90m
25
1 Key assumptions for FY2022 are set out in the Results Announcement dated 23 August 2021Regional outlook for FY22 1
AMERICAS:
▪ COVID brought about a step change in residential remodelling activity in FY21
▪ Home remodelling activity is expected to remain strong given fundamentals in core US residential segments
▪ FY22 sales (excl freeze) expected to continue to grow at above market rates, but growth rate expected to moderate from the
abnormally high rates of FY21
▪ Sales growth drivers will include price impacts, new products and marketing initiatives, overall market growth (excl. price)
ASIA PACIFIC:
▪ Increases in residential dwelling approvals in Australia expected to translate into ongoing strong construction activity levels
▪ House price appreciation and low interest rates should remain supportive of continued growth in the repair and remodelling
sector
▪ Operating earnings will include contribution from LCL acquisition
EMEA:
▪ Repair and remodel activity expected to continue to be a strong performing sector within the UK construction industry
▪ Continental Europe demand expected to improve further with economies increasingly opening up
26
1 Key assumptions for FY2022 are set out in the Results Announcement dated 23 August 2021Segment performance drivers: Americas
Strong outlook for US home improvement in FY22
Market backdrop:
▪ Home remodelling activity expected to remain strong,
underpinned by ongoing strength of home sales,
LIRA inputs house price appreciation, and new residential
and outputs construction activity
are nominal
(i.e. not ▪ Remodelling market to continue to be lifted by
inflation
adjusted)
increased DIY activity also
▪ Non-residential construction likely to recover slowly
post COVID-19 – particularly hotels, retail stores,
office buildings and educational facilities
What we will be watching for:
▪ Sustainability of the COVID volume uplift
▪ Trends in demand at retail and hardware – both pro-
Key indicators:
plumber and DIY
▪ Leading Indicator of Remodelling Activity (LIRA)
▪ Continued strength of residential new construction
▪ Home value trends: R&R activity tends to track home values over time
▪ Trends in commercial construction activity
▪ New housing permits and commencements
▪ Household formations
▪ Activity in sales of existing homes 27Segment performance drivers: Asia Pacific
Improving Australian new residential construction expected to positively impact volumes
Australian Residential Approvals1 Market backdrop:
250,000 ▪ Rising house values have supported increase in
standalone new dwelling construction
200,000
▪ Remodelling activity has continued to be strong
26% increase in
150,000 throughout COVID, labour and supply chain constraints a
new housing
barrier to higher growth rates
approvals
100,000 ▪ Border restrictions have negatively impacted migration
50,000
and population growth - not expected to return to pre-
COVID levels until 2024
- ▪ Construction activity continues to be at risk of temporary
FY18 FY19 FY20 FY21
state lockdown restrictions
Detached Houses Multi-Family
Key indicators: What we will be watching for:
▪ Multi-family and stand alone residential approvals ▪ Ongoing impacts of COVID lockdown on activity
▪ New housing commencements ▪ Continuation of strong trends in detached dwelling new
▪ Residential construction drivers: residential construction
▪ Unemployment, government stimulus measures, net ▪ Any recovery in multi-family / apartment approvals
migration levels, foreign student enrolments, returning
expatriates
1 Source: 28
Australian Bureau of Statistics: total number of dwelling units, all sectors, seasonally adjustedSegment performance drivers: EMEA
Strong rebound in repair and maintenance activity in the UK
Index of UK new work, repair and maintenance1 Market backdrop:
▪ UK residential repair and remodelling sectors are expected
to remain strong with short term economic indicators
100
remaining favourable
▪ Continental Europe recovery lagging UK but sentiment
80 expected to improve with increase in vaccinations
▪ Uncertainty due to changing consumer behaviour post
Covid
60
All work All new work Repair and maintenance What we will be watching for:
40 ▪ Potential shift in consumer spending from home
Aug-17
Aug-18
Aug-19
Aug-20
Feb-18
Feb-19
Feb-20
Feb-21
Oct-18
Oct-17
Oct-19
Oct-20
Apr-18
Apr-19
Apr-20
Dec-20
Apr-21
Dec-17
Dec-18
Dec-19
Jun-17
Jun-18
Jun-19
Jun-20
Jun-21
improvement to entertainment and leisure activities
Key indicators:
▪ UK repair and maintenance activity statistics (chart above)
▪ Sales performance of UK distributors
▪ British Merchants Federation sales trends
1 Source: UK Office of National Statistics 29Priorities for FY22
Our focus is building on strong growth delivered in FY21 through new products,
capacity expansion and excellent channel partner relationships
▪ Delivery of above market top line growth in all key geographies
▪ Continued focus on operational excellence and execution, remaining agile and responsive to changing market
conditions
▪ Investment in capacity expansion to support volume growth, drive manufacturing efficiencies and enable
introduction of new products
▪ Realignment of warehousing/distribution footprints in Americas and EMEA
▪ Integration of recently acquired LCL with APAC’s other manufacturing operations
▪ Managing inflationary pressures, particularly input costs, through continuous improvement initiatives and
prudent management of discretionary costs
▪ Ongoing imperative: health & safety and wellbeing of our people as we manage through COVID in a post-
vaccination environment
30Summary
RWC is well positioned for future growth and resilience of the business has been
demonstrated through the COVID-19 pandemic
▪ RWC is focused on creating value through product leadership
• Solutions for the end-user: improving contractor productivity, enabling the DIYer
• Value for distributors: increasing value on their shelf, providing broadest access to our product for end-users
• Industry leading execution: premium quality, outstanding delivery performance, margin expansion
▪ Each region offers unique growth opportunities:
• Americas: highest medium term growth potential from continued product range expansion and leveraging of
strong brands and channel partner network
• APAC: key Australian market relatively mature but ongoing new product opportunities
• EMEA: leveraging John Guest brand and distribution network with expanded product range in the UK is
highest strategic priority
▪ Selective M&A will be targeted to help achieve strategic objectives
31Q&A
Appendix:
Reconciliation of Reported NPAT and Adjusted NPAT
                                                                30-Jun-21         30-Jun-20
 Twelve months ended:                                                                            Variance
                                                                ($ million)       ($ million)

 Net sales                                                          1,340.8           1,162.4      15.3%

 Reported EBITDA                                                      340.7             217.9      56.4%
 Adjusted for one-time items:
 - Restructuring and asset impairment charges                            8.5              33.4       n/m
 Adjusted EBITDA                                                      349.2             251.3      39.0%
 Reported net profit before tax                                       272.3             135.9     100.4%
 Tax Expense                                                          (84.1)            (46.4)     81.3%
 Reported net profit after tax                                        188.2               89.4    110.5%
 Adjusted for specific tax items:
 - Cash tax benefit of goodwill amortisation for tax purposes           15.2              16.9       n/m
 - Prior years tax adjustment                                                 -            4.9       n/m
 - Restructuring and asset impairment charges                            8.5              25.7       n/m
 - CARES Act Benefit                                                          -          (6.6)       n/m
 Adjusted net profit after tax                                        211.9             130.3      62.6%
 Basic earnings per share                                        24.0 cents        11.4 cents     110.5%
 Adjusted earnings per share                                     27.1 cents        16.6 cents      63.3%
 Dividend per share                                              13.0 cents          7.0 cents     85.7%
                                                                                                            33
Appendix:
Overview of LCL Acquisition
▪ Business assets of LCL Pty Ltd (“LCL”) acquired for A$37m in August 2021
▪ LCL is one of Australia’s largest producers of high-quality copper-based alloys
▪ LCL recycles copper material and manufactures lead-free brass for use in the delivery of potable water
▪ Main supplier of brass to RWC in Australia as well as recycling excess brass (swarf) arising from RWC’s product
manufacturing activities. RWC accounts for over 90% of LCL’s revenues
▪ The acquisition of LCL secures a favourable long-term cost position for RWC’s brass rod requirements in Australia and
secures control of a critical piece of RWC’s manufacturing supply chain
▪ Co-location of RWC’s brass forging operations and LCL’s brass production facility enables optimisation of materials handling
and manufacturing efficiencies.
▪ LCL operates from two locations within the greater Melbourne area. RWC will assume the long-term leases of the land and
buildings at these sites:
• Moorabbin facility produces brass alloys through the processing of scrap metals, melting and casting of scrap into brass
rods, and finishing processes
• Dandenong South facility recycles insulated copper wire
34You can also read