Investor Presentation Spring/Summer 2022 - Freehold ...

Page created by Cathy Young
 
CONTINUE READING
Investor Presentation Spring/Summer 2022 - Freehold ...
Investor
         Presentation
         Spring/Summer
         2022

freeholdroyalties.com   TSX FRU   Quality Assets • Sustainable Dividends
Investor Presentation Spring/Summer 2022 - Freehold ...
Investment Highlights
           A lower risk income vehicle

                  6.4% dividend yield                                                                               Torque to commodity
                              sustainable income to shareholders                                                                 with dividend coverage down to $40WTI

                  ESG friendly investment                                                                           High margin asset class
                              rated top 1% among global oil producers                                                            $109/bbl realized oil price, $3.70/boe cash
                                                                                                                                 costs

                  Diversified assets                                                                                Financial strength
                              exposure to basins across North America                                                            low debt levels & strong free cash flow

                                                                                                                                                                                   Spring/Summer 2022 | 2
Dividend yield based on $15.00 share price and $0.08/share monthly dividend rate. ESG rating based on Sustainalytics 2022 ESG ranking. Operating netback and cash costs based on
Q1-2022 results released May 10, 2022. Operating netback and cash costs are Non-GAAP ratios. See “Non-GAAP Ratios and Other Financial Measures” in the advisories
Investor Presentation Spring/Summer 2022 - Freehold ...
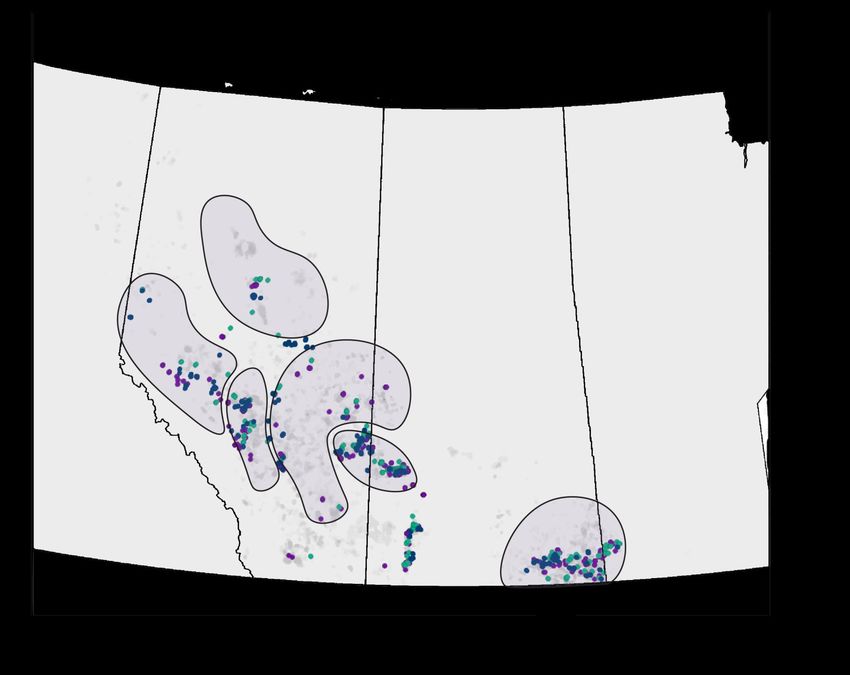
2022 First Quarter Results
                                                                                                                        Q1/2022   Q1/2021         Change
           Production                                                                   boe/d                            13,676    10,944            25%
           Funds from operations                                                          mm                             $71.9     $32.4            122%
           Period end net debt                                                            mm                             $62.6     $64.8             -3%
           Corporate Realized Price                                                    per boe                           $69.17    $37.31            85%
           Oil Realized Price                                                          per bbl                          $109.01    $59.16            84%
           Payout ratio                                                                                                   38%       24%              14%
           Cash costs                                                                  per boe                           $3.70     $4.37            -15%

             ▪     Average production of 13,676 boe/d, up 25% from the same period in 2021
             ▪     244 (6.3 net) wells drilled on our royalty lands in Q1-2022 with prospects targeting oil in the Viking, Mississippian,
                   Clearwater, Permian, and Eagle Ford
             ▪     Oil realized price of $109.01, up 84% from Q1-2021 reflecting benchmark increase and U.S. pricing benefit
             ▪     Record funds from operations of $71.9 million, up 122% versus the same period last year
             ▪     Q1-2022 payout of 38%, up from 24% during the same period last year
                         – Q1-2022 cash costs of $3.70/boe, down 15% compared to Q1-2021, reflecting ongoing business optimization
             ▪     Net debt to trailing funds from operations of 0.3x retains balance sheet strength and flexibility
                                                                                                                                            Spring/Summer 2022 | 3

Netback, cash costs, payout ratio are Non-GAAP ratios or other specified financial measures. See “Non-GAAP Ratios and
Other Financial Measures” in the advisories
Investor Presentation Spring/Summer 2022 - Freehold ...
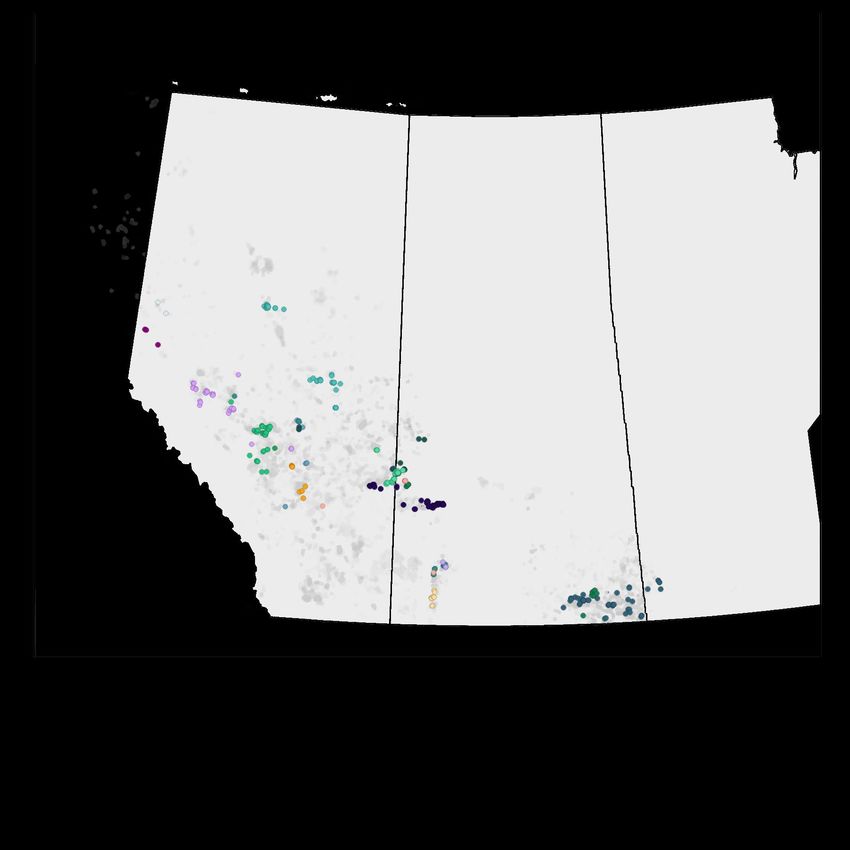
2022 Q1 Royalty Drilling Results
                                                                                                    Top Canadian Drillers
   Drilling activity                                                                               Gross Wells   Net Wells
   driven by a well
                                                                           Teine Energy                30           2.6
 capitalized group of
   North American                  Permian                   Haynesville   Bonterra Energy Corp.       12           0.4
      producers
                                                                           Whitecap Resources          12           0.2

                                                                           Tamarack Valley             9            0.2

                                                                           Obsidian Energy             6            0.1
             Clearwater                         Eagle Ford                 Total Canadian Wells       144           5.9

    Spirit River                                                                                       Top US Drillers

                                                                                                   Gross Wells   Net Wells

                                                                           Pioneer Resources           19           0.01

                                                                           Marathon Oil                15           0.1

                          Viking                                           Continental Resources       9            0.1
Deep Basin
                                                                           Laredo Petroleum            6
Investor Presentation Spring/Summer 2022 - Freehold ...
US Activity Update
Inventory of DUCs and Permits (gross/net)
 Gross Permitted Wells                                                                                        Net Permitted Wells
   Gross Permitted Wells

                           400                                                                                                        1.8

                                                                                                                Net Permitted Wells
                           350                                                                                                        1.6
                           300                                                                                                        1.4
                           250                                                                                                        1.2
                                                                                                                                      1.0
                           200
                                                                                                                                      0.8
                           150                                                                                                        0.6
                           100                                                                                                        0.4
                            50                                                                                                        0.2
                             0                                                                                                        0.0

                                 Permian   Bakken   Eagle Ford       Other                                                                  Permian   Bakken     Eagle Ford       Other

 Gross DUCs                                                                                                   Net Royalty DUCs
                           400                                                                                                        2.0
                           350                                                                                                        1.8
                                                                                                                                      1.6
                           300
  Gross DUCs

                                                                                                                                      1.4

                                                                                                                Net DUCs
                           250                                                                                                        1.2
                           200                                                                                                        1.0
                           150                                                                                                        0.8
                                                                                                                                      0.6
                           100
                                                                                                                                      0.4
                           50                                                                                                         0.2
                            0                                                                                                         0.0

                                 Permian   Bakken   Eagle Ford       Other                                                                  Permian   Bakken     Eagle Ford       Other

                                                                                                                                                                              Spring/Summer 2022 | 5

Source: Enverus. Assumes that FRU owned its current US assets as of Q1 2019; Net wells includes estimates of royalty interest in DUCs; Drilled and Uncompleted (DUC) wells are those that have been spud
  and are expected to be turned to production
US Activity Update
     US cycle times three times longer than Canada

     ▪ Permit to drilling is comparable                                                                                                                  Cycle Time Averages – POST COVID

       between Canada and the US, but                                                                                                   600

       drilling to on-production is 5 months on                                                                                         500

                                                                                                                       Average # Days
       average in the US (vs. 2 months in                                                                                               400

       Canada)
                                                                                                                                                 May not add due to rounding
                                                                                                                                        300

                                                                                                                                        200
     ▪ Implication – Q1 2022 permits and
       DUCs in the US will contribute to H2                                                                                             100

       2022 production                                                                                                                    0

                                                                                                                                                                                                                                                                       MIDLAND
                                                                                                                                                                        MANNVILLE

                                                                                                                                                                                          SE SASK

                                                                                                                                                                                                    DEEP BASIN
                                                                                                                                              VIKING

                                                                                                                                                           CLEARWATER

                                                                                                                                                                                                                                         EAGLE FORD
                                                                                                                                                                                                                              DELAWARE
                                                                                                                                                                                                                    CARDIUM

                                                                                                                                                                                                                                                           BAKKEN-US
                                                                                                                                                                               CANADA
                                                                                                                                                                                    CAD                                                               US

                                                                                                                                                       Average Days Permit to Spud                               Average Days Spud To Production

Source: Enverus. Assumes that FRU owned its current US assets as of Q1 2019; Net wells includes estimates of royalty interest in permits and DUCs; Drilled and Uncompleted (DUC) wells are those that have been spud and are
expected to be turned to production within next ~6 months. Permit wells are those that are not currently in the process of active drilling, but for which have been identified as a drilling location and is expected to be spud in the
next 12-months

                                                                                                                                                                                                                               Spring/Summer 2022 | 6
Freehold Return Profile
            Free cash allocation
                                                                                                                                                           ▪      Current market opportunities leave room for
                                                                                                                                                                  growth and strategic acquisition opportunities
                                                                                                                                                           ▪      >$350 million in acquisitions in 2021
                                                                                                                     Portfolio                             ▪      Freehold continues to assess optimal
                                                                                                                     Growth                                       allocation of free funds between shareholder
                                                                                                                                                                  returns and portfolio growth, and will continue
                                                                                                                                                                  to execute on attractive opportunities that
                             2022E
                                                                                                                                                                  provide long term shareholder value
                           Funds from
                           Operations
                                                                                                                                                           ▪      Strong free funds flow continues to provide
                            $230-$250                                                                                                                             option value to return capital to shareholders
                             Million at                                                                            Continued                                      through continued evaluation of our monthly
                            US$75/bbl                                                                              Return of                                      base dividend
                                                                                                                    Capital                                ▪      Grew dividend every quarter in 2021 to our
                               WTI                                                                                                                                highest per share dividend level in the
                                                                                                                                                                  past five years

                                                                                                                 Balance                                   ▪      2022E net debt to funds from operations
                                                                                                                  Sheet                                           expected to remain below leverage target,
                                                                                                               Maintenance                                        exiting the year at 0.2x

                                                                                                                                                                                                                           Spring/Summer 2022 | 7
For illustrative purposes and should not be relied on as indicative of future results, assumes midpoint of FRU 2022E production guidance, US$75/bbl WTI, US$13/bbl heavy oil differentials, US$3/bbl light oil differentials, US$4/mcf
NYMEX, $4/mcf AECO. 2022 forecasts assume mid point of FRU 2022 production guidance
Not The Same Old Freehold
          Accomplishments over the past 24 months

                                                                                                                                                                                                 2022E
             Increasing Production
             Bringing Revenues      to Time
                                to All Record Levels
                                            Highs                                                                                                                                             14,200 boe/d
                                                                                                                                                                                 2018
             ▪     2022E production forecast to be ~14,200 boe/d, higher than                                                                                                11,400 boe/d
                   any period in Freehold’s history                                                                                            2012
             ▪     Organic drilling and royalty optimization efforts are directing                                                          7,600 boe/d

                   capital to Freehold lands

                                                                                  2024E
            Q3-2021                                                           ~14,800 boe/d               Increasing Production to Record Levels
                                                                                                          Organic Growth
          11,900 boe/d                                                                                    ▪    Without any further M&A, Freehold’s production is forecast to
                                                                                                               generate modest growth over the next several years
                                                                                                          ▪    Freehold can be patient looking for exceptional opportunities to
                                Guidance past 2022 is the average of published analyst estimates               add to our portfolio, or return excess cash flow to shareholders

             Reducing Cash Costs to Historic Lows                                                                                              2012
                                                                                                                                                                                 2018
                                                                                                                                             $5.21/boe
                                                                                                                                                                               $5.12/boe          2021
             ▪     Increased production, and exit from working interest
                                                                                                                                                                                                $3.71/boe
                   business, have significantly reduced cash costs
             ▪     Further acquisitions within existing framework, allow us to
                   grow our business with minimal added costs

                                                                                                                                                                                    Spring/Summer 2022 | 8

For illustrative purposes and should not be relied on as indicative of future results, US$75/bbl WTI, US$13/bbl heavy oil differentials, US$3/bbl light oil differentials,
US$4/mcf NYMEX, $4/mcf AECO. 2022 forecasts assume mid point of FRU 2022 production guidance
Sustainable Production Base & Dividend
          Accomplishments over the past 24 months

             Improving Royalty Netbacks                                                                                        2021 Realized Oil Price
                                                                                                                        CD Q1-22 Realized Oil Price
             ▪    US transactions have added higher value barrels
                                                                                                                         US Q1-22 Realized Oil Price
             ▪    Realized price improves materially (10% uplift)
                                                                                                                          Q1-2022 Realized Oil Price
                  with recently completed US acquisitions
                                                                                                                                                            C$60/bbl           C$80/bbl    C$100/bbl C$120/bbl

                                                                                  2022E
                                                                                 ~$240mm             Bringing FFO
                                                                                                     Increasing   to All Time
                                                                                                                Production  toHighs
                                                                                                                              Record Levels
                                                                                                     ▪    Freehold’s Funds from Operations (FFO) more robust than ever,
             2012                                          2018
           $103.9mm                                      $121.3mm                                         providing exceptional optionality to drive shareholder returns
                                                                                                     ▪    With increased oil weighting, Freehold provides significant upside
                                                                                                          to strong commodity price environment

             Introducing
             Dividend    Organic Growth
                      Sustainability and Growth                                                                                                                                                       2022E
                                                                                                                                                                                                   96¢ annually
             ▪    Freeholdany
                  Without  hasfurther
                               increased
                                      M&A,its Freehold’s
                                               dividend 6production
                                                          times sinceislate
                                                                        forecast
                                                                            2020 to                                                       2016

             ▪    generate modest growth
                  Dividend increases reflectover   the next several
                                              improvement           years prices,
                                                             in commodity
                                                                                                                                       54¢ annually

             ▪    increasedcan
                  Freehold  capital
                               be patient
                                    spendinglooking
                                               on our
                                                    forroyalty
                                                        exceptional
                                                               lands,opportunities
                                                                      and            to
                  add to our portfolio,
                  enhancements   we haveor continue
                                            made withto return
                                                        North American
                                                                capital to acquisitions
                                                                           shareholders

                                                                                                                                                                                          Spring/Summer 2022 | 9
For illustrative purposes and should not be relied on as indicative of future results, assumes midpoint of FRU 2022E production guidance, US$75/bbl WTI, US$13/bbl heavy oil
differentials, US$3/bbl light oil differentials, US$4/mcf NYMEX, $4/mcf AECO. 2022 forecasts assume mid point of FRU 2022 production guidance
North American Portfolio Overview

          US Production                                     CAN Production                                    Summary Statistics
           100%                                               100%                                                                          Canada    US          Total
                     Top 4 areas ~90%

                                                                                                              Gross Acres (mm)                6.2     0.8           6.9

            80%                                                80%                                            2022E Production (boe/d)       9,900   4,300        14,200

                                                                            Top 6 areas ~70%                     2022E Production (%)        70%     30%           100%

                                                                                                                 Oil (%)                     50%     54%           50%
            60%                                                60%
                                                                                                                 NGL’s (%)                    9%     19%           12%
                                                                                                                 Natural gas (%)             42%     28%           39%

            40%                                                40%                                               % Inv. Grade                ~15%    ~70%          ~35%
                                                                                                                 % Private                   ~45%    ~10%          ~35%
                                                                                                              # of Payors                    250     100           350
            20%                                                20%
                                                                                                              Average # of Rigs on Assets     9       17            21
                                                                                                              # of Producing Wells          11,000   5,500        16,500

              0%                                                 0%                                           Average Realized Price (Q1-2022, C$)             % Change
                                                                                                              Oil ($/bbl)                    $104    $119          +15%
                                                                                                              NGL’s ($/bbl)                   $65     $45         (30%)

                                                                                                              Natural Gas ($/mcf)            $4.20   $6.54         +56%

                                                                                                                                                     Spring/Summer 2022 | 10

Source: Company Reports. Investment grade revenue only accounts for public payors. YTD assumes prices as of
March 31, 2022. Table columns may not add due to rounding. Rig counts are current as of April 25 th, 2022.
Improved Economics
          Freehold’s business remains robust across a broad price range

                                                                    Post Dividend
             ~$45mm                                                 Free Cashflow                                          ~$150mm                       ▪ At current commodity price levels,
                                                                                                                                                           Freehold able to deliver returns to
                                                                                                                                                           shareholders several ways
             US$40WTI                                                    Oil Price                                          US$90WTI
                                                                                                                                                         ▪ US$1/bbl change in WTI
                                                                                                                                                           represents ~$2.5mm in funds from
               ~75%                                                  Payout Ratio                                              ~50%
                                                                                                                                                           operations
                                                                                                                                                         ▪ $0.25/mcf change in AECO
                                                                                                                                                           represents ~$1.6mm in funds from
             US$40WTI                                                    Oil Price                                          US$90WTI                       operations
                                                                                                                                                         ▪ At forecasted commodity price
                                                                                                                                                           assumptions, dividend payout
                 0.4x                                          2022E Exit Net Debt                                        Cash Surplus
                                                                                                                                                           remains slightly below 60%
                                                                                                                                                         ▪ Net debt levels significantly below
             US$40WTI                                                    Oil Price                                          US$90WTI                       1.0x trailing funds from operations

                                                                                                                                                                                            Spring/Summer 2022 | 11

For illustrative purposes and should not be relied on as indicative of future results. 2022E assumes midpoint of FRU 2022E production guidance, US$75/bbl WTI, US$13/bbl heavy oil differentials, US$3/bbl light oil
differentials, US$4/mcf NYMEX, $4/mcf AECO. Payout ratio is a Non-GAAP ratio or other specified financial measure. See “Non-GAAP Ratios and Other Financial Measures” in the Advisories.
Strong ESG Performance
ESG values continue to remain integral to Freehold’s business

Environmental                             Social                                    Governance
Emissions                                 Equity, Diversity & Inclusion             Board of Directors
▪ Factoring emissions intensity into      ▪ Focus on training and awareness         ▪ 78% of directors are independent
  acquisition candidates                    for leadership and employees
                                                                                    ▪ 30% gender diversity by 2023
▪ Top ESG rating amongst E&P              ▪ Full audit of HR policies and
                                            procedures to ensure best ED&I          ▪ Board diversity target in line with
  companies by Sustainalytics               practices are implemented                 peer group
▪ 2021 acquisitions ESG accretive         ▪ Developing internal committee to
▪ Completed analysis of emissions of        further develop ED&I strategy
  3rd party producers
                                          Community Support                         Compensation
▪ Achieved net zero Scope 1 and 2
  emissions through purchase of           ▪ Robust community support                ▪ 97% approval of ‘say on pay’
                                            program in 2021 focusing on
  carbon offsets                            mental health                           ▪ Newly adopted compensation
                                                                                      measures linked to ESG
Diversification                           ▪ Multi-year focused community              performance
                                            support strategy moving forward
▪ Hired new VP of Diversified Royalties
                                          ▪ Thematic programs allow Freehold        ▪ >70% of annual compensation at
  to identify and act on low-carbon
                                            to target initiatives both internally     risk for CEO
  opportunities and position for the
  future of energy                          and externally

                                                                                                       Spring/Summer 2022 | 12
Why Own Freehold
                                                                                                                       Strong Balance                                      Quality Long
                   High Margins                                         Sustainable                                    Sheet, Low Risk                                   Duration Assets,
                                                                                                                          Business                                       Multi-year Upside

         ▪ Greater than 97%                                  ▪ Dividend increased six                            ▪ Q1-2022 net debt to                              ▪ Positioned in the top tier
           operating margin provides                           consecutive quarters,                               trailing funds from                                oil plays – Eagle Ford,
           Freehold the ability to pay                         reflecting improved                                 operations 0.3x and                                Permian, Clearwater,
           a meaningful dividend                               commodity prices and                                target net debt to funds                           Viking, and Bakken
           across all commodity                                confidence in our                                   from operations of
Continued Strategy Execution
We remain committed to executing our North American strategy

                                            Acquisition          Continue to maintain
               Bigger, better
                                       environment remains        low-risk identity.
              Freehold. Royalty
                                         robust, improved          Sustainable debt,
           portfolio positioned to
                                          portfolio allows      dividend levels enables
               generate record
                                            Freehold to          Freehold the ability to
          volumes and funds flow
                                       remain patient and          provide immediate
            in 2022 and beyond
                                          opportunistic         returns to shareholders

                         Remain in early stages    Valuation remains
                           of Freehold’s North     compelling. Believe
                          American execution.       current share price
                          Multiple near-term           levels offer an
                         catalysts expected in     attractive entry point
                                  2022                for shareholders

                                                                                   Spring/Summer 2022 | 14
Supplemental
                Information

freeholdroyalties.com   TSX FRU   Quality Assets • Sustainable Dividends
The Royalty Advantage
          Freehold provides a lower risk/return proposition than traditional E&P’s

                                                                                                                                                             Environmental, Social,
             Financial Strength, Low Risk                                          Diversified Royalty Portfolio
                                                                                                                                                                  Governance

            ▪    Strong operating margins, enable                                ▪     Diversified North American                                      ▪    Our approach to ESG is rooted in
                 lower breakeven commodity                                             portfolio with exposure to                                           our collective desire to provide a
                 prices, enhancing the                                                 Permian, Eagle Ford, Viking,                                         long-term value proposition to
                 sustainability of payout                                              Clearwater, Bakken, Mississippian,                                   our shareholders
            ▪    Q1-2022 corporate netback of                                          and Cardium oil plays plus natural                              ▪    Royalties offer no exposure to
                 ~$66/boe                                                              gas plays targeting the Spirit                                       environmental pressures
            ▪    Ability to grow the dividend, and                                     River, Montney and Haynesville                                  ▪    Expect to update our ESG
                 generate meaningful free funds                                        via well funded producers                                            strategy through a sustainability
                 flow at in the current commodity                                ▪     6.2 million royalty acres in                                         report in mid 2022
                 price environment                                                     Canada, 0.8 million gross drilling                              ▪    Freehold has strong leadership,
            ▪    Financial flexibility with debt to                                    units in the U.S.                                                    an engaged and idea rich
                 funds from operations
Royalties vs. Exploration and Production Companies
          Royalties provide lower costs and higher returns to shareholders

                                                                             A Working Interest Barrel                                                         A Royalty Interest Barrel
                                                                             Operating netback                                                                 Operating netback
                                                                             ~ 60% of gross revenue                                                            ~ 100% of gross revenue
            ▪ The royalty model maintains a
              material netback advantage
              over traditional E&P’s
                                                                                                                                                                                                    100%

            ▪ Able to generate free funds flow                                                            15   %
                                                                                                          Royalties Paid                                                                            80%
              at lower commodity prices
                                                                                                          25   %
                                                                                                                                                                                                    60%
            ▪ Q1-2022 corporate netback                                                                   Operating Costs
                                                                                                                                                   Operating
              ~$66/boe
                                                                                                                                                   Netback                                          40%

            ▪ Freehold maintains a >95%
              operating margin enabling more
                                                                                                           60%
                                                                                                           Operating Netback
                                                                                                                                                   100%                                             20%
                                                                                                           (60% of gross revenue)                  of gross revenue
              return to shareholders
                                                                                                                                                                                                    0%

                                                                                                                                                                                 Spring/Summer 2022 | 17

Payout ratio and netback are Non-GAAP ratios or other specified financial measures. See "Non-GAAP Ratios and Other Financial Measures" in the Advisories.
2022E Guidance

                           2022E Annual Average               Guidance May 10, 2022

            Average production                      boe/d         13,750-14,750

            Funds from operations                   million         $230-$250

            West Texas Intermediate crude oil      US$/bbl           $75.00

            Edmonton Light Sweet crude oil         Cdn$/bbl          $88.00

            AECO natural gas                      Cdn$/mcf            $4.00

            NYMEX natural gas                     US$/mmbtu           $4.00

            Exchange rate                         US$/Cdn$            0.80

                                                                       Spring/Summer 2022 | 18

Source: Company Reports.
Safe, Lower Risk Asset Base

                                            2019     2020    2021            Q1-2022

Production (boe/d)                          10,628   9,781   11,844            13,676

Acquisitions (millions)                      $49      $7     $377                  -

Royalty acres (millions)                     6.7      6.3                        6.2

U.S. gross drilling unit acres (millions)                                        0.8

Tax pools (millions)                        $838     $775    $972

Net debt/funds from operations               0.8x    0.9x     0.5x               0.3x

                                                                     Spring/Summer 2022 | 19
Historical Canadian Drilling Results
                                               Drilling (gross wells)
                                                                                                        Activity continues to be
                                            2021          2020           2019                           focused on oil weighted
          Teine Energy                       78             77             108                          prospects in Freehold’s
                                                                                                           Canadian portfolio
          Surge Energy                       45             26             26

          Bonterra Energy                    38             17             19
                                                                                                                                                                  2019 Drilling
          Tamarack Valley                    35             15             n/a
                                                                                                        Deep                                                      2020 Drilling
          Tourmaline Oil                     20            n/a             n/a                                                                                    2021 Drilling
                                                                                                        Basin                      Clearwater                     Freehold Lands
          Whitecap Resources                 17             12             26                                                                                     Play Outlines

          Crescent Point                     13             18             25
                                                                                                                                           Mannville
          % of Total Wells                                                                                                                   Oil
                                             40             44             31
          Drilled on our Lands

             3rd Party
           Development              2021          2020         2019         2018
            FRU lands                                                                                                                       Viking
            FRU Drilling                                                                                        Cardium
                                      800           685        1,100        1,300
           Capital ($mm)                                                                                                                                        S.E. Sask.
          % of Total WCSB
                                      7%            7%           7%          8%
           Drilling Capital

                                                                                                                                     Shaunavon
                                                                                                                                                       Spring/Summer 2022 | 20

Source: Company Reports, CAPP. 3rd party capital development estimates assume average exploration and
development well costs per play times number of locations drilled. 2021 values reflect data as of Q4-2021
Strong Balance Sheet

           ▪ Freehold exited Q1-2022 with                                                 5.0x

                                                      Net Debt to Funds from Operations
             net debt to trailing funds from                                              4.5x
             operations of 0.3x                                                           4.0x

                                                                                          3.5x
           ▪ At current commodity price
             levels and the revised dividend                                              3.0x

             level, Freehold has capacity to                                              2.5x
             pay down debt or pursue                                                      2.0x
             acquisitions with free funds                                                 1.5x

           ▪ Freehold recently amended its                                                1.0x

             credit facility with an                                                      0.5x

             unchanged committed                                                          0.0x
             revolving 3-year facility at
                                                                                                 2010

                                                                                                        2011

                                                                                                               2012

                                                                                                                      2013

                                                                                                                                2014

                                                                                                                                       2015

                                                                                                                                              2016

                                                                                                                                                      2017

                                                                                                                                                             2018

                                                                                                                                                                       2019

                                                                                                                                                                              2020

                                                                                                                                                                                     2021
             $285 million
                                                                                                                             Sector Average      Freehold

                                                                                                                                                                    Spring/Summer 2022 | 21

Sector average sourced from Research estimates
Sector average reflects Canadian upstream producers
Dividend Sustainability
          Freehold has paid out $1.7 billion in dividends since initial IPO

            ▪ Freehold announced a 33% dividend                                                             100%
              increase from $0.06 to $0.08 per                                                              90%
              month as part of Q4-2021 results                                                              80%

            ▪ Forecast funds from operation in 2022                                                         70%                                                                              Stated Payout Range
              has our dividend positioned slightly

                                                                                                 Payout %
                                                                                                            60%
              below 60% payout range                                                                        50%

                                                                                                            40%
            ▪ At current commodity price levels,
              Freehold is able to pay a meaningful                                                          30%
              dividend with potential to grow as                                                            20%
              funds from operations improve                                                                 10%

            ▪ Freehold has increased its monthly                                                             0%

                                                                                                                                                                                                                                   2022E
                                                                                                                   Q4-18

                                                                                                                           Q1-19

                                                                                                                                   Q2-19

                                                                                                                                           Q3-19

                                                                                                                                                   Q4-19

                                                                                                                                                           Q1-20

                                                                                                                                                                   Q2-20

                                                                                                                                                                           Q3-20

                                                                                                                                                                                   Q4-20

                                                                                                                                                                                           Q1-21

                                                                                                                                                                                                   Q2-21

                                                                                                                                                                                                           Q3-21

                                                                                                                                                                                                                   Q4-21

                                                                                                                                                                                                                           Q1-22
              dividend the last six consecutive
              quarters

                                                                                                                                                                                                     Spring/Summer 2022 | 22

Payout ratio is a Non-GAAP ratio. See "Non-GAAP Ratios and Other Financial Measures" in the Advisories.
Top Decile Dividend Return
Freehold offers a compelling yield relative to peers

                                                             TSX Composite Index Base Dividend Yields (%)
▪ Freehold has increased the base dividend six
                                                        8%
  times over the last 18 months to the highest per                      FRU 1st out of
                                                                            239
  share level in the past five years                    7%

▪ Freehold’s base dividend yield ranks 1st out of the   6%
  239 TSX’s composite index constituents
                                                        5%
▪ While Freehold provides a top decile return
  versus its peers through the dividend, it remains     4%

  highly sustainable with room for growth
                                                        3%
▪ The base dividend remains well covered into
                                                        2%                                        No Base Dividend
  US$40/bbl WTI
▪ The dividend will continue to be evaluated to         1%

  ensure top tier shareholder returns                   0%

Source: Company Reports, Scotiabank

                                                                                           Spring/Summer 2022 | 23
Why the US?
          The rationale behind recent acquisitions

          More Opportunity                                                                          Future Upside – Remaining Drilling Inventory
           ▪ 70% of US land in major oil and gas
             producing states¹ is privately owned vs.
                                                                                                                                                                      20,000     Bubble size represents total
             only ~25% in Canada (WCSB)                                                                                                                              locations   remaining drilling inventory

           ▪ 650 million acres of mineral title in the
             US¹ vs. 270 million in Canada (WCSB)

                      Canada Land                                   US Land
                      Composition                                 Composition¹
                                                                                                                                   Permian
                                                                                                                                    Basin

                                                                                                                                                                                       Montney
                                                                                                                                                   Eagle                         Cardium
                                                                                                                                                   Ford                                     Clearwater

                 Mineral Title (25%)                            Mineral Title (70%)                    N. Dakota Bakken
                 Federal/Provincial (75%)                       Federal/State (30%)

                                                                                                                                                                                    Spring/Summer 2022 | 24

¹included states are those with significant proved oil reserves; Texas, Oklahoma, Louisiana, Nevada, North Dakota, Colorado, Wyoming, Pennsylvania, Ohio & West Virginia
Source: Company Reports, Enverus, Wood Mackenzie and Freehold internal estimates
Why the US?
          The rationale behind recent acquisitions

          More Capital Spending                                                                                       More Production
           ▪ Over last 10 years, 8 times the capital spending                                                           ▪ US oil production is almost 3 times, and gas
             in the US vs. Canadian upstream                                                                              production is almost 5 times Canada’s

                    $350                                                                                                        14                                                       140

                    $300                                                                                                        12                                                       120

                    $250                                                                                                        10                                                       100

                    $200                                                                                                         8                                                       80

                                                                                                                       mbbl/d

                                                                                                                                                                                               bcf/d
           US$bln

                    $150                                                                                                         6                                                       60

                    $100                                                                                                         4                                                       40

                     $50                                                                                                         2                                                       20

                      $0                                                                                                         0                                                       0
                           2011 2012 2013 2014 2015 2016 2017 2018 2019 2020 2021                                                    2011 2012 2013 2014 2015 2016 2017 2018 2019 2020
                                                                                                                        Source: EIA
                           U.S. Capital Spending              Canadian Capital Spending                                               US Oil      Canadian Oil     US Gas       Canadian Gas

                                                                                                                                                                         Spring/Summer 2022 | 25

Source: IHS and Canadian Association of Petroleum Producers. Canadian capital spending includes oil sands spending, Company Reports
Canada Surprises to the Upside
         Growth driven by well capitalized producers in Canada
                                                        Net Royalty Production
                                                       by Producer Core Area (boe/d)

                                              400                                                Clearwater Oil

                                              300
                                                                                                    Continued
                                                                                                aggressive growth
                                              200
                                                                                                  forecast by all
                                               Q1 2021 Exit                     Q1 2022 Exit        operators

                                              900                                               Deep Basin Gas

                                              650                                               Strong production
                                                                                                growth displayed
                                              400
                                                                                                   throughout
                                               Q1 2021 Exit                      Q1 2022 Exit       H2-2021

                                              600
                                                                                                Spirit River Gas
                                              500                                               13 wells licensed,
                                                                                                and in the process
                                              400                                                   of drilling
                                               Q1 2021 Exit                      Q1 2022 Exit

                                                                                                 Spring/Summer 2022 | 26
Source: Company Reports
Industry Drilling vs. Freehold

                                                                                                                         20,000                                                                                                   25
          ▪    Despite a slowdown in activity in western
               Canada, Freehold has historically achieved                                                                18,000

                                                                                            Gross Wells Western Canada
               growth in net drilling on its royalty lands                                                               16,000                                                                                                   20

                                                                                                                                                                                                                                       Freehold net Wells
          ▪    Approximately 6% of all spending in Western                                                               14,000
               Canada has occurred on Freehold lands over                                                                12,000                                                                                                   15
               the past five years
                                                                                                                         10,000
          ▪    Approximately 2% of all lower 48 spending                                                                  8,000                                                                                                   10
               occurred on Freehold land over the past five
                                                                                                                          6,000
               years
                                                                                                                          4,000                                                                                                   5
          ▪    Freehold’s royalty portfolio has materially                                                                2,000
               outperformed the broader Western Canadian
               Sedimentary Basin                                                                                             0                                                                                                    0

                                                                                                                                                                                                                          2022E
                                                                                                                                  2010

                                                                                                                                         2011

                                                                                                                                                 2012

                                                                                                                                                        2013

                                                                                                                                                               2014

                                                                                                                                                                      2015

                                                                                                                                                                             2016

                                                                                                                                                                                    2017

                                                                                                                                                                                              2018

                                                                                                                                                                                                     2019

                                                                                                                                                                                                            2020

                                                                                                                                                                                                                   2021
          ▪    Growth in net wells reflects the quality of
               Freehold’s underlying royalty portfolio
                                                                                                                                                Western Canadian Drilling                  Freehold Net Drilling

                                                                                                                                                                                                            Spring/Summer 2022 | 27
Source: Canadian Association of Energy Contractors
Forecast based on Petroleum Services Association of Canada, and Freehold Q4-2021 results.
Consistent Income Provider
                                                                                                                                         Freehold has provided almost
                                                                                                                                       $33/share over its history to its
                                                                                                                                        shareholders through dividend
                                                                                                                                                  payments
                      $2.50                                                                                                                                                                         $50

                                                                                                                                                                                                          Cumulative Dividends Per Share
                      $2.00                                                                                                                                                                         $40
Dividends per share

                      $1.50                                                                                                                                                                         $30

                      $1.00                                                                                                                                                                         $20

                      $0.50                                                                                                                                                                         $10

                      $0.00                                                                                                                                                                         $0

                                                                                                                                                                                            2022E
                              2000

                                     2001

                                            2002

                                                   2003

                                                          2004

                                                                 2005

                                                                        2006

                                                                               2007

                                                                                      2008

                                                                                             2009

                                                                                                    2010

                                                                                                           2011

                                                                                                                  2012

                                                                                                                         2013

                                                                                                                                2014

                                                                                                                                         2015

                                                                                                                                                2016

                                                                                                                                                       2017

                                                                                                                                                              2018

                                                                                                                                                                     2019

                                                                                                                                                                            2020

                                                                                                                                                                                     2021
                                                                        Annual Dividend Per Share                 Cumulative Dividend Per Share

                                                                                                                                                                                   Spring/Summer 2022 | 28
Cash Costs
          Freehold has shown a strong trending down in cash costs

                                                                                                $7.00

          ▪ Q1-2022 cash costs of                                                               $6.00

            $3.70/boe facilitate a
            strong corporate netback                                                            $5.00

                                                                           Cash Costs ($/boe)
            for Freehold
                                                                                                $4.00

          ▪ 2021 cash costs down                                                                $3.00
            11% year over year
                                                                                                $2.00
          ▪ Reduction in costs reflect
            disposition of working                                                              $1.00
            interest, lower lending and
            G&A costs                                                                           $0.00
                                                                                                        Q1-20     Q2-20      Q3-20     Q4-20         Q1-21      Q2-21       Q3-21       Q4-21      Q1-22

                                                                                                        Operating Costs ($/boe)      Interest Expense ($/boe)           General & Administrative ($/boe)

                                                                                                                                                                                    Spring/Summer 2022 | 29

Cash costs are equal to operating costs + interest expense + G&A costs + share based compensation payments (see non-GAAP Financial Measures)
Payout ratio and netback are Non-GAAP ratios or other specified financial measures. See "Non-GAAP Ratios and Other Financial Measures" in the Advisories.
Royalty Production History

                                       16,000

                                                                                                                                                   14,005                14,250*
                                       14,000                                                                                                                  13,676
          Royalty Production (boe/d)

                                       12,000                                                                                    11,137   11,265
                                                                                    10,618                              10,946
                                                10,139   10,311   10,149   10,315
                                       10,000                                                                  9,605
                                                                                             9,150    9,096

                                        8,000

                                        6,000

                                        4,000

                                        2,000

                                           0

                                                                                                                                                                           2022E
                                                 Q1-19

                                                          Q2-19

                                                                   Q3-19

                                                                            Q4-19

                                                                                     Q1-20

                                                                                              Q2-20

                                                                                                       Q3-20

                                                                                                                Q4-20

                                                                                                                         Q1-21

                                                                                                                                  Q2-21

                                                                                                                                           Q3-21

                                                                                                                                                    Q4-21

                                                                                                                                                                 Q1-22
                                                                                                                                                            Spring/Summer 2022 | 30

*Assumes the midpoint of 2022E production guidance.
Diversified Royalty Payors
Our top payors remain well financed with no significant concentration risk

                                                                       Spring/Summer 2022 | 31
Disciplined Acquirer
Freehold will continue to look for opportunities that enhance the resiliency
and durability of our portfolio across all commodity price cycles

                                                                           Cost    Initial Production
                             Year     Area                          ($ millions)    Acquired (boe/d)
                             2012     AB, SK and BC                          60                       600
                             2013     Numerous small acquisitions            10                        30
                             2014     SK/MB/AB                              248                    1,500
                             2015     SK/AB/BC                              410                    2,100
                             2016     SK/AB                                 162                    1,700
                             2017     SK/AB                                  87                       420
                             2018     SK/AB                                  62                       275
                             2019     SK/AB, US                              50                       410
                             2020     US                                      8                          -
                             2021     US                                    377                    4,400
                             TOTAL                                     $1,475                   10,895

                                                                                   Spring/Summer 2022 | 32
Advisories

Forward-Looking Statements
This presentation offers our assessment of Freehold’s future plans and operations as at May 10th, 2022 and contains forward-looking information including, without limitation, the expectation of being able to pay dividends with WTI pricing as
low as $40/bbl; the expectation that current market opportunities leave room for growth and strategic acquisition opportunities; Freehold's expectation to continue to assess optimal allocation of free funds between shareholder returns and
portfolio growth, and expectation of continuing to execute on attractive opportunities that provide long term shareholder value; the expectation that strong free funds flow continues to provide option value to return capital to shareholders
through continued evaluation of our monthly base dividend; expected year end 2022 net debt to funds from operations ratio; 2022 forecast funds from operations; 2022 forecast production; the expectation that organic drilling and royalty
optimization efforts are directing capital to Freehold lands; the expectation that without any further mergers and acquisition activity, Freehold’s production is forecast to generate modest growth over the next several years; the expectation
that Freehold can be patient looking for exceptional opportunities to add to our portfolio, or return excess cash flow to shareholders; the expectation that with increased oil weighting, Freehold provides significant upside to strong commodity
price environment; remaining future drilling inventory; expected production growth in certain areas that Freehold has an interest; 2022 forecast production in Canada and the United States; certain sensitivities of changes in WTI pricing and
natural gas pricing and the effects on free cash flow, payout ratio and exit net debt; forecast payout for 2022; the expectation that in the absence of acquisitions and further dividend increases able to pay down debt further in 2022; the
expectation that Freehold's royalty portfolio positioned to generate record volumes and funds flow in 2022 and beyond; the expectation that multiple near-term catalysts for Freehold's North American execution expected in 2022; and the
expectation to update our ESG strategy through a sustainability report in mid 2022; and forecast 2022 dividends.

This forward-looking information is provided to allow readers to better understand our business and prospects and may not be suitable for other purposes. By its nature, forward-looking information is subject to numerous risks and
uncertainties, some of which are beyond our control, including: volatility in market prices for crude oil, NGL and natural gas; the impacts of the Russian-Ukraine war and associated sanctions on the global economy and commodity prices; the
continuing impact of the COVID-19 pandemic on demand and commodity prices; future capital expenditure levels; future production levels; future exchange rates; future tax rates; future legislation; the cost of developing and expanding our
assets; the impacts of inflation and supply chain shortages on the operations of our industry partners and royalty payors; our ability and the ability of our industry partners and royalty payors to obtain equipment in a timely manner to carry
out development activities; our ability to market our product successfully to current and new customers; our expectation for the consumption of crude oil, NGL’s and natural gas; our expectation for industry drilling levels on our royalty lands;
the impact of competition; our ability to obtain financing on acceptable terms; our ability to add production and reserves through our development and acquisitions activities; lack of pipeline capacity; currency fluctuations; changes in income
tax laws or changes in tax laws, regulations, royalties, or incentive programs relating to the oil and gas industry; reliance on royalty payors to drill and produce on our lands and their ability to pay their obligations; uncertainties or imprecision
associated with estimating oil and gas reserves; stock market volatility and our ability to access sufficient capital from internal and external sources; a significant or prolonged downturn in general economic conditions or industry activity;
incorrect assessments of the value of acquisitions; competition for, among other things, capital, acquisitions of reserves, undeveloped lands and skilled personnel; geological, technical, drilling, and processing problems; and environmental risks
and liabilities inherent in oil and gas operations. Risks are described in more detail in Freehold’s annual information form for the year ended December 31, 2021 which is available under Freehold’s profile on SEDAR at www.sedar.com.

Key operating assumptions with respect to the forward-looking statements contained in this presentation are provided throughout this presentation. In addition, with respect to forward-looking statements contained in this presentation, we
have made assumptions regarding, among other things, future commodity prices, future capital expenditure levels, future production levels, future exchange rates, future tax rates, future legislation, the cost of developing and producing our
assets, our ability and the ability of our lessees to obtain equipment in a timely manner to carry out development activities, our ability to market our oil and gas successfully to current and new customers, our expectation for the consumption
of crude oil and natural gas, our expectation for industry drilling levels, our expectation as to the drilling results of wells drilled on our royalty lands, our ability to obtain financing on acceptable terms, shut-in production, production additions
from our audit function and our ability to add production and reserves through development and acquisition activities.

You are cautioned that the assumptions used in the preparation of such information, although considered reasonable at the time of preparation, may prove to be imprecise and, as such, undue reliance should not be placed on forward looking
information. We can give no assurance that any of the events anticipated will transpire or occur, or if any of them do, what benefits we will derive from them. The forward-looking information contained herein is expressly qualified by this
cautionary statement. To the extent any guidance or forward looking statements herein constitute a financial outlook, they are included herein to provide readers with an understanding of management's plans and assumptions for budgeting
purposes and readers are cautioned that the information may not be appropriate for other purposes. Our policy for updating forward-looking statements is to update our key operating assumptions quarterly and, except as required by law, we
do not undertake to update any other forward-looking statements.

You are further cautioned that the preparation of financial statements in accordance with International Financial Reporting Standards requires management to make certain judgments and estimates that affect the reported amounts of assets,
liabilities, revenues, and expenses. These estimates may change, having either a positive or negative effect on net income, as further information becomes available and as the economic environment changes.

                                                                                                                                                                                                                    Spring/Summer 2022 | 33
Advisories continued

Drilling Locations
This presentation discloses anticipated future drilling or development locations associated with Freehold assets and in certain circumstances specific area where Freehold has an interest. Of the 20,000 gross future drilling locations, 4,632
represent booked locations that have been attributed proved and/or probable reserves in the evaluations of the Corporation's Canadian and United States oil and gas reserves effective as of December 31, 2021 as prepared by Freehold's
independent qualified reserves evaluators, Trimble Engineering Associates Ltd. and RSC Group, Inc. The remaining locations are currently considered unbooked locations. Unbooked locations are generated by internal estimates of Freehold
management based on prospective acreage and an assumption as to the number of wells that can be drilled per section based on industry practice and internal review. Unbooked locations do not have attributed reserves or resources. Unbooked
locations have been identified by management as an estimation of the multi-year drilling activities on the Acquired Assets based on evaluation of applicable geologic, seismic, engineering, historic drilling, production, commodity price assumptions
and reserves information. There is no certainty that all unbooked drilling locations will be drilled and if drilled there is no certainty that such locations will result in additional oil and gas reserves, resources or production. Freehold has no control
on whether any wells will be actually drilled in respect of such unbooked locations. The drilling locations on which wells are actually drilled will ultimately depend upon the capital allocation decisions of royalty payors who have working interests in
respect of such drilling locations and a number of other factors including, without limitation, availability of capital, regulatory approvals, oil and natural gas prices, costs, actual drilling results, additional reservoir information that is obtained and
other factors. While certain of the unbooked drilling locations have been de-risked by drilling existing wells in relative close proximity to such unbooked drilling locations, other unbooked drilling locations are farther away from existing wells where
management has less information about the characteristics of the reservoir and therefore there is more uncertainty whether wells will be drilled in such locations and if drilled there is more uncertainty that such wells will result in additional oil
and gas reserves, resources or production. Upon purchase of the Acquired Assets, Freehold will have the reserves associated with the Acquired Assets evaluated by an independent qualified reserves evaluator in accordance with the requirements
of National Instrument 51-101 – Standards of Disclosure for Oil and Gas Activities and it will be determined at such time whether any of the unbooked drilling locations disclosed herein are booked for the purposes of such evaluation with
associated proved or probable reserves.

Production
All production disclosed herein is considered net production for the purposes of National Instrument 51-101 – Standards of Disclosure for Oil and Gas Activities, which includes Freehold's working interest (operating and non-operating) share after
deduction of royalty obligations, plus our royalty interests. Since Freehold has minimal working interest production, net production is substantially equivalent to Freehold's royalty interest production. In the first quarter of 2022, Freehold's net
production of 13,676 boe/d consisted of 5,305 bbls/d of light oil, 1,139 bbls/d of heavy oil, 1,757 bbls/d of natural gas liquids and 32,845 mcf/d of natural gas. For the full year of 2021, Freehold's net production of 11,884 boe/d consisted of
4,342 bbls/d of light oil, 1,184 bbls/d of heavy oil, 1,217 bbls/d of natural gas liquids and 30,608 mcf/d of natural gas.

Conversion of Natural Gas to Barrels of Oil Equivalent (BOE)
The 6:1 boe ratio is based on an energy equivalency conversion method primarily applicable at the burner tip. It does not represent a value equivalency and is not based on either energy content or current prices. While the boe ratio is useful for
comparative measures, it does not accurately reflect individual product values and might be misleading, particularly if used insolation. As well, given the value ratio, based on the current price of crude oil to natural gas, is significantly different
from the 6:1 energy equivalency ratio, using a 6:1 conversion ratio may be misleading as an indication of value.

                                                                                                                                                                                                                     Spring/Summer 2022 | 34
Advisories continued

Non-GAAP Financial Measures
Within this presentation, references are made to terms commonly used as key performance indicators in the oil and gas industry. We believe that netback, payout ratio and cash costs are useful supplemental measures for management and
investors to analyze operating performance, financial leverage, and liquidity, and we use these terms to facilitate the understanding and comparability of our results of operations and financial position. However, these terms do not have any
standardized meanings prescribed by generally accepted accounting principles ("GAAP") and therefore may not be comparable with the calculations of similar measures for other entities.
Netback, which is calculated on a boe basis as average realized price less production and ad valoreum taxes, operating expenses, general and administrative and cash interest charges, represents the per unit cash flow amount allowing the
Company to benchmark how changes in commodity pricing, net of production and ad valoreum taxes, and our cash-based cost structure compare against prior periods.
Payout ratios are often used for dividend paying companies in the oil and gas industry to identify dividend levels in relation to funds from operations that are also used to finance debt repayments and/or acquisition opportunities. Payout ratio
is calculated as dividends paid as a percentage of funds from operations.
Cash costs, which is also calculated on a boe basis, is comprised of recurring cash based costs, excluding taxes, reported on the statements of operations. For Freehold, cash costs are identified as operating expense, general and
administrative expense and cash-based interest and financing charges and share-based pay outs. Cash costs allow Freehold to benchmark how changes in its manageable cash-based cost structure compare against prior periods.
For further information related to these non-GAAP terms, including details of how these ratios are calculated, see our most recent management's discussion and analysis, which is available on SEDAR at www.sedar.com and is incorporated
herein.
This presentation also contains the capital management measures of working capital, net debt, capitalization and net debt to funds from operations as defined in Note 11 to the condensed consolidated financial statements as at and for the
three months ended March 31, 2022.

                                                                                                                                                                                                              Spring/Summer 2022 | 35
Investor Relations
                  tf.   888.257.1873
                  t.    403.221.0833
                  w.    freeholdroyalties.com

freeholdroyalties.com     TSX FRU               Quality Assets • Sustainable Dividends
You can also read