Investor Presentation March 2021 Brian Vaasjo, President & CEO Sandra Haskins, SVP Finance & CFO - Capital Power

Page created by Linda Santos
 
CONTINUE READING
Investor Presentation March 2021 Brian Vaasjo, President & CEO Sandra Haskins, SVP Finance & CFO - Capital Power
Investor Presentation
March 2021
Brian Vaasjo, President & CEO
Sandra Haskins, SVP Finance & CFO
Investor Presentation March 2021 Brian Vaasjo, President & CEO Sandra Haskins, SVP Finance & CFO - Capital Power
Growth-oriented North
American power producer
• Highly-contracted, young and diversified    3x
  portfolio
• Targeting 10-12% total shareholder return
• Targeting net carbon neutral before 2050

Operational facilities
  6,490 MW

 28 facilities

Projects under development
   985 MW

 7 renewable projects and                                       In Operation
                                                                                                Under construction and
                                                                                                in advanced development
 Genesee 1&2 repowering
                                               Natural Coal   Solar Wind Waste Solid Landfill        Solar Wind
                                                Gas                      Heat Fuel Gas                                    2
Investor Presentation March 2021 Brian Vaasjo, President & CEO Sandra Haskins, SVP Finance & CFO - Capital Power
Resiliency and innovation through COVID-19
Priority to keep our employees and families healthy
Operations
  • Comprehensive health and safety protocols at plants
     successful
  • Managed 7 major planned outages successfully in 2020

Corporate
   • Ongoing remote work arrangements
   • No change in efficiency or effectiveness

Post COVID-19
   • Learnings will significantly enhance and transform the future
     of how we work
                                                                     3
Investor Presentation March 2021 Brian Vaasjo, President & CEO Sandra Haskins, SVP Finance & CFO - Capital Power
Continuation of our goal towards net carbon neutral
                   Decarbonization
                     Strategies                   Today             2024 and beyond
                                           Building and acquiring
                  Investing in emissions                                Integration of
                                             wind and solar in
                     free renewables                                storage technologies
                                           Canada and the U.S.

                                                                      Reduce emissions
  Net carbon          Investing in             Acquiring key        profile through carbon
neutral by 2050      critical natural       facilities in Canada      utilization and be
                     gas generation            and the U.S.            hydrogen ready

                  Transitioning heritage   Repower and move to
                   coal generation to       100% natural gas
                       natural gas             capability

                                                                                             4
Investor Presentation March 2021 Brian Vaasjo, President & CEO Sandra Haskins, SVP Finance & CFO - Capital Power
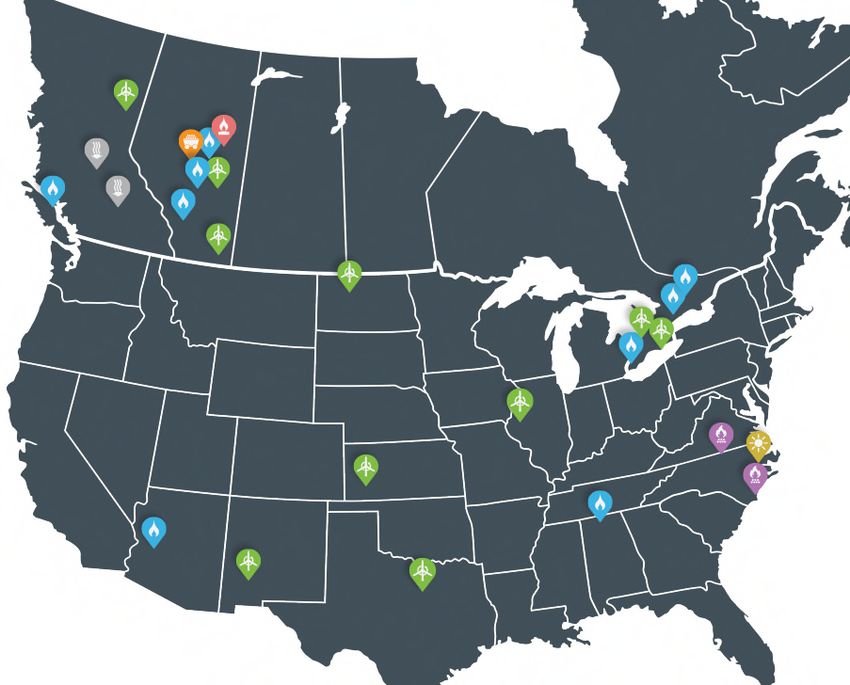
Strategic path to a low-carbon future
Accelerated growth in renewables
   • 7 development projects totaling 425 MW; 100 MW Buckthorn Wind acquisition
Off-coal in 2023
   • Retirement of Roxboro and Southport power plants in 2021
   • Genesee site 100% natural gas in 2023
Natural gas critical to net carbon neutral transition
   • Reliable, affordable, flexible power
   • Carbon conversion and hydrogen technology enhance natural gas resiliency

                                                                                 5
Investor Presentation March 2021 Brian Vaasjo, President & CEO Sandra Haskins, SVP Finance & CFO - Capital Power
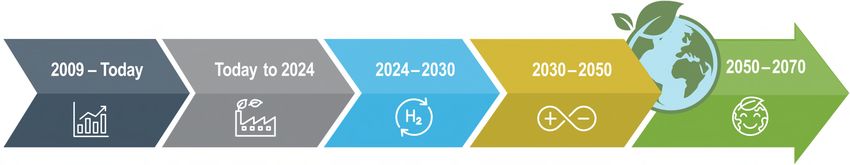
Canadian Federal Government GHG Plan
Plan includes a proposed increase in carbon                            Initial Assessment
pricing to $170/tonne by 2030, among range of
                                                                    Alberta
measures and programs for Canada to exceed                          • Near/medium term:
2030 GHG commitments                                                  positive
                                                                    • Long-term: continue to
• Plan is expected to increase demand through electrification         assess implications
• Plan supports Capital Power’s carbon mitigation strategies,
  including carbon conversion and hydrogen                          Ontario
• Increases renewable growth opportunities                          • Short-term: protected by
                                                                      contracts
• Our natural gas assets are well-positioned to support             • Long-term: continue to
  reliable, affordable and sustainable electricity in Alberta, BC     assess impacts; remain
  and Ontario                                                         optimistic for re-contracting

                                                                                                      6
Investor Presentation March 2021 Brian Vaasjo, President & CEO Sandra Haskins, SVP Finance & CFO - Capital Power
Alberta power market
• Market showing strong recovery from impacts of COVID-19
  and low oil prices
• Supply has responded to lower demand with other market
  participants announcing the retirement of Sundance 3 and
  delays on some cogen and renewable projects
• Starting in 2021, all output controlled by commercial market
  participants

                                                                 7
Alberta power market
COVID-19 and crude oil impact
                                                                                                                       • When comparing 2020 to 2019
                                                                                                     (1)                 actual 30-day rolling averages,
                        Alberta Internal Load (30-day rolling average)
 (MWh)                                                                                                                   largest yoy decline in power demand
 11,000                                                                                                                  was 7.2% due to COVID-19
                                            2019        2020            2021
                                                                                                                         pandemic and low crude oil prices
 10,500
                                                                                                                       • Demand started to recover as the
                                                                                                              1.1%
                                                                                                                         economy re-opened
 10,000
                                                                                                             decline
             WHO declares
                                                                                                                       • Yoy demand decrease of 1.1% at
  9,500
              COVID-19                                                                                                   end of 2020
              a pandemic
                                                                                                                       • 2021 demand outlook shows
  9,000                                                                                                                  recovery but still some uncertainty
                                                                                       2.3%
                                                                                      decline                            regarding the rate of recovery
  8,500
                                                    7.2%                                                               • Daily AIL demand record of 11,230
                                                   decline
  8,000
                                                                                                                         MWh on Feb 9/21 due to extreme
        31-Jan 28-Feb     31-Mar   30-Apr   31-May   30-Jun    31-Jul    31-Aug   30-Sep   31-Oct   30-Nov    31-Dec
                                                                                                                         cold weather

1) Source: AESO, Capital Power
                                                                                                                                                               8
Alberta commercial portfolio optimization
Strong track record of value creation and managing merchant risk exposure

                                                                                                         2021                         2022      2023

                                   % sold forward(1)                                                      29%                         27%       21%

                                   Contracted prices(1) ($/MWh)                                      Low-$60                         Mid-$50   Mid-$50

                                   Current forward prices(2)                                              $73                         $61       $53
                                   ($/MWh)

     Forward prices have increased from a low-$50/MWh at end of Q3/20 to $60-$70 range for
              2021-22 reflecting a more positive outlook in the Alberta power market
      Strong track record of value creation and managing merchant risk exposure from portfolio optimization

1) As of December 31, 2020. Based on the Alberta baseload plants plus a portion of Joffre and the uncontracted portion of Shepard.
2) As of March 8, 2021. Forward price for 2021 is a blend of Jan 1-Mar 8 settled prices and Apr-Dec forward prices.

                                                                                                                                                         9
Repowering Genesee 1&2 delivers long term value
Lower operating costs, useful asset life extension, long-term cash flow growth

     Favourable economics – $997M capital cost, 20%+ levered returns, ~$0.70 average
     accretion to AFFO/share

         560 MW net capacity increase (total 1,360 MW)

          Best-in-class NGCC technology with heat rate (6.6-6.7 GJ/MWh) advantage over
          all current and announced natural gas facilities

         Significant environmental benefits – intensity of 0.35t/MWh; below Alberta’s TIER
         regulation benchmark of 0.37t/MWh

     Carbon conversion ready and hydrogen capable (30% to start and upgradable to 95%)

                                                                                             10
Genesee more competitive after repowering
 Estimated variable cost merit order in 2025
$/MWh                                                                                   Older CTG units not
                                                                                        competitive (retire?)
  80
                                                                     Older CTG Units
  70
  60                                                       GN1&2 Dual Fuel
  50                                   GN3 Dual Fuel
  40                                                                                    Older CTG Units
  30
                     GN 1&2 become
  20                  very efficient
                                                                     GN3 CTG       GN 3 remains in
  10                                                                               middle of stack
                                                    GN1&2 Repower
   0
        0             5,000                   10,000                 15,000               20,000
                                                    Capacity (MW)

                                        Dual Fuel                   Repowering
                                                                                                            11
Growth strategy
• Growth strategy aligns with our sustainability goals
• Target markets support $500M annual capital investment
• Strong renewable growth pipeline in Alberta and the U.S.
• Potential acquisition of mid-life natural gas assets
• Targeting 10-12% total shareholder return over the long term

                                                                 12
Dynamic pipeline supports resilient & responsible growth

                                                                                                  Solar
                                                                                                  8 sites
                                                    6 sites                                       Potential: 360 MW
                                                                                        8 sites   Committed: 276 MW
                                                                Fuel                              Total: 636 MW
                                                             Development
                                                                Sites                             Wind
                                                 3 sites                                          9 sites
                                                                                                  Potential: 1,129 MW
                                                                            9 sites               Committed: 151 MW
                                                                                                  Total: 1,280 MW

                                                                                                  Storage
                                            2021 Growth Target:                                   3 sites
                                               Invest $500M                                       Potential: TBD

                                                                                                  Gas
                                                                                                  6 sites
                                                                                                  Potential: 1,700 MW
                             Under Construction and in
                               Advanced Development

                                               Future
                                         Development
                                                           Natural Solar Wind Storage
                                                            Gas

                                                                                                                   13
Securing long term PPAs delivers stable cash flows
Strathmore Solar                                3 North Carolina solar projects
• Long Term 25-year PPA                         • Long Term 20-year PPA
• 40.5 MW, 100% output                          • 160 MW, 100% output
• Bundled energy and environmental attributes   • Bundled energy and environmental attributes
• Investment grade counterparty                 • Investment grade counterparty
• Shows that we maintain our competitive        • Shows that we are competitive in the U.S.
  advantage in Alberta

     ESG priorities drive growing corporate demand for renewables

                                                                                                14
Gas generation vital for reliability and flexibility
                                                                    Forecasted natural gas generation in the US(1)
Growth drivers                                                           2020                                 2040
• Coal & nuclear retirements
• Renewables proliferation                                                                                       Coal
• Low gas prices
                                                                   Gas
                                                                         717 GW          +205 GW Gas          719 GW
Value of incumbent assets                                                         Coal   -202 GW Coal
                                                                                                        Gas
• High barrier to entry
• Strategic placement
• Optimization potential

1) Source: Bloomberg New Energy Finance, New Energy Outlook 2020

                                                                                                                        15
Natural gas: necessary long-term role in power
• Sustainable – enables the
  penetration of more
  renewables
• Flexible – dispatchable when
  you need it (availability >90%);
  offline when you don’t
• Power Dense – can provide
  80 MW/acre
• Decarbonizable – with carbon
  conversion and hydrogen
• Affordable – keeping costs of
  decarbonization lower for
  consumers
                                     Source: Brattle Group,
                                     “The Emerging Value of CCUS For Utilities”, August 2020

                                                                                               16
Continued growth in renewable assets
7 projects — 5 solar, 2 wind                     Adjusted EBITDA from renewables
• 427 MW total                                   27% in 2020 projected to increase to 34% in 2025
• COD in 2021-22                                 (based on existing projects)
• 4 projects with long-term PPAs; in               Renewables
  discussions for potential offtake                Natural gas
  contracts for remaining projects                 Natural gas/coal dual-fuel
• Expected annualized adjusted EBITDA
  of $70M                                                     2020              2023F            2025F

                     Enchant
% split of             Solar
annualized                           Whitla 2
EBITDA
                                                        43%           30%                  34%
                 Hornet Solar                                                                        66%
  Solar         Hunter’s Cove
                         Solar        Whitla 3                                  Off-coal
  Wind           Bear Branch                                        27%
                         Solar

                            Strathmore Solar

                                                                                                           17
Financial strategy
• Deploying capital for the repowering of Genesee 1&2 and
  growing renewables portfolio
• Disciplined growth with focus on contracted cash flows and
  sustainability goals
• Dividend growth of 7% in 2021 and 5% in 2022
• Maintain investment grade credit rating

                                                               18
Overview of financial strategy

 Fund growth      • Fund growth in a cost-effective manner
  towards low
 carbon future    • Access various sources of capital and seek innovative ways to fund growth

    Maintain      • Maintain competitive cost of capital
  investment
  grade credit    • Ensure access to capital markets through business cycles
     rating       • Provides stability to the dividend

 Deliver annual   • Provide dividend stability through contracted cash flow profile
   dividend
     growth       • Annual dividend growth within long term AFFO payout ratio target of 45% to 55%

    Manage        • Properly laddered debt maturities
 financing risk   • Effective management of interest rate, foreign exchange and counterparty risk

                                                                                                    19
Capital allocation balance
                                                    • Balanced focus between dividend
   Dividend                    Growth                 growth and growth opportunities
    growth                   opportunities          • Growth focused on a lower-carbon
                                                      fleet
                         • Existing asset           • Allocating capital strategically to
                           improvements               develop, commercialize and
                         • Development projects       implement technologies to support
                         • Acquisitions               sustainability targets
                                                    • Share buybacks and debt
                                                      repayment are considered during
              Share buyback &
                                                      periods of limited growth
               debt repayment
                                                      opportunities

               Efficient capital allocation creating shareholder value

                                                                                            20
History of stable dividend growth

  Annualized dividend                                                                                                                               $2.30
                                                                                                                                            $2.19
     per share(1,2)                                                                                                               $2.05              5%
                                                                                                                       $1.92                 7%
                                                                                                            $1.79
                                                                                                   $1.67
                                                                            $1.56
                                                     $1.46
                               $1.36
        $1.26
                                                     42%                    50%                    45%      45%         35%       40%
                                                   Payout(3)               Payout                 Payout   Payout      Payout    Payout

     2013 Y/E              2014 Y/E               2015 Y/E               2016 Y/E               2017 Y/E   2018 Y/E   2019 Y/E   2020 Y/E   2021T   2022T

                                                     Long-term AFFO payout ratio target of 45-55%
1) Subject to market conditions, economic outlook, cash flow forecast, and Board approval at the time.
2) 2013 to 2020 annualized dividend based on year-end quarterly common shares dividend declared.
3) Dividend payout ratio based on dividends declared per year as a percentage of AFFO per share.
                                                                                                                                                            21
5-year growth in key financial metrics
  ($M)                       Adjusted EBITDA normalized

   1100                      AFFO Normalized                                                                             $6.00
                             AFFO/share Normalized
   1000
                                                                                                                         $5.00
     900

     800                                                                                                                 $4.00

     700
                                                                                                                         $3.00
     600

     500                                                                                                                 $2.00

     400
                                                                                                                         $1.00
     300

     200                                                                                                                 $0.00
                          2016                           2017                               2018   2019   2020   2021T

                5-year growth supported by average growth capex of $750M(3) per annum
1) Normalized for Milner line loss accrual and non-recurring 2019 Arlington toll payment.
2) Normalized for non-recurring 2019 Arlington toll and payment of Milner line loss.
3) Includes gross capex on Tax Equity Investor projects.
                                                                                                                                 22
Cash flow and financing outlook
Positive cash position and credit facilities to fund growth projects in 2021

                                                    Sources                                                                                      ($M)

                                                    FFO(1) + off-coal compensation                                                               $650

                                                    Capital markets/debt refinancing/asset recycling                                             $510

                                                    DRIP reinvestment                                                                             $70

                                                                                                                                                $1,230

                                                    Uses

                                                    Committed growth/enhancement capex                                                           $740

                                                    Dividends(3)                                                                                 $300

                                                    Debt repayments(2)                                                                           $430

                                                    Sustaining & maintenance capex                                                                $85

                                                                                                                                                $1,555

                                                    Change in cash position                                                                     ($325)

1) Funds from operations (FFO) is a non-GAAP financial measure.
2) Includes principal payments on finance lease payables but excludes debt repayments to tax equity investor and equity accounted investment.
3) Includes preferred and common dividends and preferred dividend tax.
                                                                                                                                                         23
Capital program
($M)
                                                                              Capital deployed to renewables and
                   350                                                           repowering provide significant
                                                                                financial contributions in 2022+
                                                                 370

                   360

                                                                 180               245
                                                                                                           25                        5
                    30                                           30                                  -
                                                                                   10                      95                       110
                    85                                           90                60
                2021                                         2022              2023                      2024                      2025
                                                                                                                   (1)
               Sustaining capex                          Enhancement & GPS capex         Other committed capital         Genesee repower

1) Includes net capex after Tax Equity Investor contributions.
                                                                                                                                           24
EBITDA growth from 7 renewable projects

   Annualized EBITDA of ~$70M

           Enchant
            Solar
                            Whitla 2                       Average annualized
                                                             EBITDA ~$70M
      Hornet Solar                                         and AFFO of ~$55M
      Hunter’s Cove                                      after completion in late 2021
          Solar
      Bear Branch
                             Whitla 3                             and 2022
         Solar
                     Strathmore
                        Solar

 Full-year financial contributions starting in 2023 from growth capex in 2021-22

                                                                                         25
Managing Alberta carbon exposure
                                              CPC Alberta Emissions Expense                           Carbon Offset Savings
   ($M)

                    41

                                                          52

                                                                                               20
                   160

                                                         102
                                                                                               87

                                                                                                                                                                          3
                                                                                                                                    17                                    14
                  2021                                 2022                                 2023                                  2024                                   2025

                     Low-cost offsets and transition to gas protect and enhance asset value
1) Based on current Alberta TIER regulation and assumes carbon prices increase to $40/tonne in 2021 and $50/tonne in 2022. Does not reflect Federal Government policy.
                                                                                                                                                                                26
Sustainability / investment opportunity
• Advancing a low carbon future with a clear path to net carbon
  neutral before 2050
• Natural gas generation has a necessary long-term role in power
• Accelerating ESG initiatives

                                                                   27
Capital Power’s (R)Evolution
      2009 to Today           Today to 2024           2024 – 2030           2030 – 2050                   2050 – 2070

• Genesee efficiency   • Complete repowering     • Expand CCU         • Net carbon neutral     • Physical
  program,12% decrease   and off coal            • Pilot/demo           via physical             decarbonization
  in GHG by 2021       • Invest in renewables,     hydrogen project     solutions on natural
• Over $3B invested      strategic natural gas                          gas assets and
  in/committed to                                                       portfolio “offsets”
                       • Carbon conversion:
  renewables             C2CNT and Beyond                             • Renewables +
• C2CNT interest                                                        storage as
                       • Technology research/                           baseload
  increased to 40%       collaboration
• Over $40M invested   • Pilot/demo renewables
  in carbon capture      + storage project
  research
• Completed two
  CCUS FEED studies
  (2007/2011)

                                                                                                                   28
Pathway to net carbon neutral
      Renewables with storage
      Deploying carbon conversion and hydrogen blending at
      thermal facilities
      Limited offsets used

                                                             29
Pathways to decarbonization at Genesee
          Alternative Hydrogen                   Post-Combustion     Utilization
                Pathways                          CCS Pathways       Pathway

Hydrogen (Fort Sask)      CO2        CCS / EOR
                                                    Natural Gas       Natural Gas

  Hydrogen Pipeline
                                                     Genesee           Genesee

      Genesee

                                                  Post-Combustion   Post-Combustion
                                                      Capture           Capture

 Hydrogen (Genesee)       CO2        CCS / EOR
                                                   CO2 Transport       Utilization

       Genesee
                                                    CCS / EOR

Hydrogen (electrolysis)          Genesee
                                                                                      30
Genesee Carbon Conversion Centre
World’s largest carbon nanotube production facility

                                                      Stronger
                                                      cement

                                                      Enhanced
                                                      battery
                                                      products

                                                      More
                                                      durable
                                                      tires

                                                      Tougher
                                                      anti-corrosion
                                                      products

                                                                  31
Accelerating ESG initiatives
   Environmental                                                             Social                                   Governance

• Net carbon neutral before 2050                                          • Optimal workplace of the future to     • 25% of Executive short-term incentive
• Genesee repowering                                                        reflect key learnings and benefits       pay linked to meeting ESG targets
                                                                            from COVID-19                          • 44% of Board and 43% of Executive
• Renewables development
                                                                          • Increased community investment           female versus 30% target
• Natural gas with carbon                                                   funding in 2021; building off robust
  conversion and/or hydrogen                                                                                       • Executive short-term incentive linked
                                                                            and generous response to                 to presentation of diverse candidates
• A- CDP climate change score                                               COVID-19 relief efforts                  for corporate and plant positions
                                                                          • Indigenous training, employment        • 2021 review to identify and minimize
 Sustainable sourcing roadmap                                              and economic opportunities at            institutional bias in policies,
  on track to roll out in 2021                                              Canadian wind facilities through         procedures and results
                                                                            new Vestas agreement
 Water strategy on track to roll                                                                                  • World’s Most Ethical Companies(1)
  out in 2021                                                             • Transitional support for employees       award 3 years running – 1 of 4
                                                                            at Roxboro, Southport, Genesee           Canadian companies and 1 of 9
                                                                          • Committed to Equal by 30 –               energy and utilities companies
                                                                            supporting gender equity in our          worldwide
                                                                            industry
1) Named one of the 2021 World’s Most Ethical Companies by Ethisphere on February 23, 2021.
                                                                                                                                                       32
Release of our 2020 Integrated Annual Report
Key highlights
• Capital Power’s resilience in the face of COVID-19
  pandemic
• Acceleration of our path to a lower carbon future and net
  carbon neutrality with Genesee 1&2 repowering and
  transition off coal in 2023
• Seven new renewable projects, including five solar
  projects demonstrating our competitiveness in solar
  development
• Progress towards our ESG goals, including meeting our
  gender diversity goals on the Executive and Board
• Ongoing commitment to innovation, demonstrated by
  increased investment in C2CNT, progress on Genesee
  Carbon Conversion Center project, and Ops 2030
  initiatives

                                                              33
Getting to net carbon neutral: our sustainability targets
We have a clear roadmap to guide us to our goal of being net carbon neutral by 2050
 • Achieve net carbon neutrality by 2050
 • Construct all new natural gas generation units to be carbon capture and/or hydrogen-ready
 • Reducing Scope 1 CO2 emissions at Genesee by 50% by 2030 from 2005 levels
 • Reducing Scope 1 CO2 emissions by 10% by 2030 from 2005 levels, based on our 2019 fleet(1)
 • Reducing Scope 1 CO2 emission intensity by 65% by 2030 from 2005 levels(1)
 • Invest in carbon capture and utilization technology to help us achieve net carbon neutrality
   before 2050 and eventually physically decarbonize our natural gas fleet (ongoing)
 • Complete the Genesee Carbon Conversion Centre in the first half of 2022
 • Enhanced sustainable sourcing plan (2021)
 • Enhanced water management plan (2021)
 • Target at least 30% women on the Board and Executive Team

1) Our policy is to recalculate our base year emissions for any significant impacts as a result of changes in calculation methodologies and major acquisitions or divestments.
                                                                                                                                                                                 34
Attractive investment opportunity
Resilient strategy drives growth and accelerates net carbon
neutral before 2050
Success in renewables from innovation and optimization                  We create value
 • Recent success in solar more than doubles our growth opportunities   through resiliency,
 • Long-term contracts for North Carolina solar and Strathmore Solar    optimization
   projects affirm competitiveness                                      and innovation
Genesee repowering capitalizes on strong Alberta market and
in-house innovation
 • Most efficient natural gas combined cycle facility in Canada
 • Significantly reduced carbon footprint and risk
 • Carbon conversion ready and hydrogen achievable
Operational excellence and innovation remain fundamental
 • $50 million EBITDA from Ops 2030 program
 • Genesee Carbon Conversion Centre
 • Storage and hydrogen investigation

                                                                                         35
Appendices
• Ops 2030 program
• Alberta portfolio optimization
• Credit rating metrics
• Debt maturity schedule

                                   36
Ops 2030 generates $50M in annual EBITDA by 2030
 Creating the sustainable plant of the future through technology and innovation

Continuous              Data Analytics          Automation               Digital Tools        Flexible and
Improvement             • Deployment of         • Mobility in operator   • 3D printing &      Remote Operation
• Wind turbine            historian with          rounds                   scanning           • Simple cycle
  upgrades                enhanced              • Worker protection      • Acoustic leak        remote capability
• Start-up                capabilities            system automation        detection          • Renewables
  optimization          • Advanced pattern      • Power BI for           • Expanded use of      monitoring and
  software                recognition             reporting                drones &             diagnostics centre
                                                                           development of
• Fleetwide             • Implement                                                           • Remote digital
                                                                           internal program
  Distributed Control     machine                                                               worker
                                                                           and expertise
  System upgrades         learning technology
                                                                         • Continuous
• Energy storage          to enhance system
                                                                           monitoring of
                          security
                                                                           generator health
                        • Optimizing plant                               • Remote borescope
                          performance                                      capability
                                                                           deployment

                                                                                                                 37
Maximizing the Alberta commodity portfolio
Creating incremental value and stability through market expertise
                                                 Average realized power prices(1) have exceeded spot power prices
                                                       by 21% since the Company’s inception 11 years ago
   $125

   $100

     $75

     $50

     $25

       $0

                                                              Average AB spot power price                                            Capital Power captured AB price

1) Based on the Alberta baseload plants and the acquired Sundance PPA plus the uncontracted portion of Shepard Energy Centre baseload. Effective Mar/16, Sundance PPA is no longer a part of Capital Power’s baseload
   generation due to termination of the Sundance PPA.
                                                                                                                                                                                                                        38
Financial stability and strength
Strong balance sheet and commitment to investment grade credit ratings

                                                                           S&P financial metrics
  Agency                    Ratings                    Outlook
                                                                                 Adj. FFO/Debt(1-3)                Adj. Debt/EBITDA(1-3)
                                                                           20%                              5.0
    S&P                    BBB- / P-3                   Stable
                                                                           15%                              4.0
   DBRS            BBB(low) / Pfd-3 (low)               Stable                                              3.0
                                                                           10%
                                                                                                            2.0
                                                                           5%
                                                                                                            1.0
• Both credit rating agencies affirmed
                                                                           0%                               0.0
  our investment grade credit ratings                                              2020T          2021F                2020T           2021F
  and stable outlook
• Strong liquidity from cash flow from                                     DBRS financial metrics
  operations and $1B of committed
                                                                           30%   Adj. Cash flow/Debt(1,3)             Adj. EBITDA/Interest(1,3)
  credit facilities to 2024                                                                                 10.0
                                                                           25%
• Forecast metrics are within rating                                       20%                               8.0
  agency expectations for the current                                      15%                               6.0
  ratings with stable outlook                                              10%                               4.0

                                                                           5%                                2.0

                                                                           0%                                0.0
 1) Cash flow and adjusted EBITDA amounts include off-coal compensation.           2020T          2021F                 2020T           2021F
 2) Based on S&P’s weighted average ratings methodology.
 3) 2020T means 2020 target. 2021F means 2021 forecast.
                                                                                                                                                  39
Debt maturity profile(1)
Well spread-out debt maturities supported by long asset lives
• Longer term debt reflects increased confidence in Capital Power’s business profile
• Strong liquidity from cash flow from operations and ~$800M(1) available capacity on $1.0B of
  committed credit facilities that mature in 2024

       600

       500                                                                                    USD 65

       400
                                                                                                $160
($M)
       300

                                                                $450
       200
                                                                                                                                                                             $350
                                                                                                $300
                                                                                                                                                               $275
              USD 230                                                                                                                          $210
       100

                                                                                                                                                                      $65                  $50
         0
                2021            2022            2023            2024            2025            2026            2027            2028           2029            2030   2031   2032   2033   2034

                                                                             Capital Markets         CAD Private Placement             USD Private Placement

1) Debt amounts as of December 31, 2020. Schedule excludes non-recourse debt, credit facility debt, and tax-equity financing.
                                                                                                                                                                                              40
Non-GAAP financial measures
The Company uses (i) earnings before net finance expense, income tax expense, depreciation and
amortization, impairments, foreign exchange gains or losses, finance expense and depreciation
expense from its joint venture interests, gains or losses on disposals and unrealized changes in fair
value of commodity derivatives and emission credits (adjusted EBITDA), (ii) adjusted funds from
operations, (iii) adjusted funds from operations per share, (iv) normalized earnings attributable to
common shareholders, and (v) normalized earnings per share as financial performance measures.

These terms are not defined financial measures according to GAAP and do not have standardized
meanings prescribed by GAAP and, therefore, are unlikely to be comparable to similar measures used
by other enterprises. These measures should not be considered alternatives to net income, net income
attributable to shareholders of the Company, net cash flows from operating activities or other measures
of financial performance calculated in accordance with GAAP. Rather, these measures are provided to
complement GAAP measures in the analysis of the Company’s results of operations from
management’s perspective.

Reconciliations of these non-GAAP financial measures are disclosed in the Company’s Integrated
Annual Report prepared as of February 18, 2021 for 2020, which is available under the Company’s
profile on SEDAR at SEDAR.com and on the Company’s website at capitalpower.com.

                                                                                                          41
Forward-looking information
Forward-looking information or statements included in this presentation are provided to inform the Company’s                         the impacts of market designs in our core markets;
shareholders and potential investors about management’s assessment of Capital Power’s future plans and operations.                   settling our 2020 emissions compliance obligation through payments into the TIER fund;
This information may not be appropriate for other purposes. The forward-looking information in this presentation is                  matters related to the LLR Proceeding including timing of payments to the AESO and recovery from appropriate
generally identified by words such as will, anticipate, believe, plan, intend, target, and expect or similar words that suggest       parties and potential impacts to the Company arising from the foregoing; and
future outcomes.                                                                                                                     the impact of climate change, the COVID-19 pandemic and the decline in oil prices.
Material forward-looking information in this presentation includes expectations regarding:                                        These statements are based on certain assumptions and analyses made by the Company considering its experience
 our priorities and long term-strategies, including our corporate, sustainability, renewables and digitalization strategies;     and perception of historical and future trends, current conditions, expected future developments, and other factors it
 our company-wide targets specific to climate-related performance, including reduction of emissions and emissions                believes are appropriate including its review of purchased businesses and assets. The material factors and
   intensity and being net carbon neutral by 2050, repowering of Genesee 1 and 2, completion of the Genesee Carbon                assumptions used to develop these forward-looking statements relate to:
   Conversion Centre and commercial application of carbon conversion technologies;                                                 electricity, other energy and carbon prices;
 the implementation of Ops 2030, including its expected impact on adjusted EBITDA;                                                performance;
 our efforts to create a more equitable workplace and our goals for diversity of our workforce;                                   business prospects (including potential re-contracting of facilities) and opportunities including expected growth
 our goals for long-term Total Shareholder Return, annual capital growth and future dividend growth;                                 and capital projects;
 our plans to discontinue operations of our Southport and Roxboro facilities in 2021;                                             status of and impact of policy, legislation and regulations;
 our 2021 performance targets, including for facility availability, sustaining capital expenditures, AFFO and adjusted            effective tax rates;
   EBITDA;                                                                                                                         the development and performance of technology;
 our plans to add approximately 425 MW of renewables generation to our fleet by the end of 2022;                                  foreign exchange rates;
 our plans to reduce our emissions using clean energy technologies, such as carbon capture, utilization and storage               matters relating to the LLR Proceeding, including the timing of payments to the AESO and recovery from
   technologies, including our investment in C2CNT, the anticipated production of carbon nanotubes, and resulting                     appropriate parties; and
   downstream benefits;                                                                                                            other matters discussed under the Our Strategy section pertaining to Performance Targets for 2021.
 our plans to commence commercial production of carbon nanotubes at the Genesee Carbon Conversion Centre;
                                                                                                                                  Whether actual results, performance or achievements will conform to the Company’s expectations and predictions is
 expectations around timing and costs associated with our upgrades and repowering plans at our Genesee facility,
                                                                                                                                  subject to several known and unknown risks and uncertainties which could cause actual results and experience to
   including being off coal in 2023;
                                                                                                                                  differ materially from the Company’s expectations. Such material risks and uncertainties include:
 future revenues, expenses, earnings, adjusted EBITDA and AFFO;
                                                                                                                                   changes in electricity, natural gas and carbon prices in markets in which the Company operates and the use of
 the future pricing of electricity and market fundamentals in existing and target markets;
                                                                                                                                       derivatives;
 future dividend growth;
                                                                                                                                   regulatory and political environments including changes to environmental, climate, financial reporting, market
 our future cash requirements including interest and principal repayments, capital expenditures, dividends and
                                                                                                                                       structure and tax legislation;
   distributions;
                                                                                                                                   generation facility availability, wind capacity factor and performance including maintenance expenditures;
 the 2021 dividend reinvestment plan participation rate;
                                                                                                                                   ability to fund current and future capital and working capital needs;
 our sources of funding, adequacy and availability of committed bank credit facilities and future borrowings;
                                                                                                                                   acquisitions and developments including timing and costs of regulatory approvals and construction;
 future growth and emerging opportunities in our target markets including the focus on certain technologies and
                                                                                                                                   changes in the availability of fuel;
   expectations around future generation portfolio composition;
                                                                                                                                   ability to realize the anticipated benefits of acquisitions;
 the timing, funding, costs of and financial impacts (including impacts to adjusted EBITDA and AFFO) related to
                                                                                                                                   limitations inherent in the Company’s review of acquired assets;
   existing, planned and potential development projects and acquisitions (including the repowering of Genesee 1 and 2
                                                                                                                                   changes in general economic and competitive conditions;
   (including being hydrogen ready), phases 2 and 3 of Whitla Wind, Buckthorn Wind, Cardinal Point Wind, Strathmore
                                                                                                                                   changes in the performance and cost of technologies and the development of new technologies, new energy
   Solar, Bear Branch Solar, Hornet Solar, Hunter’s Cove Solar and Enchant Solar);
                                                                                                                                       efficient products, services and programs; and
 facility availability and planned outages;
                                                                                                                                   risks and uncertainties discussed under the Risks and Risk Management section in the Integrated Annual Report.
 capital expenditures for facility maintenance and other (sustaining capital, future growth projects, commercial
   initiatives);                                                                                                                  See Risks and Risk Management in the Business Report section within the Company’s December 31, 2020
 the likelihood of meeting the threshold and paying out contingent consideration related to Buckthorn Wind;                      Integrated Annual Report for further discussion of these and other risks. Readers are cautioned not to place undue
 the timing of the Buckthorn Wind tax equity investor reaching the agreed upon target rate of return;                            reliance on any such forward-looking statements, which speak only as of the date made. The Company does not
 the timing of completion of the Decatur Energy combustion turbine upgrades and impacts of the Decatur Energy                    undertake or accept any obligation or undertaking to release publicly any updates or revisions to any forward-looking
   tolling agreement extension on adjusted EBITDA;                                                                                statements to reflect any change in the Company’s expectations or any change in events, conditions or
 impacts of the Vestas LTSA extensions, including cost reductions, impacts on adjusted EBITDA and AFFO in the                    circumstances on which any such statement is based, except as required by law.
   years the executed agreements become effective;
 discussion of our risks and strategies and plans for risk management and mitigation;                                                                                                                                                         42
Q1/20 Analyst Conference Call

                                                     [Insert picture of Cardinal Point or
                                                     Buckthorn for title page; other visual
                                                     images in presentation to be added]

Investor Relations
Randy Mah                      10423 101 Street NW
Director, Investor Relations   11th Floor
(780) 392-5305                 Edmonton, Alberta
rmah@capitalpower.com          Canada T5H 0E9
                                                                                              43
You can also read