Bone Conduction Transducers - Market Update - Outline
←
→
Page content transcription
If your browser does not render page correctly, please read the page content below

INNOVATIONS IN AUDIO • AUDIO ELECTRONICS • THE BEST IN DIY AUDIO
                                                           www.audioxpress.com

    Market Update
    Bone Conduction Transducers
    By Mike Klasco and J. Martins

    Practical Test & Measurement
    The Benefits of Using
    Structure-Borne Sound
    in Headset Signal Processing
    By Hans W. Gierlich

    R&D Stories
    The Science Behind
    the Taction Transporter
    By Silmon J. Biggs and John Steinberg

    Simulation Techniques
    Loudspeaker Driver
    Displacement Decomposition
    By René Christensen

                                            R&D Stories
                                            The Audio Foundry Automotive
                                            Audio Development Platform
                                            By Adam Levenson

                                            Market Perspective
                                            OTC Hearing Aids: Is Innovation
                                            Leaving the Rule Behind?
                                            By Andrew Bellavia
JANUARY 2023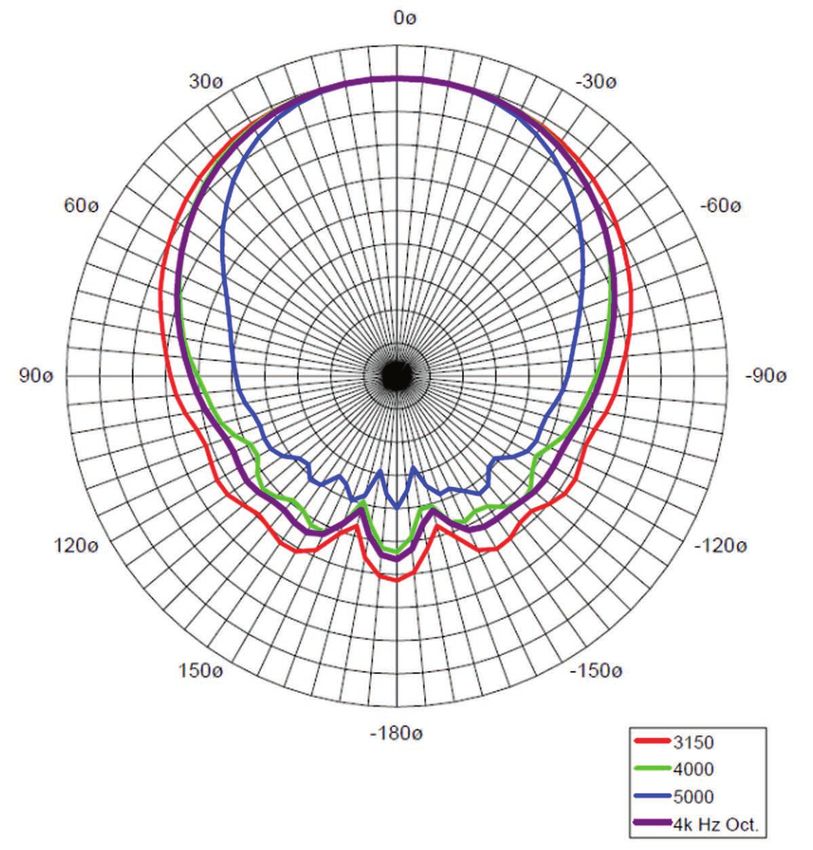
ax           Sound Control

Acoustical Test Sources
  By
  Richard Honeycutt

The choice of a sound source for acoustical testing and reporting is decisive and should be
determined according to the applications. Let’s explore the characteristics and benefits of
available sources for acoustical measurements.

    Acoustical testing can be classified according to the test                sound field as a balloon whose shape and coloration represent the
setup: Response testing involves a sound-level meter (SLM) and/               sound pressure level (SPL) radiated in each direction.
or a real-time analyzer (RTA) to measure the sound level and/                      The third way is a section drawing with a vertical or horizontal
or spectrum produced by a source. Stimulus-response testing                   cut through the balloon. Such sections often show multiple lines,
incorporates an acoustical source whose sound output is known,                illustrating the variation in directivity with frequency.
and measurements of the resulting sound field are made in order
to determine how a room or other enclosure affects the sound.                 Source Directivity
Sound-system performance, reverberation, and echo testing                         Figure 1 shows the circular plot characterizing horizontal and
exemplify this type of test.                                                  vertical directivity of an omnidirectional source. Of course, the
    The second type of testing requires a source with a certain               balloon plot would be a perfect sphere. Figures 2–5 show the
directivity (polar response) and frequency response.
The directivity of an acoustical source depends upon
its physical characteristics and size.
    A source that is small compared to the
wavelength of the sound being investigated is called
a point source and is omnidirectional. Directivity can
be represented in any of several ways.
    One way is a simple graph of the beamwidth
plotted versus frequency. The directivity graph of
an omnidirectional source would be very boring: a
horizontal line showing a beamwidth of 360° at all
frequencies. Another way is to represent the radiated

                             0º

                              –5dB

                              –10dB

                              –15dB

                              –20dB

                              –25dB

 270º                                                  90º

                            180º
                                                              Figure 2: The horizontal (upper) and the vertical (lower) directivity of the human voice
                                                              vary with frequency; the standard deviation is indicated by the colored shading. (Image
Figure 1: The horizontal and the vertical directivity of an   Source: Christoph Pörschmann, Johannes M. Arend: “Analyzing the Directivity Patterns of
omnidirectional source are perfect circles.                   Human Speakers,” www.researchgate.net/publication/343344151)

34 | January 2023 | audioxpress.com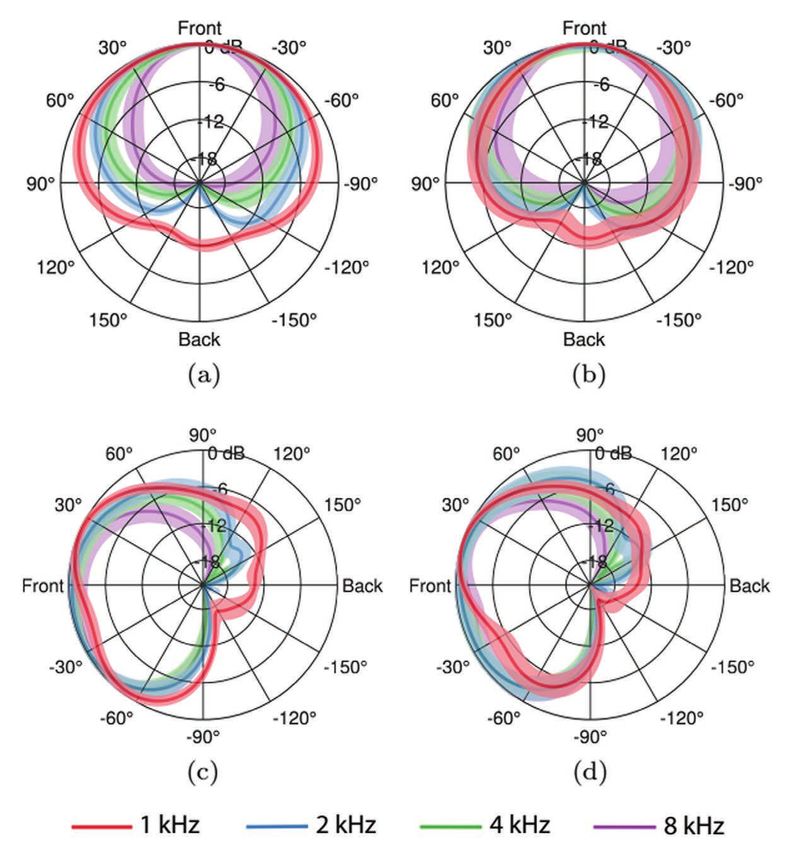
directivities of other common sources. For most of For line arrays, the horizontal directivity is
these sources, at lower frequencies, the directivity typically more-or-less constant at 120° to 150° with
would be less (the “watermelon” shape of the balloon some narrowing at the highest frequencies, and the
smaller in diameter); at higher frequencies, greater. vertical directivity varies from omnidirectional at the
lowest frequencies to some essentially constant value
(often 10° to 30°) from the lower critical directivity
frequency—at which the array height is about ¼
wavelength—to the upper frequency response limit.
For stimulus-response testing of an installed
sound system used for reinforcement of speech
or singing, a speaker having a reasonably flat
frequency response and a polar response similar to
that of the human voice can be used. The advantage
of feeding a vocal mic using a speaker, rather than
simply feeding pink noise to the system is twofold:
• The acoustical characteristics—frequency
response and directivity— of the vocal mic,
which affect the gain-before-feedback, are
included in the test.
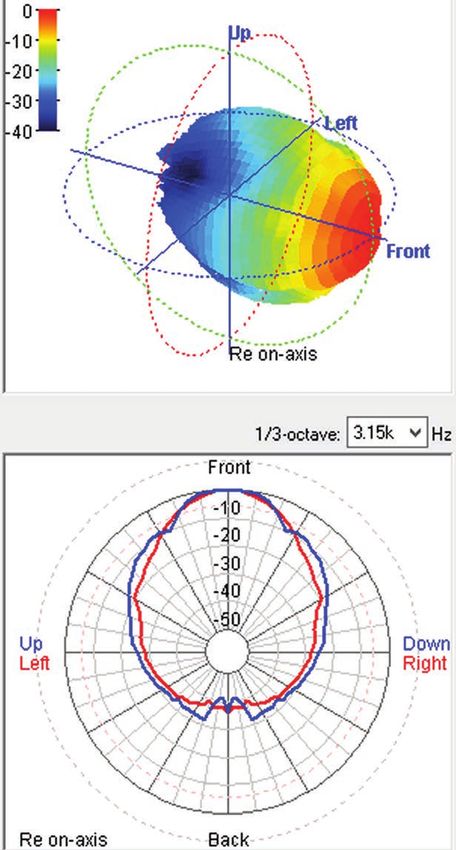
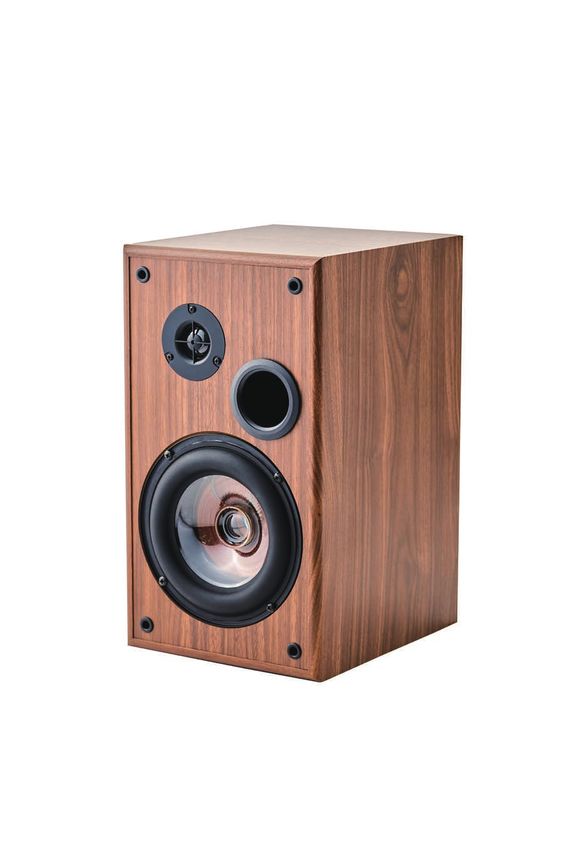
Figure 3: the directivity balloon of an enclosed two-way
8” cone speaker at 3.15kHz shows strong beaming.
• The acoustical environment—stage-monitor
leakage and reflections from a lectern table or
music stand—are included.
Figure 5: The directivity
model of a line array
speaker at 3.15kHz is shown
by the balloon (upper)
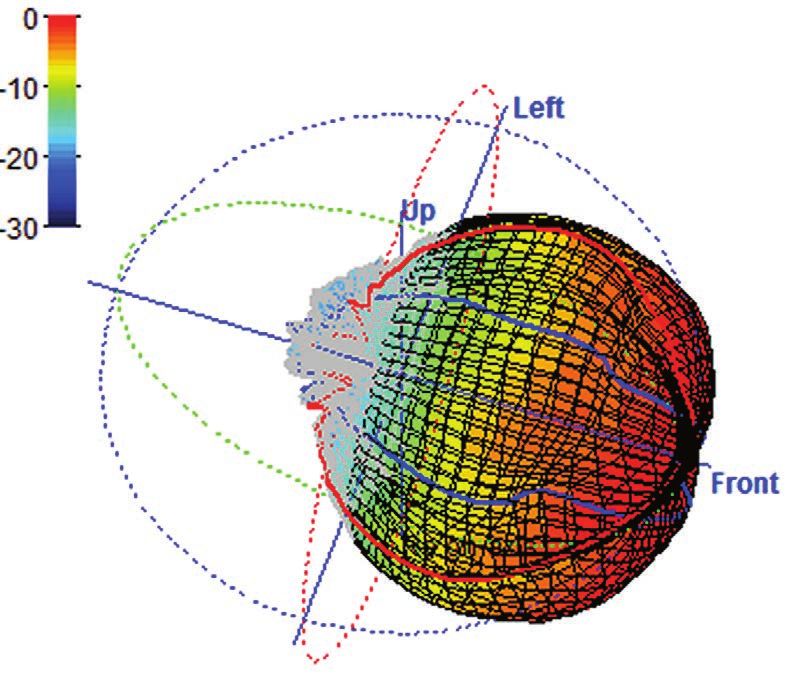
Figure 4: The directivity of a 50-degree horn speaker at and the vertical and the
3.15kHz is shown by the balloon (upper) and the vertical horizontal balloon sections
and the horizontal balloon sections (below). (below).
audioxpress.com | January 2023 | 35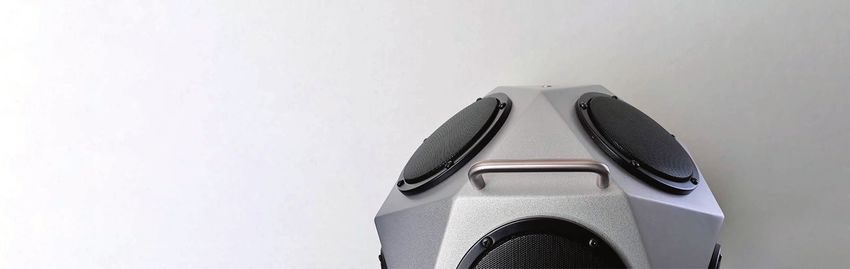
ax           Sound Control

                                                                                                                   Photo 3: The NTi Talkbox is a high-
                                                                                                                   SPL test source with flat frequency
Photo 1: The B7K mouth simulator can be used to                                                                    response that simulates the human
simulate a human-mouth acoustical source.                                                                          voice directivity.

                                                               Photo 2: Another source that simulates a human
                                                               mouth is the B&K Head-and-Torso Simulator (HATS).

                                                                                             Two excellent examples of a test source that can be
                                                                                         used in this fashion are the Brüel & Kjaer (B&K) mouth
                                                                                         simulator (Photo 1) and the Head-and-Torso Simulator
                                                                                         (HATS) (Photo 2). The HATS provides more accurate
                                                                                         directivity compared to a human head. The NTi TalkBox
                                                                                         is a less expensive option (Photo 3). The polar directivity
                                                                                         plots are shown in Figure 6.
                                                                                             For measuring reverberation time (RT ), an
                                                                                         omnidirectional source should be used because the concept
                                                                                         of RT as developed by Wallace Sabine assumes perfect
                                                                                         diffusion of direct and reflected sound in the room being
                                                                                         tested. No real point-source speaker small enough to be
                                                                                         omnidirectional in all octaves would be able to produce
                                                                                         a high enough SPL to overcome the background noise.
                                                                                             The most common RT measurement is RT30, which is
                                                                                         twice the time required for sound to decay by 30dB. For
                                                                                         accurate measurements, the background noise must be
                                                                                         at least 30dB—preferably 40dB or more—below the test
                                                                                         signal, if pink noise is used, as is usually done. (Swept-
                                                                                         sine measurements can take advantage of synchronous
                                                                                         averaging to cancel out some of the background noise,
                                                                                         but not many swept-sine RT analyzers are available.)
                                                                                             This means that test signal levels ranging from 60dBZ
                                                                                         to 90dBZ (flat weighting) may be required, depending
                                                                                         upon the room noise level. In order to achieve these signal
                                                                                         levels, test speakers using multiple drivers are employed.
                                                                                         To provide uniform radiation in all directions, 12 identical
                                                                                         speakers are often used, mounted in a dodecahedral
Figure 6: The directivity of the Talkbox in the critical 1kHz to 4kHz octave bands is    configuration. The drivers are fed an equalized pink noise
close to that of the human voice.                                                        signal. The resulting frequency response is not truly flat

36 | January 2023 | audioxpress.com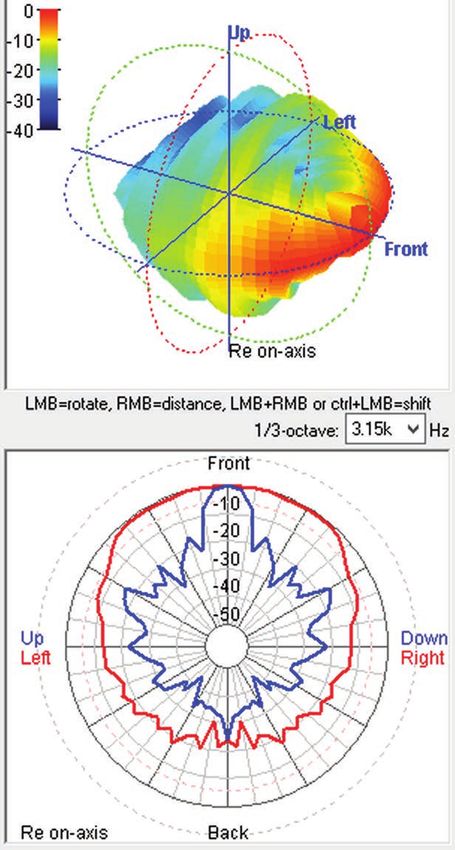
in terms of energy per Hertz, but it can be made flat in terms of      be very important. Such a room would have equally absorptive
energy per octave. As sound guru Pat Brown has said, “the object       finishes on all surfaces, and no shapes that could cause focusing or
here is to excite the room, not to sound good.”                        block sound from certain areas. Most real rooms have one or more
                                                                       characteristics that prevent the dispersion from being uniform:
Onmi Sources
    Several well-known manufacturers of acoustical test equipment      • Ceilings that are more absorptive than the other room
make excellent dodecahedral test speaker (“dodecs”). Examples            boundaries (e.g., acoustical tile ceilings in classrooms and
are the NTi DS3 and the B&K Model 4292L, both of which provide           conference rooms
omnidirectional sound at levels somewhat above 120dB. The
Italian company Outline has recently introduced the Global Source
Radiator (GSR) with a companion radio-remote-controlled white/
pink noise generator, 1kW digital amplifier, and other measurement
accessories (Photo 4).
    Commercially available dodecs typically range in diameter
from 31cm to 39cm, and weigh from 8kg to 11kg. Most of them
are truly dodecahedral in form. The Outline GSR is unique in
that it is spherical, reducing diffraction and edge reflections that
could cause response irregularities. Good commercial dodecs are
expensive, so many audio amateurs and a few audio pros have
decided to build their own. A DIY dodec article written by Pat Brown
is available online (see Resources).

The Importance of Omnidirectionality
   For RT measurements in a room with perfectly uniform                Photo 4: The Outline HSR dodec and its companion amplifier provide
dispersion of sound, using an omnidirectional source would not         omnidirectional radiation at over 130dBSPL.

                                                                                                           audioxpress.com | January 2023 | 37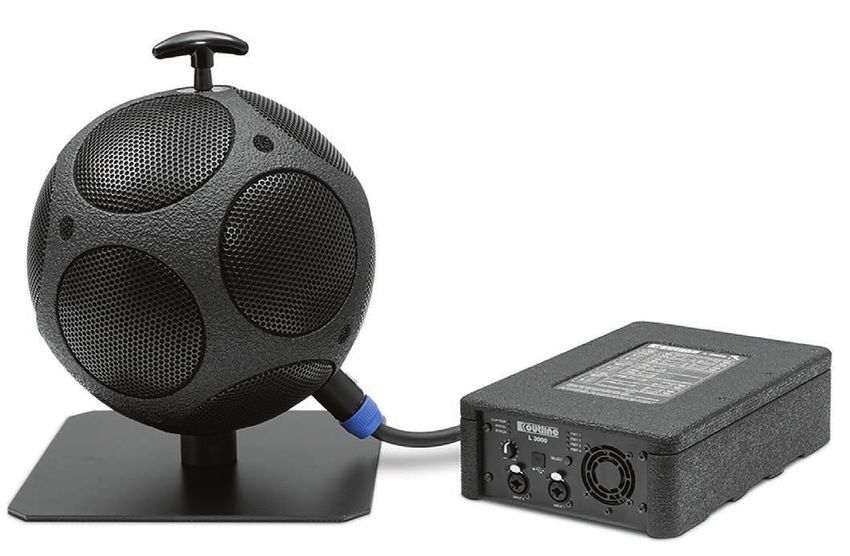
You can also read