Blue Sphere Corporation - Corporate Overview September 2018 Shlomi Palas Chief Executive Officer
←
→
Page content transcription
If your browser does not render page correctly, please read the page content below
Blue Sphere Corporation   Corporate Overview

                          September 2018

                          Shlomi Palas
Waste-to-Energy IPP       Chief Executive Officer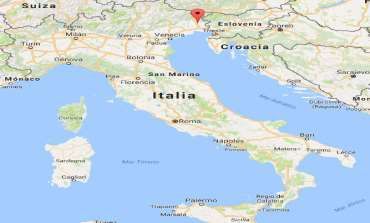
Safe Harbor

This Confidential Corporate Presentation (this “Corporate Overview”) has been prepared by Blue Sphere Corporation (“Blue Sphere” or the “Company”) solely for informational purposes. This
Corporate Overview does not constitute an offer to sell or a solicitation of an offer to buy securities or assets of Blue Sphere. All information presented in this Corporate Overview with respect
to the existing business and the historical operating results of Blue Sphere and estimates and projections as to future operations are based on materials prepared by the management of Blue
Sphere and involve significant elements of subjective judgment and analysis which may or may not be correct. While the information provided herein is believed to be accurate and reliable,
Blue Sphere makes no representations or warranties, expressed or implied, as to the accuracy or completeness of such information. In furnishing this Corporate Overview, Blue Sphere reserves
the right to amend or replace the Corporate Overview at any time and undertakes no obligation to provide the recipient with access to any additional information. Nothing contained within this
Corporate Overview is or should be relied upon as a promise or representation as to the future.

This presentation contains forward-looking statements and such statements are subject to risks and uncertainties and may change at any time. You can identify forward-looking statements by
terms such as “may”, “will”, “should”, “expect”, “plan”, “project”, “anticipate”, “could”, “intends”, “targets”, “contemplates”, “believes”, “potential”, “continue”, “predict” or negatives of these
terms or other similar expressions. These statements are only predictions and involve known and unknown risks, uncertainties and other factors, including the risk factors discussed in more
detail in the Company’s filings with the U.S. Securities and Exchange Commission and without limitation, (i) uncertainties regarding the Company’s ability to obtain adequate financing on a
timely basis including financing for specific projects, (ii) the financial and operating performance of the Company’s projects after commissioning, (iii) uncertainties regarding the market for and
value of carbon credits and other environmental attributes, (iv) political and governmental risks associated with the countries in which the Company operates, (v) unanticipated delays
associated with project implementation including designing, constructing and equipping projects, as well as delays in obtaining required government permits and approvals, (vi) the
development stage of the Company’s business, (vii) the Company’s lack of operating history and (viii) such other risks, uncertainties and factors described in the Company’s public filings with the
Securities and Exchange Commission. As such, there is no assurance that the initiatives described in the presentation will be successfully implemented or meet expectations and the Company’s
actual results and financial condition may differ materially from those indicated in the forward-looking statements.

Any forward-looking statement made by the Company in this presentation is based only on information currently available to the Company and speaks only as of the date on which it is made.
Except as required by law the Company undertakes no obligation to publicly update any forward-looking statement, whether written or oral, that may be made from time to time, whether as a
result of new information, future developments or otherwise. The Company’s Annual Report on Form 10-K for the fiscal year ending December 31, 2017 and the Company’s Quarterly Reports
on Form 10-Q and other reports are available upon request or by going to www.sec.gov.

1
About Blue Sphere
Developer and Operator of Clean Tech Energy Assets:
Blue Sphere Corporation is a global Independent Power Producer (IPP) operating Renewable Clean Energy
Facilities in the Waste-to-Energy and Biogas Markets.
Team of 14 experienced executive in Project Development, Technology & Engineering,
Project Finance, Crisis Management and Project Operations.
Waste-to-Energy technology is used to convert organic and non-organic waste generated
from various domestic, commercial, industrial and agricultural uses into energy and energy
sources. The energy or fuel is delivered directly to electricity or natural gas grids.
Blue Sphere can deploy various technologies such as Anaerobic Digestion or
Gasification to process waste. Each technology has a different course of action to turn
waste into electricity, natural gas, heat and compost. Blue Sphere is Technology
Agnostic.
Business model includes “Greenfield” development of new facilities and the Acquisition of
existing facilities.
2
Company Highlights
Building Quality Asset Portfolio
Have Raised Over $110,000,000 in Acquisition and Project Financings
Completed the Development of Three Large-Scale facilities.
Completed the Acquisition of Five Operating Bio-Gas Plants
We Increased Capacity at our acquired Bio-Gas Plants from in some cases 20% to Nearly
95%. We acquired four facilities in 2015 and one facility in 2017.
Have a Definitive Agreement in Place to Acquire an Additional Bio-Gas Plant
Awarded a $178,000,000 Grant for our Flagship Project in Holland
Signed €55M Offtake Agreement with Large Energy Company for our Holland Project
Built Key Infrastructure Including Management Team and Outside Providers
Have Developed Large Pipeline of Acquisition Opportunities and Development
Projects Representing over $800,000,000.
3Management Team
Shlomo Palas – Chief Executive Officer and Director –Mr. Palas is a highly Yosef Keret – Chief Financial Officer – Previously, Mr. Keret served as the Chief Executive Officer
experienced entrepreneur who has held executive positions at a number of leading and Managing Director of Weebit-Nano Ltd. (ASX:WBT) and has served as the Chief Financial Officer
Israeli firms. Since 2010, Mr. Palas has specialized in the renewable and clean tech of numerous public and private companies, including Eric Cohen Books Ltd. & Burlington English Ltd.,
industries. He has gained significant experience in renewable and clean tech Daimler Financial Services Israel Ltd., Pluristem Life Systems Inc. (NASDAQ:PST), M.L.L Software and
manufacturing, off-take contracts with leading petrol companies, legal/financial Computers Industries Ltd. (TASE:MLL), and Top Image Systems Ltd. (NASDAQ:TISA). Mr. Keret
structuring, and fundraising for these industries. Mr. Palas previously served as commenced his career at Kost Forer Gabbay & Kasierer, registered public accounting firm, a member
Chief Executive Officer of Becco Biofuels China Ltd., which was a company active in firm of Ernst & Young International. Mr. Keret has served on the Board of Directors of Wize Pharma
the biofuel industry. Mr. Palas participated in the establishment of the largest Inc. since November 2017 and on the Board of Directors of Weebit-Nano Ltd. Mr. Keret holds a B.A.
commercial algae farm in China together with one of China’s largest electrical from Haifa University in Economics and Accounting and is a Certified Public Accountant in Israel.
utilities. Mr. Palas holds a B.A. in Statistics and Management from Haifa University
and an M.S. from Baruch College. Dr. Elad Kerner – Executive Vice President – Dr. Kerner has a Ph.D. in law from Bar-Ilan University
and brings wealth of knowledge in economics, finance and management. Dr. Kerner is an expert in
Roy Amitzur – Executive Vice President – Previously Mr. Amitzur served as commercial transactions, international investment, mergers & acquisitions, corporate finance and
President of Clean Technologies Group Ltd, a holding and integration company corporate governance. Before joining Blue Sphere, Dr. Kerner was General Counsel for Israel
specializing in investment in water technologies and water and waste water project Aerospace Industries, Ltd, was the Chief Executive Officer of Toptrio Group and was a Partner in the
execution. In addition, Mr. Amitzur has previously managed a number of start-up law firm of Shugol, Ketzef, Ehrlich, Kerner & Co. Dr. Kerner was a Lieutenant Colonel and Military
companies, including Bio Pure Technology Ltd., Proxy Aviation Systems, Inc., and Judge in the Israeli Defense Forces.
Aquarius Technologies Inc. Mr. Amitzur has significant experience in implementing
BOT and turn-key projects in water technologies and water and waste water Dr. Efim Monosov – Chief Technological Officer - Dr. Monosov has over 28 years experience in
execution around the world. environmental engineering, technology development and project management. Dr. Monosov
founded Elif technology Ltd. in 1994 and managed the company as CTO and CEO. In 2006 the
company was sold to Aquarius Technologies Inc. where Dr. Monosov continued on as Vice President
& CTO until 2012. Dr. Monosov has a M.Sc. degree in Environmental Engineering (with honors) from
St. Petersburg State University of Architecture & Civil Engineering and a PhD in the same field from
St. Petersburg State Technological Institute. Dr. Monosov holds several US and international patents
related to environmental engineering and waste treatment technology.
4Waste-to-Energy Process
Waste Intake Treatment Processing End Use
5Waste-to-Energy Global Market Growth
*PROJECTED GLOBAL WASTE -TO-ENERGY
MARKET VALUE GROWTH
2 0 1 6 TO 2 0 2 6
(IN BILLIONS OF US $)
60
53.87
50.78
50 47.86
45.10
42.51
40.07
40 37.76
35.59
33.55
31.62
29.8
30
20
10
0
2016 2017 2018 2019 2020 2021 2022 2023 2024 2025 2026
*This statistic displays the waste-to-energy market worldwide in 2016 and 2017 with a projection for
2018 through 2026. According to a report by Inkwood Research the market is expected to reach
over 53.8 billion U.S. dollars in value by 2026. The global market is expected to grow at a
6
compound average growth rate of 6.1 % from 2016 to 2026. Source: Inkwood Research 2018Business & Strategy
Global Operator
Our goal is to become the dominate developer and operator Renewable Clean Energy Facilities in the Waste-to-
Energy and Biogas Markets. We are currently developing or operating facilities in the United States, Italy,
Holland, the United Kingdom, Canada, Israel and Greece.
How do we achieve our goals?
Greenfield Development: Build, Own and Operate
• Opportunistic Development (We “follow the waste”)
• Distressed Developer Opportunities*
• Partnerships Opportunities
• 20% minimum IRR Goal
Acquisitions
• Aggressively Acquire Assets with Free Cash Flows
• These are Operating Facilities (Connected to Grid)
• Many are Distressed Opportunities*
• 20% Minimum IRR Goal
* Many projects in the waste-to-energy industry were built for
ideological reason by non-professional developers. This has
created an opportunity for experienced developers and
7 operators to step in an acquire developments and operating
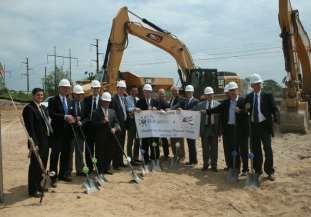
facilities at steep discounts.Development Phases
• Pre-Development. Evaluating project opportunities that • Construction Phase. Complete financial closing with project
come from various sources such as: other developers, finance partners, EPC and technology providers. Property is
utility companies, strategic partners and land owners. officially purchased or leased and a ground breaking occurs
Conducting site research, evaluating feedstock and site prep begins. Materials are ordered, equipment is
parameters, researching the availability for offtake ordered and construction begins. Depending on the size,
agreements and reviewing regulatory issues scale and type of technology, this phase could last between 9
surrounding a particular location. months and 20 months.
• Development Phase. Begin deploying capital and • Operating Phase. Begin the acceptance of waste materials.
committing to projects. Issuing term-sheets or letters of Ramp-up of biological elements in the case of an anaerobic
intent for the development of projects. Begin in-depth digester plant. Connect to the electrical and or gas grids or
due-diligence. Post due-diligence, amongst other connecting directly to a large end user. Once the connection
processes: technology is selected, an engineering study is in place and the waste ramp-up phase is complete, the
is completed, development plans are created, third party plant is now operational. In addition to other administrative
Engineering Procurement and Construction operators functions, management or our third party contractors will now
(EPC’s) are engaged, deposits are made on properties, begin to maintain feedstock intake, equipment monitoring and
environmental studies begin, permitting begins, maintenance.
feedstock agreements are put in place, power purchase
agreements (“PPA”) are agreed to and project financing
is sourced. The development phase can take one year
or longer depending on the project size and complexity.
8Multiple Corporate Revenues Sources
Development Fees: Build development fee into all financing packages.
Depending on the size of the development, these fees can range from
$100,000 to over $1,000,000.
Blue Sphere MSA Agreements: “Management Services Agreement”. Charge
SPV fixed payments for all services of overseeing asset.
Receives Cash
Flows Throughout
The Project Cycle SPV Pass Through Distribution: Cash flow for each project
consolidated at parent company.
Asset Disposition: Sell assets when prudent.
9Multiple Project Revenues Sources
Feed-In-Tariff are long-term contracts with major electrical and gas companies,
providing for a very reliable Predictive Revenue Source.
Primary Sources
Tipping Fees are levied upon a given quantity of waste received at our
facilities. These fees provide a revenue source from an essentially unlimited
resource. ..
Subsidies are government financial incentives such as: “REC’s” (Renewable
Energy Credits), Green Certificates, “RINS” (Incentives for Natural Gas) and various
Tax credit programs such as “ITC’s”.
Residual Heat generated in the energy recovery process can
be provided directly structures in close proximity to our waste-to-
energy facilities. Secondary Sources
Soil Amendments are residual digested solids can be used for
farming, residential and commercial applications in the form of a
high quality fertilizer compost.
10Development Phase Pipeline
Italy (Negotiating and/or conducting due-diligence)
• Agrilandia, Italy. Acquisition of Anaerobic Digester Plant, 1MW (electricity).
• Cantu, Italy. Acquisition of fully operating 1MW Clean Energy Plant.
• Ravena, Italy. Acquisition of Cogeneration Plant, 1MW (electricity).
• Riffle, Italy. Acquisition of two Anaerobic Digester Plants, 2MW (electricity).
• Marcallo, Italy. New Construction of Anaerobic Digester Plant, 19.7 MMBtu Biogas
(1.5MW equivalent) (electricity).
• Sardinia, Italy (Galileo). New Construction of four Anaerobic Digester Plants, each
12.7 MMBtu Biogas (combined 4MW equivalent) (electricity).
• Lazio, Italy. New Construction of Anaerobic Digester Plant, 19.7 MMBtu Biogas
(1.5MW equivalent) (electricity).
* We have entered into non-binding letters of intent related to ** The Company is negotiating or expects to negotiate, but has not yet entered into
these opportunities. We can provide no assurances that we will any non-binding letters of intent related to these opportunities. We can provide no
be successful in entering into definitive agreements to either assurances that we will be successful in entering into letters of intent related to these
acquire or construct these facilities. opportunities, and even if we do, such letters of intent would be non-binding, and we
11 can provide no assurances that we will be successful in entering into a definitive
agreement to either acquire or construct these facilities.Development Phase Pipeline
The United Kingdom (Negotiating and/or conducting due-diligence)
• Stoke-on-Trent, GB. New Construction of Gasification, 12MW electricity.
• Kirby, Liverpool, GB. New Construction of Gasification Plant, 12MW electricity.
• Avonmouth, Bristol, GB. New Construction of Gasification Plant, 12MW electricity.
Canada (Negotiating and/or conducting due-diligence)
• Alberta, Canada. New Construction of Anaerobic Digester, producing approximately 64.58
MMBtu / hour of biogas. 7.6MW equivalent.
* We have entered into non-binding letters of intent related to ** The Company is negotiating or expects to negotiate, but has not yet entered into
these opportunities. We can provide no assurances that we will any non-binding letters of intent related to these opportunities. We can provide no
be successful in entering into definitive agreements to either assurances that we will be successful in entering into letters of intent related to these
acquire or construct these facilities. opportunities, and even if we do, such letters of intent would be non-binding, and we
12 can provide no assurances that we will be successful in entering into a definitive
agreement to either acquire or construct these facilities.Development Phase Pipeline
Israel (Negotiating and/or conducting due-diligence)
• Rishon Lezion, IL. New Construction of a MRF (Materials Recycling Facility) + Anaerobic
Digester Plant, 2.5MW electricity.
United States (Negotiating and/or conducting due-diligence)
• Boise, Idaho, USA, New Construction of Anaerobic Digester producing approximately 62
MMBtu / hour biogas. 7.3MW equivalent.
* We have entered into non-binding letters of intent related to ** The Company is negotiating or expects to negotiate, but has not yet entered into
these opportunities. We can provide no assurances that we will any non-binding letters of intent related to these opportunities. We can provide no
be successful in entering into definitive agreements to either assurances that we will be successful in entering into letters of intent related to these
acquire or construct these facilities. opportunities, and even if we do, such letters of intent would be non-binding, and we
13 can provide no assurances that we will be successful in entering into a definitive
agreement to either acquire or construct these facilities.Investment Highlights
Long-Term Value
• Global trends towards renewable energy use.
• Company is technology agnostic – only using proven technologies.
• Management team with deep expertise in all required fields.
• Geographically diverse project locations.
• Working with industry leading partners.
• Long-term predictive revenue sources.
• Global landfill reductions, closures and restrictions.
• Company has Raised Over $110,000,000 in Acquisition and Project Financings
• Completed the Development of Three Large-Scale facilities.
• Completed the Acquisition of Five Operating Bio-Gas Plants
• Awarded a $178,000,000 Grant for our Flagship Project in Holland
• Built key infrastructure including Management Team and Outside Providers
• Company has a large pipeline of Acquisition Opportunities and Development
Projects representing over $800,000,000.
14Appendix
1. Brabant, Holland Development
2. Charlotte, North Carolina Project
3. Johnston, Rhode Island Project
4. Pavia, Italy Projects
5. Udine, Italy Projects
15Current Development Brabant, Holland
Project Overview: Expected Project Revenues (over 12 Years):
• Combined Energy Output: 3,000 Nm³/h • $266.5M (SDE + Green Certs + Offtake)
upgraded biogas (equivalent to
10MWe/h) Expected Annual Project Revenues:
• Technology Process: Anaerobic Digester • SDE $14.85M
• Feedstock: Organic Waste • Gas Offtake $5.37M
• Production Output: Natural Gas • Green Certificates $1.52M
• Carbon $0.469M
Milestones:
Approximate Total Annual Revenues: $22.2M
Permits in Place
$178,226,589 SDE+ Grant awarded to Project Funding:
Blue Sphere
• BNG Bank + ETFF + Green Fund (Completed)
$64,517,750 offtake agreement signed • Construction Cost: Approx.: $34M
with GasTerra B.V.
Construction Start Q3-2018 Blue Sphere Ownership: 67%
Equity Partner Ownership: 33%
** Assumes an exchange rate of $1.17 to €1.00.
16Completed Development: North Carolina USA
Project Overview: Expected Annual Project Revenues:
• Combined Energy Output: 5.2MW National Press Attention
• $10M
• Technology Process: Anaerobic Digester
• Feedstock: Organic Waste • $7M Project EBITDA*
- Feedstock Contracts in Place • PPA: Duke Energy (15 years)
• Production Output: Electricity & Compost
• Appx. $586K due to Blue Sphere upon
Milestones: mechanical completion
Began Development in June 2012
Began Construction in Q4 2014 Project Funding:
Completed Financial Closing in January 2015 • York Capital / Entropy
Completed Construction of Primary Structures in • Construction Cost: Approx. $27m
December 2015
Duke Energy Sub-Station Construction in July 2016
Blue Sphere Project Ownership:
“White Test” Diagnostics August 2016
“Test Waste” in Digesters and Producing Gas September
• 25%
2016
COD & Connected to Grid November 18, 2016
Mechanical Completion
* EBITDA is not generally recognized as a GAAP measurement.
17Completed Development: Rhode Island USA
Project Overview: Expected Annual Project Revenues:
• Combined Energy Output: 3.2MW
• $7.0M
• Technology Process: Anaerobic Digester
• Feedstock: Organic Waste • Expected $3.8M Project EBITDA*
- Feedstock Contracts in Place
• Production Output: Electricity & Compost • PPA: National Grid (15 years)
• Appx. $562K due to Blue Sphere upon
Milestones: mechanical completion.
Began Development in June 2012
Began Construction in Q4 2014 Project Funding:
Completed Financial Closing in April 2015 • York Capital / Entropy
Completed Construction of Primary Structures in Q1
2016 • Construction Cost: Approx. $19m
National Grid Sub-Station Construction in June 2016
Blue Sphere Project Ownership:
“White Test” Diagnostics Q1 2017
“Test Waste” in Digesters and Producing Gas Q2 2017 • 22.75%
Pass Electricity to Grid July 2017
COD July 31, 2017
Mechanical Completion
* EBITDA is not generally recognized as a GAAP measurement.
18Completed Acquisition: Pavia, Italy
Four Acquisitions Complete Overview of Projects: Expected Annual Revenues:
• Combined Energy Output: 4MW • Total Revenue $8M
• Technology Process: Anaerobic Digester • PPA: GSE S.p.A (11 Years)
• Feedstock: Energy Crops • Annual project EBITDA*
- Feedstock Contracts in Place expected to be approx. $3.8M*
• Production Output: Electricity &
Compost Project Funding:
• Helios Energy Investments
STATUS: Producing • Acquisition Cost: $6.1M** + the
assumption of approximately
$18M in project debts.
Blue Sphere Ownership:
• 100% of 4 operational projects.
* EBITDA is not generally recognized as a GAAP measurement. ** Assumes an exchange rate of $1.17 to €1.00.
19Completed Acquisition: Udine, Italy
Acquisition Complete Overview of Projects: Expected Annual Revenues:
• Energy Output: 1MW • Total Revenue $2.36M
• Technology Process: Natural Oil • PPA: GSE S.p.A (11 Years)
Generator • Annual project EBITDA*
• Feedstock: Vegetable Oils expected to be approx. $1.03M
- Feedstock Contracts in Place
• Production Output:
Project Funding:
STATUS: Producing • Blue Sphere Equity: $1.2M
• Helios Energy Investments
approximately $1.62M in debt
financing.
• Total acquisition cost: $2.82M
Blue Sphere Ownership: 100%
* EBITDA is not generally recognized as a GAAP measurement. ** Assumes an exchange rate of $1.17 to €1.00.
20Contact Information
Thank You
For more information, please contact: Blue Sphere Corporation
301 McCullough Drive
4th Floor
Charlotte, NC 28262
704-909-2806
Shlomi Palas, CEO
www.bluespherecorporate.com
21You can also read