Biological Stressor Identification Procedures
←
→
Page content transcription
If your browser does not render page correctly, please read the page content below
Aquatic Life Use Assessment and                                              January 2021
Biological Stressor Identification Procedures
Introduction
The federal Clean Water Act contains requirements to report on the quality of a state’s waters.
Section 305(b) requires a comprehensive biennial report and Section 303(d) requires, from time
to time, a list of waters for which effluent limitations or other controls are not sufficient to meet
water quality standards (impaired waters). West Virginia code §22-11-7b also requires a biennial
report of the quality of the state’s waters. Water quality standards, both numeric and narrative are
protective of designated uses. Thus, if water quality standards are not met in a waterbody, the
waterbody cannot support its designated uses.

Legislative rules on Water Quality Standards (§47-CSR-2) describes in section 6.3, one of the
designated uses, Category B – Propagation and maintenance of fish and other aquatic life,
including both B1 (warmwater fishery) and B2 (Trout waters) waters. §47-CSR-2 – Section 3.2.i.
prohibits the presence of wastes in state waters that cause or contribute to significant adverse
impact to the chemical, physical, hydrologic, and biological components of aquatic ecosystems
and is commonly referred to as the narrative water quality criterion for aquatic life use.

WVDEP has modified its procedures for assessing attainment of the narrative criteria for Aquatic
Life Use (AQL) in response to legislative action amending WV Code §22-11-7b, requiring
WVDEP to prepare the Assessment Methodology for The Biological Component of The Narrative
Criteria in Wadeable Streams rule (§47-CSR-2B). §47-CSR-2B provides a general assessment
procedure, identifies attainment thresholds, and refers to this document to provide the specific
processes and tools used in determining attainment of the narrative criteria for the Aquatic Life
Use. This document also includes the stressor identification component referred to in §47-CSR-
2B.

Procedures for assessing AQL in non-wadeable streams and rivers and lakes have not yet been
developed. This document will be updated when those methods are developed.

Part I. Aquatic Life Use Attainment Procedures

§47-CSR-2B Section 3, describing the assessment methodology, is based on benthic
macroinvertebrate community data that has been determined to be the most effective and
efficient way to assess wadeable streams with riffle / run habitats – by far the most common
aquatic resource across West Virginia.

   Biological assessments and criteria address the cumulative impacts of all stressors,
   especially habitat degradation, and chemical contamination, which result in a loss of
   biological diversity. Biological information can help provide an ecologically based
   assessment of the status of a waterbody and as such can be used to decide which
   waterbodies need TMDLs (USEPA 1997c) and aid in the ranking process by targeting
   waters for TMDL development with a more accurate link between bioassessment and
   ecological integrity. (Barbour 1999).
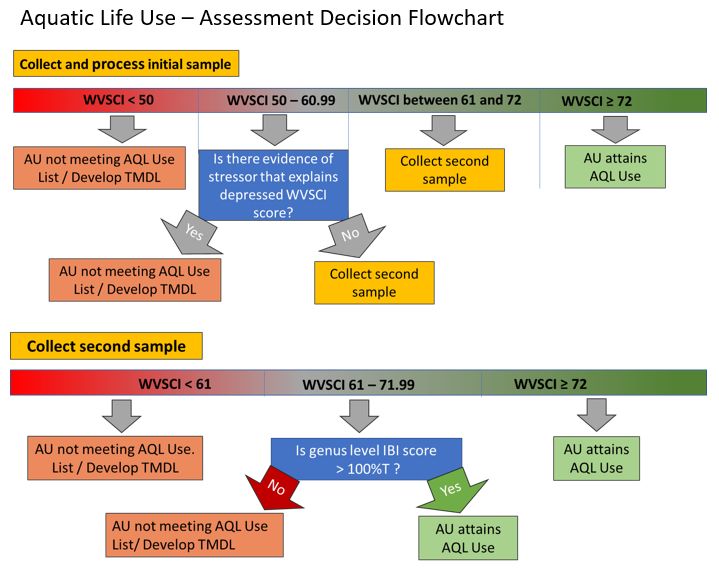
West Virginia Department of Environmental Protection - Aquatic Life Use Assessment Procedures
2018 / 2020 Assessment Cycles

   Rapid bioassessment using the benthic macroinvertebrate assemblage has been the
   most popular set of protocols among the state water resource agencies since 1989
   (Southerland and Stribling 1995).

Regarding efficiency, benthic macroinvertebrate data can be collected by one person with
minimal equipment and in a relatively short period of time. WVDEP has collected over 10,000
samples since the Watershed Assessment Branch began collecting these samples in 1996. The
Watershed Assessment Section’s Standard Operating Procedures Manual provides an in-depth
description of benthic data collection that must be followed to meet quality assurance and quality
controls and comparability before data are considered reliable for assessment.

Benthic IBI:
Based on general rapid bioassessment protocols designed to efficiently determine the health of
wadeable streams, WVDEP developed a state specific Benthic Index of Biotic Integrity (Benthic
IBI), referred to as the West Virginia Stream Condition Index (WVSCI), using family level
benthic macroinvertebrate data collected from 1996 to 1999. Information on the development of
WVSCI, the use of biological data, and the metrics on which a WVSCI score is derived are
available at: https://dep.wv.gov/WWE/watershed/bio_fish/Pages/Bio_Fish.aspx. This site also
describes minor updates made to WVSCI scoring that were made possible by the large volume of
data acquired since 1999. WVDEP has based AQL assessments for 303(d) listing on this IBI
since 2002.

Assessment Specifics:
When reporting on water quality and impairment, the WVDEP applies attainment decisions to
assessment units of a waterbody. Depending upon the size of the waterbody and factors such as
anthropogenic influences and historic data; a stream may be assessed as one unit or divided into
multiple segments. Results from one monitoring station may be applied to an entire assessment
unit.

If conflicting results emerge from multiple monitoring stations within the same assessment unit,
assessments decisions will be based on the preponderance of the data from recent samples. Data
from the collection efforts will be re-examined to ensure sample comparability. The proximity of
the stations to pollution sources will be considered. If an obvious reason for data disagreement
amongst sample stations exists, the stream segment may be divided into smaller assessment
units.

§47-CSR-2B Section 3.1.b identifies an attainment threshold of a WVSCI score equal to 72,
which is based on the 5th percentile of reference sample scores. The remainder of the rule
describes the procedures WVDEP will follow in determining attainment status. This includes
descriptions of when additional benthic macroinvertebrate samples are required, a Stressor
Identification determination based on water chemistry and habitat (see Part II), and/or the use of
genus level taxonomy.

When a single benthic macroinvertebrate sample assessment unit is available, an attainment
decision can be made if the WVSCI score is < 50 or if it is ≥ the attainment threshold of 72.
West Virginia Department of Environmental Protection - Aquatic Life Use Assessment Procedures
2018 / 2020 Assessment Cycles

Streams with WVSCI score
West Virginia Department of Environmental Protection - Aquatic Life Use Assessment Procedures
2018 / 2020 Assessment Cycles

attaining AQL. Stream segments for which the most recent score is ≥ 72 will be considered
attaining for AQL.

For streams or stream segments whose most recent sample has a WVSCI score ≥ 61 and < 72,
WVDEP will base decisions on genus level IBI scores. As with WVSCI, the attainment
thresholds for this genus level IBI, which has been developed for two regions (Mountains and
Plateau) and two seasons (spring and summer) will be based on the 5th percentile of region and
season specific reference sample scores. These scores have been adjusted so that the 5th
percentile score is equal to 100. These adjusted scores are referred to as %T (percent of
threshold) Genus IBI scores. When this genus level IBI was being developed, there was concern
regarding the difficulty involved with processing and identifying the small larvae of the
chironomidae family which often require individual specimens be mounted on microscope slides
for accurate identification to genus level. For this reason, an IBI was developed and tested that
used genus level identifications for most families but kept chironomids at the family level. This
version performed well and will be used in this step of the assessment process. Streams or
stream segments with %T Genus IBI CF (chironomidae at family level) scores ≥ 100 will be
considered attaining AQL Use and those with scores below this threshold will be considered
impaired. Information on the development of the genus level IBI can be found at: [need to put
info on GLIMPSS back on the website]

Fish Community Assessments:
In 2012, state legislators voted to change state code: §22-11-7b. Water quality standards;
implementation of antidegradation procedures; procedure to determine compliance with the
biologic component of the narrative water quality standard. Subsection (f) was updated, stating:
“The secretary shall propose rules measuring compliance with the aquatic life component of
West Virginia’s narrative water quality standard requires evaluation of the holistic health of the
aquatic ecosystem and a determination that the stream: (i) Supports a balanced aquatic
community that is diverse in species composition; (ii) contains appropriate trophic levels of fish,
in streams that have flows sufficient to support fish populations; and (iii) the aquatic community
is composed of benthic invertebrate assemblages sufficient to perform the biological functions
necessary to support fish communities within the assessed reach, or, if the assessed reach has
insufficient flows to support a fish community, in those downstream reaches where fish are
present.”

WVDEP worked with WVU faculty and graduate students to assemble all available fish
community data and develop a means of assessing this data for use in determining compliance
with the aquatic life component of WV’s narrative criteria. A group of fish biologists and
regulators worked for several years on the development of metrics capable of accurately
describing fish community health. It was determined that fish community data could not be used
for small headwater streams that have too few species to allow development of useful metrics.
There was also insufficient data available for larger streams and rivers. Therefore, efforts were
focused on wadeable streams, defined for this project as watersheds with drainage areas of
between 7 and 250 km2. It was determined that regional differences in fish communities
required unique metrics be developed for 5 distinct regions of the state and also that there was
insufficient data available to develop measures for coldwater streams.
West Virginia Department of Environmental Protection - Aquatic Life Use Assessment Procedures
2018 / 2020 Assessment Cycles

After several years of working to develop regional fish IBI’s for warmwater wadeable streams it
was determined that there was not enough data and other problems to provide for development of
useful assessment tools for regulatory purposes.

    •   There were too few reference and stressed sites that are needed to assess the performance
        of metrics in several regions.
    •   For regions with adequate numbers of reference and stressed sites, no IBI could be
        developed that could consistently distinguish between pre-determined high quality and
        stressed sites.
    •   Higher IBI scores were correlated with known stressors (e.g. lower percent forest and
        human development)

Fish community data continues to be collected across the state, with a focus on areas most in
need of additional data. The use of fish data for assessment of AQL Use will be revisited in the
future, thus the “Reserved” statement in Section 3.4 of the procedural rule.

Southerland, M.T. and J.B. Stribling. 1995. Status of biological criteria development and implementation. Pages 81-
96 in W.S. Davis and T.P. Simon (editors). Biological assessment and criteria: Tools for water resource planning
and decision making. Lewis Publishers, Boca Raton, Florida.

Barbour, M.T., J. Gerritsen, B.D. Snyder, and J.B. Stribling. 1999. Rapid Bioassessment Protocols for Use in
streams and Wadeable Rivers: Periphyton, Benthic Macroinvertebrates and Fish, Second Edition. EPA 841-B-99-
002. U.S. Environmental Protection Agency; Office of Water; Washington, D.C.

Part II.
Stressor Identification Overview
The Biological Stressor Identification (SI) process used to identify the cause of stream
impairment is based on an analysis of existing quantitative and qualitative water quality, physical
habitat, and biological data. This process was originally developed as part of the TMDL
development for streams deemed to be biologically impaired.
Biological assessments are useful in detecting impairment, but they do not necessarily identify
the cause (or causes) of impairment. USEPA developed Stressor Identification: Technical
Guidance Document to assist water resource managers in identifying stressors or combinations
of stressors that cause biological impact (Cormier et al., 2000). Elements of the SI
process are used to evaluate and identify the primary stressors on the aquatic life of biologically
impacted streams. SI is a formal and rigorous method that identifies stressors and provides a
structure for organizing the scientific evidence supporting the conclusions.

Technical Approach
Biological communities respond to any number of environmental stressors, including physical
impacts and changes in water and sediment chemistry. The primary sources of data used in the
SI process are water quality, biological, habitat, and other information stored in the WVDEP
Watershed Assessment Branch (WAB) database. Importantly, this database includes information
on pollutant source tracking, narrative descriptions of potential stressors and their sources, and
sample location photography. SI also includes the examination of pertinent Geographic
Information Systems (GIS) data including, but not limited to, National Pollutant Discharge
West Virginia Department of Environmental Protection - Aquatic Life Use Assessment Procedures 2018 / 2020 Assessment Cycles Elimination System (NPDES) point source data, WVDEP mining permits and activities coverages, and aerial imagery. WVDEP interprets water quality and biological information collected primarily by the agency’s Watershed Assessment Section via several monitoring programs. Most of these programs are based on collecting data from the state’s 32 major watersheds (HUC 8 level) on a five-year rotation. Pre-TMDL monitoring is conducted to collect sufficient data for the development and calibration of hydrology and water quality models. This monitoring is intensive, consisting of monthly sampling for parameters of concern, which captures data under a variety of weather conditions and flow regimes in one year. A comprehensive habitat assessment and biological monitoring are performed in conjunction with water quality monitoring. Sediment related habitat evaluations are performed during all monthly visits. Pre-TMDL monitoring also includes an effort to locate the specific sources of impairment, with attention paid to identifying non-point source land use stressors as well as any permitted facilities that may not be meeting their permit requirements Development of the Conceptual Model The first step in the SI process is to develop a list of candidate causes, or stressors. Potential causes are evaluated based on an assessment of watershed characteristics and the likely causes and sources of biological impairment. The relationship between candidate causes of impairment and potential biological effects are based on initial data analyses, knowledge of these watersheds, and experience in defining impairment causes in similar watersheds. Sources, impairment causes, and the resulting effects on the biological community depend on the stream or watershed in question. In some cases, biological impairment can be linked to a single stressor; in other situations, multiple stressors might be responsible for the impact. Data Analysis The second step in the SI process is to evaluate the information related to each of the candidate causes. Water quality parameters, habitat data, source tracking data, and all other quantitative and qualitative data are grouped under each respective candidate cause for analysis. In some cases, a variety of information is used to evaluate a candidate cause (e.g., sedimentation). The evidence presented is used to determine support or non-support of the listed candidate cause. At the conclusion of this process, one or more stressors (pollutants) may be identified. SI analysis involves comparing the water quality data, habitat information, and other non- biological data from an impaired station to established water quality standards and threshold values that have been developed on the basis of a statistical analysis of stressor-response patterns using reference stream data (Table 1.). Two sets of threshold values: elimination and strength of evidence are designated for most parameters. Elimination threshold values represent “not to exceed” levels for water quality and habitat variables. Sample station data are first compared with the elimination thresholds to determine whether additional analyses is necessary to evaluate a particular candidate cause (stressor). Each potential stressor is further evaluated using a strength-of-evidence approach if the elimination threshold is exceeded, related parameters or other information showed conflicting results, or there are limited data available. At least one parameter should exceed the candidate stressor threshold before a stressor can be identified.
West Virginia Department of Environmental Protection - Aquatic Life Use Assessment Procedures
2018 / 2020 Assessment Cycles

Biological data are also used in the SI process and include diagnostic tools with statistically
derived thresholds that evaluate a biological community’s response to specific stressors.
Currently, diagnostic tools based on an Observed/Expected (O/E) concept are used in SI process.
O/E is a taxonomic completeness model that assesses biological condition using the ratio of
observed taxonomic richness (O) to expected taxonomic richness (E) in the absence of
disturbance. Expected (E) taxonomic richness is established using reference site populations.
This basic concept was followed to develop three models capable of providing stressor specific
evidence of biological impacts in WV streams. These models are the O/E Sensitive (taxa that are
sensitive to a given stressor are included in the Expected group), O/E Opportunistic (taxa that are
opportunistic to a given stressor are included in the Expected group), and Percent Model Affinity
(similarity of a biological sample to the average taxonomic composition of each stressor
population) approaches. The stressors for which models are developed include organic
enrichment, sediment, ionic strength, acid deposition, and dissolved metals. The SI process
includes calculating O/E model scores for each stressor using biological sample data and then
comparing them to derived thresholds. These thresholds are considered with a weight of
evidence approach along with water chemistry, habitat, and other pertinent sources of
information.
Biological community metric and individual taxa are also reviewed for each sample station to
confirm decisions resulting from other lines of evidence. Many pollutants have a direct and
negative impact on macroinvertebrate presence/abundance; however, some stressors act by more
complex means on the biota. For example, an increased abundance of the midge group
Cricotopus_Orthocladius (Diptera - true flies) is typical in waters heavily enriched by nutrients;
consequently, both the population’s abundance and corresponding information regarding the
potential stressor are closely considered. A useful benthic community metric for identifying
metals toxicity is Ephemeroptera Taxa Richness (mayflies). This metric is often substantially
reduced compared to reference site values in streams with elevated dissolved metals and low pH.
As with other data, biological reviews of specific taxa and community metrics are used in a
weight of evidence approach along with water chemistry, habitat, and other pertinent sources of
information.
West Virginia Department of Environmental Protection - Aquatic Life Use Assessment Procedures
2018 / 2020 Assessment Cycles

Table 1.
 Candidate Cause          Parameter                   Elimination          Strength of Evidence (Evidence for each
                                                  Threshold (Rule out      Candidate Cause as stressor) Candidate
                                                   stressors at these                Stressor Thresholds
                                                      thresholds)
                          Al (dissolved)              0.20 mg/L – Evidence of Stressor1,4
                          Fe (total)                  Fe toxicity to benthic invertebrates is not well established.
                          Mn (total)                  Mn toxicity to benthic invertebrates is not well established.
                          O/E Opportunistic
                                                           na                      > 2.0 – Evidence of Stressor2
                          Model (AMD)
                          O/E Sensitive Model
                                                           na                      < 0.5 – Evidence of Stressor2
                          (AMD)
 1. Metals Toxicity
                          O/E PMA Model
 (Primarily Acid Mine                                      na                      > 0.3 – Evidence of Stressor2
 Drainage)                (AMD)
                                                 Professional judgment applied to benthic macroinvertebrate taxa and
                          Benthic Taxa review
                                                                community metrics from sample station.
                                                 Professional judgment applied to combination of station observations
                                                       including hot acidity, alkalinity, dissolved metals, specific
                          Qualitative Metals        conductance, TDS, sulfate, and other signature ions. Qualitative
                          Toxicity Evaluation:   ratings of metals flocculation and field rating of AMD stress. Station
                                                   photography, GIS imagery evaluation, and field notes and source
                                                                         tracking observations.
                          pH                               >6.3                                  < 6.03
                          O/E Opportunistic
                                                           na                      > 2.0 – Evidence of Stressor2
                          Model (Acid Precip)
                          O/E Sensitive Model
                                                           na                      < 0.5 – Evidence of Stressor2
                          (Acid Precip)
                          O/E PMA Model
                                                           na                      > 0.3 – Evidence of Stressor2
 2. Acidity (Acid         (Acid Precip)
 Deposition)                                     Professional judgment applied to benthic macroinvertebrate taxa and
                          Benthic Taxa review
                                                 community metrics from sample station.
                                                 Professional judgment applied to combination of station observations
                          Qualitative Acid       including hot acidity, alkalinity, dissolved metals, specific
                          Deposition             conductance, TDS, sulfate, and other signature ions. Station
                          Evaluation:            photography, GIS imagery evaluation, and field notes and source
                                                 tracking observations.
 3. High pH               pH                             93
                                                 Consider as independent stressor in non-acidic, non-AMD streams.
                          Specific               Maximun value at monitoring station.
                          Conductance
                                                 < 300 µmhos                      > 500 – Evidence of Stressor1
                          O/E Opportunistic
 4. Ionic Strength        Model (Ionic                     na                      > 2.0 – Evidence of Stressor2
                          strength)
                          O/E Sensitive Model
                                                           na                      < 0.5 – Evidence of Stressor2
                          (Ionic strength)
                          O/E PMA Model
                                                           na                      > 0.3 – Evidence of Stressor2
                          (Ionic strength)
West Virginia Department of Environmental Protection - Aquatic Life Use Assessment Procedures
2018 / 2020 Assessment Cycles
Candidate Cause Parameter Elimination Strength of Evidence (Evidence for each
Threshold (Rule out Candidate Cause as stressor) Candidate
stressors at these Stressor Thresholds
thresholds)
Professional judgment applied to benthic macroinvertebrate taxa and
Benthic Taxa review
community metrics from sample station.
Professional judgment applied to combination of station observations
4. Ionic Strength (cont.) including concentrations of constituent ions alkalinity, calcium,
Qualitative Ionic chloride, potassium, sodium, sulfate, magnesium. Concurrent (with
Strength evaluation: bio sample) and mean specific conductance at station also considered.
Station photography, GIS imagery evaluation, and field notes/source
tracking observations.
% Fines (sand + silt
+ clay) - in Kicked = 25 - Evidence of Stressor4
Area
RBP: Embeddedness 16.0 - 20.0 (optimal) < 9 - Evidence of Stressor4
RBP: Sediment
16.0 - 20.0 (optimal) < 8 - Evidence of Stressor4
Deposition
RBP: Bank Stability 16.0 - 20.0 (optimal) < 12 - Evidence of Stressor4
Silt Deposition Qualitative evaluation based on field rating of magnitude:
Rating - in 100m
> 2 (high or extreme) - Evidence of
Assessment Reach 2 (high or extreme) - Evidence of
Assessment Reach 2.0 – Evidence of Stressor2
(Sedimentation)
O/E Sensitive Model
na < 0.5 – Evidence of Stressor2
(Sedimentation)
O/E PMA Model
na > 0.3 – Evidence of Stressor2
(Sedimentation)
Professional judgment applied to benthic macroinvertebrate taxa and
Benthic Taxa review
community metrics from sample station.
Professional judgment applied to combination of RBP embeddedness,
sediment deposition, bank stability, bank vegetation, riparian
Qualitative
vegetation, and total scores; supplemented with watershed erosion
Sedimentation
rating, reach substrate particle characterization, sediment layer
evaluation:
profile, and field rating of sediment stress. Station photography, GIS
imagery evaluation, and field notes/source tracking observations.
Embeddedness due
to metals 16.0 - 20.0 (optimal) < 9 - Evidence of Stressor4
flocculation
7. Metals flocculation
(habitat alteration) Qualitative evaluation based on field rating of magnitude:
Metal Flocculation
Rating > 1 (moderate to extreme) - Evidence ofWest Virginia Department of Environmental Protection - Aquatic Life Use Assessment Procedures
2018 / 2020 Assessment Cycles
Candidate Cause Parameter Elimination Strength of Evidence (Evidence for each
Threshold (Rule out Candidate Cause as stressor) Candidate
stressors at these Stressor Thresholds
thresholds)
Qualitative evaluation based on field rating of abundance:
Filamentous Algae > 2 (high or extreme) – Evidence of
2 (high or extreme) – Evidence of
7.0 mg/L < 6.0 - Evidence of Stressor3
Total Phosphorus 0.05 – Evidence of Stressor5
Total Nitrogen 2.0 – Evidence of Stressor5
Fecal coliform 500 - Evidence of Stressor4
O/E Opportunistic
Model (Organic na > 2.0 – Strong Indication of Stressor2
8. Organic Enrichment Enrichment)
O/E Sensitive Model
(Organic na < 0.5 – Strong Indication of Stressor2
Enrichment)
O/E PMA Model
(Organic na > 0.3 – Strong Indication of Stressor2
Enrichment)
Professional judgment applied to benthic macroinvertebrate taxa and
Benthic Taxa review
community metrics from sample station.
Professional judgment applied to combination of station observations
such as atmospheric and water odors, presence of foam/suds, poorly
Qualitative Organic
treated domestic sewage, agriculture and livestock, residences, lawns,
Enrichment
field biologist/specialist organic enrichment determination, field
evaluation:
notes, station photography, GIS imagery evaluation, and information
from sources tracking efforts.
Max >87 F May through November; or
9. Temperature Degrees F
Max >73 F December through April.3
Qualitative supplemental information (field
Various chemical
10. Chemical Spills notes and other sources listed below this
parameters
table).
Notes:
-Elimination: Screening step to rule out particular stressors, based on unambiguous criteria.
-Strength of evidence: Data that provide evidence for identification of each particular candidate cause as a biological stressor.
-RBP: Rapid Bioassessment Protocol.
-Qualitative: Supplemental evidence to evaluate each candidate stressor.
-Benthic taxa review: Review taxa lists and metrics to find indicators of specific stressor.
-O/E Models: Observed over Expected models using benthic macroinvertebrate taxa; diagnose specific stressor.West Virginia Department of Environmental Protection - Aquatic Life Use Assessment Procedures
2018 / 2020 Assessment Cycles
Candidate Cause Parameter Elimination Strength of Evidence (Evidence for each
Threshold (Rule out Candidate Cause as stressor) Candidate
stressors at these Stressor Thresholds
thresholds)
References & Sources:
1WVDEP WAB Data Analysis. 2020.
2Tetra Tech Memo: Methods & Results of Site-Specific Biological Modeling (O/E) with Stressor Module Task (Feb. 26, 2019).
3West Virginia Code §47, Series 2. 2014. Requirements governing water quality standards.
4Gerritsen,J., L. Zheng, J. Burton, C. Boschen, S. Wilkes, J. Ludwig, and S. Cormier. 2010. Inferring Causes of Biological Impairment
in the Clear Fork Watershed, West Virginia. U.S. Environmental Protection Agency, Office of Research and Development,
National Center for Environmental Assessment, Cincinnati, OH. EPA/600/R-08/146.
5VDEQ. 2017. Stressor Analysis in Virginia: Data Collection and Stressor Thresholds. VDEQ Technical Bulletin WQA/2017-001.
6Novak, M.A. and R.W. Bode. 1992. Percent model affinity: a new measure of macroinvertebrate community composition. Journal of
the North American Benthological Society 11(1): 80-85.
Actions based on Assessments and Stressor Identification
Listing on the 303d list as impaired, requires the development of TMDLs to prescribe reductions of
pollutants causing impairment. Most often streams for which AQL Use is non-attaining are also
impaired for associated numeric water quality criteria. For instance, because of the high iron content
in West Virginia soils, streams stressed with sedimentation often also exceed the total iron water
quality criterion. When a relationship is established through total suspended solids and iron
correlations during TMDL development, a sediment reference watershed is used to test if reductions
to pollutant sources prescribed in total iron TMDLs are as protective as those that would be
prescribed through biological TMDLs for sedimentation. When those reductions are determined to be
protective, total iron TMDLs are used as surrogates for biological TMDLs. In instances where total
iron TMDLs are not appropriate surrogates, independent biological TMDLs are required to resolve
the 303d listing.
Similar relationships can be seen between other common biological stressors and impairment of
numeric criteria, such as organic enrichment and fecal coliform where there are sources of untreated
human waste or influence from a pasture; acidity and low pH when there is acid precipitation; metals
toxicity and dissolved aluminum when there is acid mine drainage. TMDLs that prescribe reductions
to pollutant sources to attain fecal coliform, pH, and dissolved metals criteria act as surrogates to
resolve stress from organic enrichment, acidity, and metals toxicity.
In the absence of a relationship between a stressor and an established numeric criterion, such as for ionic
toxicity, biological TMDLs are required to prescribe reductions to ions to address the 303d listing.
Prescribed reductions will meet a TMDL endpoint for specific conductivity that will be protective of
aquatic life. WVDEP is aware that in some streams, biological impairment for the designated AQL Use
associated with ionic toxicity may not be attainable. In those instances, a multisector variance or Use
Attainability Analysis will be pursued for both an alternate biological attainment threshold and specific
conductivity endpoint.You can also read