Big Sandy Power Plant Fly Ash Pond - Alternative Source Demonstration
←
→
Page content transcription
If your browser does not render page correctly, please read the page content below
Big Sandy Power Plant
                                   Fly Ash Pond
                        Alternative Source Demonstration

The Big Sandy Fly Ash Pond initiated an assessment monitoring program in accordance with 40
CFR 257.95 on April 13, 2018. Groundwater protection standards (GWPS) were set in
accordance with 257.95(d)(2) and a statistical evaluation of the assessment monitoring data
was conducted. This statistical evaluation revealed an exceedance of the GWPS for beryllium,
cobalt, and lithium at Monitoring Well MW‐1603 on February 3, 2021. A successful alternative
source demonstration (ASD) was completed per 257.95(g)(3), therefore, the Big Sandy Fly Ash
Pond will remain in assessment monitoring. An alternative source demonstration is
documentation that shows a source other than the CCR unit was responsible for causing the
statistics to exceed the GWPS. The ASD document will explain the alternate cause of the GWPS
exceedances. The successful ASD is attached.
Alternative Source Demonstration Addendum Report for the October 2020 Monitoring Data Big Sandy Fly Ash Pond Louisa, Kentucky Prepared for: American Electric Power Prepared by: April 2021
Alternative Source Demonstration Addendum Report for the October 2020 Monitoring Data
Big Sandy Fly Ash Pond
Table of Contents

Table of Contents
1       Introduction ............................................................................................................................ 1
        1.1        Objectives ........................................................................................................................... 1
        1.2        Lines of Evidence ................................................................................................................ 2

2       Project Background ................................................................................................................. 3
        2.1        Groundwater Monitoring Network Evaluation................................................................... 3
        2.2        Groundwater Monitoring ................................................................................................... 5

3       Alternative Source Demonstration Requirements .................................................................... 7
        3.1        Alternative Source Demonstration ..................................................................................... 7
        3.2        Assessment of Groundwater Monitoring Results ............................................................... 7

4       Alternative Source Demonstration Assessment ....................................................................... 8
        4.1        Groundwater Data Analysis ................................................................................................ 8
                   4.1.1 Primary Indicators .................................................................................................. 9
                   4.1.2 Potential Indicators .............................................................................................. 11
                   4.1.3 ASD Constituent Trends ....................................................................................... 14
                   4.1.4 Indicator Analysis Findings................................................................................... 16
        4.2        Tier I Evaluation - Statistical Evaluation ............................................................................ 16
        4.3        Tier II Evaluation - Geochemical Evaluation ..................................................................... 17
                   4.3.1 Ion Ratios ............................................................................................................. 17
                   4.3.2 Ternary Plots ........................................................................................................ 18
                   4.3.3 Summary .............................................................................................................. 19

5       Summary and Conclusions ..................................................................................................... 20

6       References............................................................................................................................. 21

EHS Support LLC                                                                                                                                           i
Alternative Source Demonstration Addendum Report for the October 2020 Monitoring Data Big Sandy Fly Ash Pond Table of Contents List of In-Text Tables Table 2-1 Screened Interval of Monitoring Wells Table 2-2 MW-1603 October 2020 Groundwater Quality Table 4-1 Median Concentrations of Boron, Chloride, and Sulfate Table 4-2 Ion Ratios List of In-Text Figures Figure 4-1 MW-1603 Boron Concentrations Figure 4-2 MW-1603 Sulfate Concentrations Figure 4-3 MW-1603 Chloride Concentrations Figure 4-4 MW-1603 Bromide Concentrations Figure 4-5 MW-1603 Fluoride Concentrations Figure 4-6 MW-1603 Molybdenum Concentrations Figure 4-7 MW-1603 Potassium Concentrations Figure 4-8 MW-1603 Sodium Concentrations Figure 4-9 MW-1603 pH Values Figure 4-10 MW-1603 Beryllium Concentrations Figure 4-11 MW-1603 Cobalt Concentrations Figure 4-12 MW-1603 Lithium Concentrations Figure 4-13 Ternary Plot MW-1603 List of Attached Figures Figure 1 Site Layout Figure 2 Groundwater Monitoring Well Locations List of Attached Tables Table 1 MW-1603 Historical Groundwater Data September 2016 to October 2020 List of Appendices Appendix A Box Plots EHS Support LLC ii
Alternative Source Demonstration Addendum Report for the October 2020 Monitoring Data
Big Sandy Fly Ash Pond
Acronyms

Acronyms
µg/L                    micrograms per liter
AEP                     American Electric Power
ASD                     alternative source demonstration
bgs                     below ground surface
BSFAP                   Big Sandy Fly Ash Pond
CCR                     coal combustion residual
CFR                     Code of Federal Regulations
EPRI                    Electric Power Research Institute
ft                      foot/feet
GWPS                    Groundwater Protection Standards
KGS                     Kentucky Geological Survey
LCL                     lower confidence level
mg/L                    milligrams per liter
msl                     mean sea level
MDL                     method detection limit
ORP                     oxidation-reduction potential
pCi/L                   picocuries per liter
ppm                     parts per million
SSL                     statistically significant level
S.U.                    standard units (pH)
TDS                     total dissolved solids
UCL                     upper confidence level
USEPA                   United States Environmental Protection Agency
USGS                    United States Geological Survey

Trademarks, trade names, company, or product names referenced herein are used for identification
purposes only and are the property of their respective owners.

EHS Support LLC                                                                                    iii
Alternative Source Demonstration Addendum Report for the October 2020 Monitoring Data
Big Sandy Fly Ash Pond
Introduction

1 Introduction
EHS Support LLC (“EHS Support”) was retained by American Electric Power (AEP) – Kentucky Power
Company in December 2018 to conduct an alternative source demonstration (ASD) investigation for coal
combustion residual (CCR) constituents in groundwater near the Big Sandy Fly Ash Pond (BSFAP). The
BSFAP is associated with the Big Sandy Power Plant located in Louisa, Kentucky (EHS Support, 2019a).
The ASD determined that groundwater in the vicinity of the BSFAP was not being impacted by CCR
constituents from the BSFAP. The statistically significant levels (SSLs) of beryllium, cobalt, and lithium
concentrations present in excess of the Groundwater Protection Standards (GWPS), which triggered the
ASD investigation, were determined to be a result of the oxidation of coal seams that were intersected
by the borehole and well screen for well MW-1603.

Since the initial ASD investigation was completed (incorporating data from September 2016 to October
2018), the following ASD investigations have been conducted:
    • The second ASD investigation was conducted after the March 2019 groundwater monitoring
        data indicated continued SSLs of beryllium, cobalt, and lithium exceeding the GWPS at MW-
        1603 (EHS Support, 2019b).
    • The third ASD investigation was conducted following continued detections of beryllium, cobalt,
        and lithium at SSLs above the GWPS in MW-1603 during the August 2019 sampling event (EHS
        Support, 2020). In addition, an SSL of radium 226 combined with radium 228 (hereafter radium
        226/228) above its GWPS was measured for the first time in MW-1603 during the August 2019
        sampling event (EHS Support, 2020).
    • The fourth ASD investigation was conducted following continued detections of the four
        constituents (beryllium, cobalt, lithium, and radium 226/228) at SSLs above the GWPS in MW-
        1603 In March and June 2020 (EHS Support, 2021).

In October 2020, three constituents (beryllium, cobalt, and lithium) were detected at SSLs above the
GWPS in MW-1603, thus requiring the ASD addendum investigation presented in this report. This ASD
addendum investigation has been prepared per the requirements of the United States Environmental
Protection Agency (USEPA) CCR Rule (40 Code of Federal Regulations [CFR] §257.95). The concentrations
of beryllium, cobalt, and lithium in MW-1603 groundwater were determined herein to result from Type
IV natural variations in groundwater (ASD types are discussed in Section 3.1). This conclusion was
reached by examining analytical results for compounds detected at SSLs in the context of the broader
list of CCR constituents analyzed at the Site.

1.1 Objectives

The objective of this ASD investigation is to assess groundwater monitoring data collected in compliance
with the CCR Rule, as allowed under paragraph 40 CFR §257.95(g)(3)(ii) of the CCR Rule. This part of the
CCR Rule allows AEP to determine whether the source(s) for SSLs of beryllium, cobalt, and lithium
exceeding the GWPSs, as reported in groundwater monitoring well MW-1603, are associated with the
CCR unit; or alternatively if the SSL resulted from an error in sampling, analysis, statistical evaluation, or
natural variation in groundwater quality.

EHS Support LLC                                                                                              1
Alternative Source Demonstration Addendum Report for the October 2020 Monitoring Data
Big Sandy Fly Ash Pond
Introduction
1.2 Lines of Evidence
This fifth ASD investigation for the BSFAP has been conducted to further evaluate potential alternate
sources or reasons for the continuing detection of SSLs of beryllium, cobalt, and lithium in groundwater
samples from monitoring well MW-1603.
A potential alternate source was previously identified in the prior four ASD investigations (EHS Support,
2019a, 2019b, 2020, and 2021), based on the following lines of evidence:
• A lack of exceedances and increasing trends of primary indicators of CCR.
• Constituent concentrations in BSFAP water lower than those of the corresponding constituent
observed in groundwater from MW-1603.
• Major ion chemistry was not indicative of mixing between BSFAP water and groundwater.
For the purposes of this ASD addendum investigation, constituents were identified that would serve as a
primary indicator for CCR. A primary indicator must meet both of the following criteria:
1. Constituent typically has a high concentration in CCR leachate, relative to background, such that
it is expected to have an elevated concentration in the event of a release.
2. Constituent is unreactive and has high mobility in groundwater, such that it is expected to be at
the leading edge of the plume. Consequently, the constituent will have elevated concentrations
relative to background across the entire area of the plume.
As boron and sulfate are primary indicators for CCR (Electric Power Research Institute [EPRI], 2012) and
have previously been evaluated, they have been re-evaluated herein as primary indicators for this ASD
investigation. In addition, chloride is used as a primary indicator for this ASD. Other potential indicators
that were evaluated in this ASD investigation include potassium, sodium, fluoride, molybdenum, and
bromide.
EHS Support LLC 2Alternative Source Demonstration Addendum Report for the October 2020 Monitoring Data Big Sandy Fly Ash Pond Project Background 2 Project Background A detailed description of Site location, history, and geology was previously provided in the Alternative Source Demonstration Report for Beryllium, Cobalt and Lithium, Big Sandy Fly Ash Pond, Louisa, Kentucky (EHS Support, 2019a). Attached Figure 1 and Figure 2 show the Site layout and groundwater monitoring network, respectively. To support and provide context to this ASD addendum investigation, the following sections describe the groundwater monitoring network and groundwater monitoring. 2.1 Groundwater Monitoring Network Evaluation On behalf of AEP, Geosyntec Consultants, Inc. (“Geosyntec”) conducted an assessment of the groundwater monitoring network in the uppermost aquifer associated with the BSFAP (Geosyntec, 2016). Geosyntec determined that the hydrostratigraphy in the vicinity of the BSFAP is characterized by an interconnected water-bearing system comprised of Pennsylvanian-aged bedrock (of the Breathitt Group, Conemaugh Formation) and Quaternary alluvium. The Conemaugh Formation and Breathitt Group consists of sandstones, siltstones, shale, and coal that may grade laterally and vertically into one another. The overlying Quaternary alluvium deposits include sandy lean clay to silty sand and gravel at the bottom of the Horseford Creek valley and the floodplain of Blaine Creek. Based on these hydrogeologic conditions, Geosyntec defined the interconnected water-bearing system of the fractured bedrock and alluvium as the uppermost aquifer for the BSFAP CCR unit. This determination was based on the presence of groundwater in numerous monitoring wells screened in the water-bearing units (fractured bedrock and alluvium), the recovery of these wells during pumping and development, and a potentiometric surface generally consistent with Site topography and surface water elevations. To assess the upper water-bearing aquifer (fractured bedrock and alluvium), Geosyntec defined the groundwater detection monitoring network with 10 groundwater monitoring wells (Geosyntec, 2016). Of these, six monitoring wells (MW-1011, MW-1012, MW-1203, MW-1601, MW-1602, and MW-1603) are screened in fractured sandstone and shale layers of the Breathitt formation. The remaining four monitoring wells (MW-1604 through MW-1607) are screened in the alluvium. The location of each groundwater monitoring well within the uppermost aquifer is shown in Figure 2. Three of the monitoring wells (MW-1011, MW-1012, and MW-1203) screened in bedrock were installed on the hillside slopes upgradient of the BSFAP to support background monitoring. Three monitoring wells (MW-1601, MW-1602, and MW-1603) were installed in bedrock located downgradient of the BSFAP and used for compliance monitoring. Two monitoring wells (MW-1604 and MW-1605) were screened in alluvium and are used for background monitoring; while the remaining two monitoring wells (MW-1606 and MW-1607), screened in alluvium and located below the Main Dam, are used for compliance monitoring. As bedrock monitoring well MW-1603 is the focus of this ASD, the boring log was reviewed (EHS Support, 2019a). The boring log descriptions show alternating sequences of yellowish-brown sandstones and bluish-gray to black shales (beginning at 13 feet below ground surface [ft bgs] and extending to the bottom of the boring at 39.5 ft bgs) that are indicative of the upper portion of the Princess Formation (uppermost formation in the Breathitt Group [Rice and Hiett, 1994]). Within the screened interval (22 to EHS Support LLC 3
Alternative Source Demonstration Addendum Report for the October 2020 Monitoring Data
Big Sandy Fly Ash Pond
Project Background

32 ft bgs), the shale at a depth of 24 to 25 ft bgs was described as “intensely fractured, black, wet, nearly
all organic matter; slight coaly texture.” This depth (24 to 25 ft bgs) corresponds with the measurements
by the Kentucky Geological Survey (KGS) of the elevation of the Princess Number 8 coal, which is present
within the Princess Formation of the Breathitt Group (EHS Support, 2019a). Coal or “organic material”
was also visually identified during soil boring logging in three other monitoring wells (MW-1608, MW-
1609, and MW-1610) in the network (Table 2-1) at the same approximate elevation, between 630 and
650 feet, that matches the KGS measurements. No coal was documented in this section in three
monitoring wells (MW-1601, MW-1602, and MW-1611). Four monitoring wells (MW-1604, MW-1605,
MW-1606, and MW-1607) were installed below this coal layer in the sedimentary sequence.
                              Table 2-1           Screened Interval of Monitoring Wells
        Well/Boring                 Surface Elevation         Screened Interval         Coal or “Organics”
                                         (ft msl)                  (ft msl)          Description at ~632-650 ft
         MW-1601                          713.8                  646.8-636.8       No coal logged
         MW-1602                          711.6                  632.1-622.1       No coal logged
         MW-1603                          673.2                  651.2-641.2       Yes, at a depth of ~25 ft
                                                                                   (Elevation of 648 ft)
         MW-1604                          553.1                  513.1-503.1       ---
         MW-1605                          554.4                  538.9-528.9       ---
         MW-1606                            551                  513.1-503.1       ---
         MW-1607                          542.2                  518.7-508.7       ---
         MW-1608                          716.2                  606.6-596.6       Yes, at depths of ~74 ft
                                                                                   (Elevation of 642 ft), ~ 75.3 to
                                                                                   76.6 ft (Elevation of 641 to
                                                                                   640 ft), and ~ 83.5 to 84 ft
                                                                                   (Elevation of 633 to 632 ft)
         MW-1609                           ~728                      ---           Yes, at a depth of ~79 ft
                                                                                   (Elevation of 649 ft)
         MW-1610                           ~716                      ---           Yes, at a depth of ~81 ft
                                                                                   (Elevation of 635 ft)
         MW-1611                           ~711                   606-596          No coal logged

--- = Boring advanced below the coal interval
~ = Approximate
ft = feet
msl = mean sea level

Geosyntec determined that the groundwater monitoring well network described above meets the
requirements of 40 CFR §257.91, as it consists of a sufficient number of wells installed at the
appropriate locations and depths to yield groundwater samples from the uppermost aquifer, which
accurately represents the quality of background groundwater and groundwater passing the waste
boundary of the BSFAP.

EHS Support LLC                                                                                                       4
Alternative Source Demonstration Addendum Report for the October 2020 Monitoring Data
Big Sandy Fly Ash Pond
Project Background
2.2 Groundwater Monitoring
AEP has conducted groundwater monitoring of the uppermost aquifer to meet the requirements of the
CCR Rules. Groundwater monitoring generally included the following activities:
• Collection of groundwater samples and analysis for Appendix III and Appendix IV constituents,
as specified in 40 CFR §257.94 et seq. and AEP’s Groundwater Sampling and Analysis Plan (AEP
and EHS Support, October 2016).
• Completion of validation tests for groundwater data, including tests for completeness, valid
values, transcription errors, and consistent units.
• Establishment of background data for each Appendix III and Appendix IV constituent.
• Initiation of detection monitoring sampling and analysis.
• Evaluation of the groundwater data using a statistical process per 40 CFR §257.93, which was
prepared, certified, and posted to AEP’s CCR website in April 2017 in AEP’s Statistical Analysis
Plan (Geosyntec, 2017); the statistical process was guided by USEPA’s Statistical Analysis of
Groundwater Monitoring Data at RCRA Facilities, Unified Guidance (“Unified Guidance”; USEPA,
2009).
• Initiation of assessment monitoring sampling and analysis.
• Completion of statistical data evaluation and determination of GWPS.
Assessment monitoring for the BSFAP has been conducted on a semi-annual basis since April 2018. The
groundwater data collected up until and including the October 2020 monitoring events have been used
for this ASD addendum investigation. Assessment monitoring data for well MW-1603 in October 2020 is
provided in Table 2-2.
Table 2-2 MW-1603 October 2020 Groundwater Quality
Analyte Unit October 2020 Value
Antimony µg/LAlternative Source Demonstration Addendum Report for the October 2020 Monitoring Data
Big Sandy Fly Ash Pond
Project Background
Analyte Unit October 2020 Value
Mercury µg/LAlternative Source Demonstration Addendum Report for the October 2020 Monitoring Data
Big Sandy Fly Ash Pond
Alternative Source Demonstration Requirements
3 Alternative Source Demonstration Requirements
3.1 Alternative Source Demonstration
Potential causes that may support an ASD include, but are not limited to, sampling causes (ASD Type I),
laboratory causes (ASD Type II), statistical evaluation causes (ASD Type III), and/or natural variation
causes (ASD Type IV). This ASD for the BSFAP is focused on assessing whether Type IV natural variations
in groundwater could be the cause of the SSLs of beryllium, cobalt, and lithium reported for
groundwater collected from monitoring well MW-1603 during the October 2020 sampling.
Historical groundwater monitoring data for MW-1603 is provided in Table 1(attached).
3.2 Assessment of Groundwater Monitoring Results
The following constituents will typically provide the information required for a complete ASD:
• Primary indicators (boron and sulfate) are evaluated for potential BSFAP leachate.
• Major ion concentrations (alkalinity, chloride, sulfate, calcium, magnesium, potassium, and
sodium) in leachate and groundwater are used to evaluate whether downgradient groundwater
chemistry remains representative of background groundwater chemistry. Major ion chemistry
can also be used to evaluate natural variability due to seasonal changes or other causes.
• Field turbidity of groundwater is used as an indicator of the presence of suspended solids that
may contribute to elevated concentrations of constituents monitored in unfiltered samples
under the CCR Rule.
• pH of leachate and groundwater provides information on chemical reactions and potential
mobility of constituents in groundwater.
• Dissolved oxygen, oxidation-reduction potential (ORP), iron, and manganese in groundwater are
used as indicators of redox conditions. Redox changes can affect the chemical state and
solubility of sulfate, in addition to trace elements including arsenic and selenium. For example,
under strongly reduced conditions (ORP less than –200 millivolts at pH 7), sulfate can be
reduced to form hydrogen sulfide or it can precipitate as iron sulfide, arsenic reduces to the
more mobile arsenite species, and selenium reduces to the low-mobility selenite species.
Groundwater monitored at a CCR unit for compliance with the CCR Rule is a compilation of the history of
all sources of water comingling at that particular monitoring well. Different sources may contribute to
the presence and detection of some of the same constituents, making source identification challenging.
The identification and use of water quality “signatures” can be used as a tool for deciphering the
similarity between potential sources and the water quality at a specific monitoring point.
EHS Support LLC 7Alternative Source Demonstration Addendum Report for the October 2020 Monitoring Data
Big Sandy Fly Ash Pond
Alternative Source Demonstration Assessment
4 Alternative Source Demonstration Assessment
As stated within Section 1.2, the primary indicators for CCR leachate impacts to groundwater are boron
and sulfate. In addition to these two constituents, chloride is also used as a primary indicator for this
ASD. Other potential indicators that have been evaluated include potassium, sodium, fluoride,
molybdenum, and bromide.
As identified in Section 1.1, SSLs of beryllium, cobalt, and lithium have been reported in groundwater
samples above the GWPS from monitoring well MW-1603 in October 2020. The water quality signatures
for well MW-1603 are discussed in Section 4.3 and compared to the water quality of the BSFAP.
EPRI (2012) defines three tiers of investigation for evaluation of water quality signatures to determine if
elevated concentrations represent a release from a CCR facility:
• Tier I: Trend Analysis and Statistics
• Tier II: Advanced Geochemical Evaluation Methods
• Tier III: Isotopic Analyses
Conversely, these tools can also be used to evaluate whether or not sources other than CCR are
contributing to groundwater quality degradation.
The CCR Rule requires statistical analysis under assessment monitoring for the determination of SSLs
above the GWPS. Many of the primary and potential indicator constituents listed for CCR (EPRI, 2017)
are included in AEP’s constituent list for the BSFAP groundwater monitoring programs, including primary
constituents boron and sulfate. If there is an SSL without a corresponding increase in a primary indicator
constituent (boron and usually sulfate for CCR), then this is a key line of evidence for an ASD.
4.1 Groundwater Data Analysis
Temporal plots are provided in the following subsections for well MW-1603. Each of the plots uses the
following color-coding system:
• Red – indicates a concentration reported above the reporting limit.
• Orange – indicates a concentration reported below the reporting limit but greater than the
method detection limit (MDL) (denoted as estimated “J” values).
• Green – indicates a concentration not detected at or above the MDL (denoted as “U”); results
were conservatively plotted as the MDL.
The October 19, 2017 data for the BSFAP water is presented for comparison. The BSFAP water signature
is plotted as a constant concentration in Figure 4-1 to Figure 4-12. As the BSFAP accepted fly ash before
1970, it is probable that BSFAP water quality has historically varied over time. However, since the BSFAP
ceased accepting fly ash before 2016, the water quality is anticipated to be more stable; therefore, the
October 19, 2017 data provides a reasonable representation of current BSFAP conditions.
Groundwater quality for well MW-1603 is plotted on the primary y-axis and BSFAP water quality is
plotted on the secondary y-axis, due to the differences in concentration between the groundwater
quality in the vicinity of MW-1603 and the BSFAP water, as labeled in Figure 4-1 to Figure 4-12
EHS Support LLC 8Alternative Source Demonstration Addendum Report for the October 2020 Monitoring Data
Big Sandy Fly Ash Pond
Alternative Source Demonstration Assessment
4.1.1 Primary Indicators
Temporal plots for primary indicators boron, sulfate, and chloride reported in groundwater monitoring
well MW-1603 are provided in Figure 4-1 to Figure 4-3, respectively.
Figure 4-1 MW-1603 Boron Concentrations
EHS Support LLC 9Alternative Source Demonstration Addendum Report for the October 2020 Monitoring Data
Big Sandy Fly Ash Pond
Alternative Source Demonstration Assessment
Figure 4-2 MW-1603 Sulfate Concentrations
Figure 4-3 MW-1603 Chloride Concentrations
EHS Support LLC 10Alternative Source Demonstration Addendum Report for the October 2020 Monitoring Data
Big Sandy Fly Ash Pond
Alternative Source Demonstration Assessment
Boron and sulfate concentrations in MW-1603 have remained relatively stable within the same order of
magnitude, with minor variability over the monitoring period (September 2016 through October 2020).
Chloride concentrations in MW-1603 remained relatively stable between 2.93 and 3.24 mg/L until April
2018, after which a slight increase is observed that has remained stable between 3.92 and 4.42 mg/L.
Boron and chloride in water from the BSFAP are present at higher concentrations than in groundwater
at MW-1603, whereas sulfate is present at higher concentrations in groundwater at MW-1603 than in
water from the BSFAP.
In summary, there were negligible changes in primary indicator concentrations since the last review in
January 2021.
4.1.2 Potential Indicators
Temporal plots for potential indicators (bromide, fluoride, molybdenum, potassium, and sodium)
reported in groundwater monitoring well MW-1603 are provided in Figure 4-4 to Figure 4-8,
respectively.
Figure 4-4 MW-1603 Bromide Concentrations 1
1
Bromide is below the level of reporting for the BSFAP water, with an MDL of less than 0.05 mg/L for this sample result.
EHS Support LLC 11Alternative Source Demonstration Addendum Report for the October 2020 Monitoring Data
Big Sandy Fly Ash Pond
Alternative Source Demonstration Assessment
Figure 4-5 MW-1603 Fluoride Concentrations
Figure 4-6 MW-1603 Molybdenum Concentrations
EHS Support LLC 12Alternative Source Demonstration Addendum Report for the October 2020 Monitoring Data
Big Sandy Fly Ash Pond
Alternative Source Demonstration Assessment
Figure 4-7 MW-1603 Potassium Concentrations
Figure 4-8 MW-1603 Sodium Concentrations
EHS Support LLC 13Alternative Source Demonstration Addendum Report for the October 2020 Monitoring Data
Big Sandy Fly Ash Pond
Alternative Source Demonstration Assessment
Molybdenum, potassium, and sodium concentrations in groundwater from MW-1603 have consistently
been lower than water from the BSFAP. As seen in Figure 4-6, molybdenum was last detected above
MDL in MW-1603 in September 2018. The recent variation in molybdenum concentrations, as shown in
green, is due to variable MDLs achieved via laboratory analysis. Fluoride concentrations in groundwater
from MW-1603 have consistently been higher than water from the BSFAP but have been at historical
low concentrations for the past two sampling events in 2020, following an overall declining
concentration trend with time. Bromide concentrations in groundwater from MW-1603 have been
mostly below the MDL. Bromide was detected only once since the initial background monitoring events.
When bromide was detected (May 2017) it was 0.06 mg/L, or slightly above the less than 0.05 mg/L
reported for BSFAP water in May 2017.
A comparison of the pH of BSFAP water and groundwater from MW-1603 is provided in Figure 4-9. The
figure illustrates the substantial difference in pH between the pond water and groundwater of
approximately three to five standard units. This is using the standard (logarithmic) pH scale which
converts to a factor of 1,000 to 100,000 difference in the hydrogen ion concentration between the
BSFAP and MW-1603. The pH in MW-1603 is acidic with values generally between 3 and 4 standard pH
units, whereas the BSFAP water is alkaline at a pH of approximately 8 standard units.
Figure 4-9 MW-1603 pH Values
In summary, there were negligible changes in potential indicator concentrations since the last review in
January 2020.
4.1.3 ASD Constituent Trends
Temporal plots for the ASD constituents, beryllium, cobalt, and lithium reported in groundwater
monitoring well MW-1603 are provided in Figure 4-10 to Figure 4-12, respectively.
EHS Support LLC 14Alternative Source Demonstration Addendum Report for the October 2020 Monitoring Data
Big Sandy Fly Ash Pond
Alternative Source Demonstration Assessment
Figure 4-10 MW-1603 Beryllium Concentrations
Figure 4-11 MW-1603 Cobalt Concentrations
EHS Support LLC 15Alternative Source Demonstration Addendum Report for the October 2020 Monitoring Data
Big Sandy Fly Ash Pond
Alternative Source Demonstration Assessment
Figure 4-12 MW-1603 Lithium Concentrations
Beryllium, cobalt, and lithium concentrations are higher in groundwater from MW-1603 compared to
BSFAP water, indicating that the source of beryllium, cobalt, and lithium is not associated with the
BSFAP.
4.1.4 Indicator Analysis Findings
Based on the temporal plots for primary indicators, potential indicators, and ASD constituents, it is
considered unlikely that CCR constituents from the BSFAP are influencing the chemistry of surrounding
groundwater. This is based on the primary indicator sulfate, potential indicators fluoride and bromide,
and the ASD constituent’s beryllium, cobalt, and lithium all being present at higher concentrations in
surrounding groundwater in comparison to the BSFAP water (EHS Support, 2019a). As the
concentrations of these constituents in surrounding groundwater are higher, it is unlikely that there is a
concentration gradient extending from the BSFAP into groundwater. It is more likely that an alternate
source is contributing to the higher concentrations observed in groundwater.
In summary, based on the analyses presented above, no trends in the MW-1603 groundwater dataset
suggest that CCR constituents are migrating from the BSFAP into groundwater.
4.2 Tier I Evaluation - Statistical Evaluation
Statistical evaluations of analytes have been conducted previously (EHS Support, 2019a, 2019b, 2020,
and 2021). The evaluations concluded that groundwater in the vicinity of MW-1603 is statistically the
EHS Support LLC 16Alternative Source Demonstration Addendum Report for the October 2020 Monitoring Data Big Sandy Fly Ash Pond Alternative Source Demonstration Assessment same as that which the United States Geological Survey (USGS) reported for regional background (Ruppert et al., 2000) for arsenic, boron, calcium, chloride, chromium, fluoride, molybdenum, potassium, sodium, and strontium. The box plots from the earlier ASD investigation (EHS Support, 2019a) also show a difference between well MW-1603, BSFAP water, and/or the regional background for pH, alkalinity, barium, cobalt, lead, lithium, magnesium, selenium, and sulfate. No background values were provided by the USGS for beryllium, chromium, lead, lithium, molybdenum, and selenium. Updated box and whisker plots for constituents reported in MW-1603 groundwater are provided in Appendix A. Plots for pH, fluoride, and cobalt exhibit outliers which are calculated to be outside the range of distribution (refer to Figure A-8, Figure A-4, and Figure A-10 of Appendix A, respectively). It is likely that the acidic pH conditions identified at MW-1603, relative to regional background, are driving the observed SSLs. The geochemical conditions within well MW-1603, including a strongly acidic pH, low alkalinity, and high sulfate, are indicative of conditions similar to those observed at acid mine drainage sites. At MW-1603, the geochemical conditions have developed due to the presence of the sulfide-bearing Princess coal seams being intersected by the screened interval of the monitoring well (discussed in EHS Support, 2019a). The combination of the well installation and effects of well sampling have resulted in development of aerobic and water-saturated conditions within the coal seams. These conditions have led to a lowering of the pH through oxidation of sulfides present in the coal which has subsequently enhanced rock dissolution. Enhanced host rock dissolution at MW-1603 is evident from the much higher total dissolved solids (TDS) values at this location in comparison to groundwater samples from the other Site wells, including water from the BSFAP. In addition to an abundance of sulfides, rock and coal samples from the Princess Formation in Kentucky have been shown to contain parts per million (ppm) levels of beryllium, cobalt, and lithium (Hood et al., 2020), thereby, providing a viable source for the observed SSLs. For context, studies have demonstrated that the pH of groundwater in contact with fly ash is maintained alkaline (pH 7 to 10) for decades due to buffering by reactions with carbonates and amorphous aluminum silicates in the fly ash (Twardowska et al., 2003). The BSFAP water is consistent with this range, with a pH of 7.97. Consequently, the acidic pH of groundwater identified at MW-1603 is compelling evidence that groundwater at this location has not mixed with and is not representative of water from the BSFAP. 4.3 Tier II Evaluation - Geochemical Evaluation A simple analysis of primary and potential indicator constituents (as performed in Section 4.1) may not provide the lines of evidence required for a robust ASD investigation. It is recognized that naturally occurring indicator constituents and upgradient sources may have an additional influence on groundwater quality. Spatially across a Site, groundwater quality may be observed to change due to chemical interactions with the aquifer matrix. EPRI (2012) recommended the use of more sophisticated methods for multiple parameters over multiple locations, such as ion ratios and ternary plots. 4.3.1 Ion Ratios The development of ion ratios involves first selecting two non-competing, non-sorbing constituents (boron and chloride). The ratios of these constituents are then compared spatially across the Site and a EHS Support LLC 17
Alternative Source Demonstration Addendum Report for the October 2020 Monitoring Data
Big Sandy Fly Ash Pond
Alternative Source Demonstration Assessment
judgment is made as to whether the hydraulically downgradient groundwater is similar to the
background groundwater quality.
The calculation of ion ratios was conducted using median concentrations of the indicator species. The
median concentrations of boron, chloride, and sulfate over the monitoring period (September 2016
through October 2020) are provided in Table 4-1. These three constituents were selected based on the
EPRI (2017) recommended indicator species. Whereas bromide is also a recommended indicator species,
it was not included in the assessment as it was non-detect in the BSFAP water, indicating its presence in
groundwater was either naturally derived or from an off-site source. The median concentrations for
sulfate, boron, and chloride show minimal change since January 2019.
Table 4-1 Median Concentrations of Boron, Chloride, and Sulfate
Median Concentrations September 2016 to October 2020
Location Location ID Boron (mg/L) Chloride (mg/L) Sulfate (mg/L)
Source Fly Ash Pond 0.58 35.4 342
Downgradient MW-1603 0.052 ±0.026 3.41 ±0.47 714 ±65
mg/L = milligrams per liter
Ion ratios have been calculated using boron, chloride, and sulfate as recommended in EPRI (2017) and
are provided in Table 4-2. The ion ratios show little change since the last evaluation in January 2021.
Table 4-2 Ion Ratios
Median Concentrations September 2016 to October 2020
Location Location ID Boron/Sulfate Boron/Chloride Chloride/Sulfate
(x1000)
Source Fly Ash Pond 1.68 0.002 0.10
Downgradient MW-1603 0.07 ±0.03 0.02 ±0.01 0.005 ±0.001
Based on the previous and current ion ratio analysis, the conclusion that MW-1603 is not impacted by
CCR constituents from the BSFAP is unchanged.
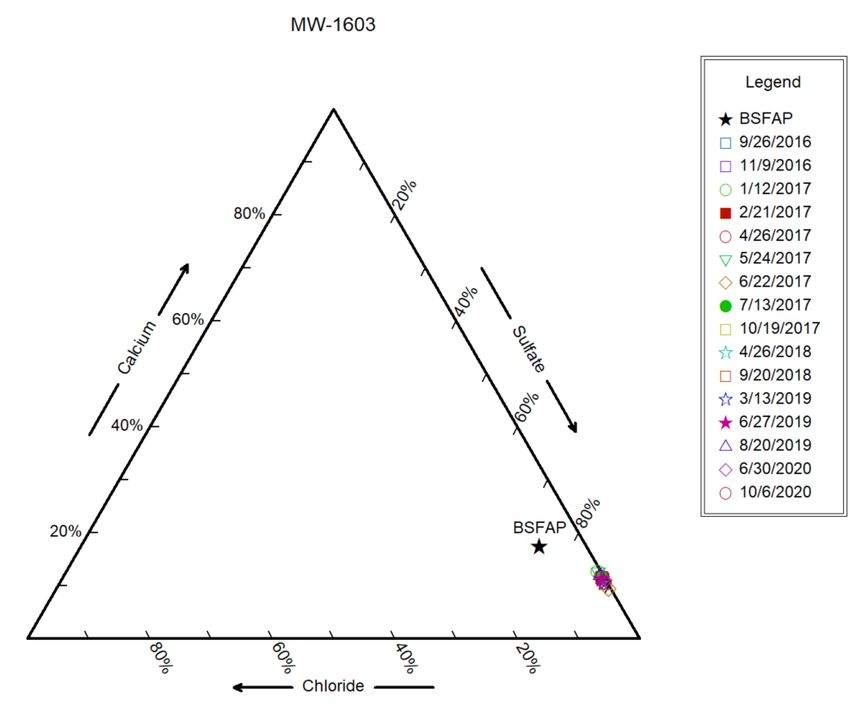
4.3.2 Ternary Plots
Ternary plots are used to identify changes in major or minor ion distributions over time. A ternary plot
using calcium, chloride, and sulfate measured in the vicinity of MW-1603 is provided in Figure 4-13. The
close grouping of ratios from all events on the ternary plot shows that the major ion groundwater ratios
have not changed during the three-year period of groundwater quality monitoring at well MW-1603 and
that the ratios are distinct from the BSFAP.
EHS Support LLC 18Alternative Source Demonstration Addendum Report for the October 2020 Monitoring Data
Big Sandy Fly Ash Pond
Alternative Source Demonstration Assessment
Figure 4-13 Ternary Plot MW-1603
4.3.3 Summary
In summary, based on the previous geochemical evaluation and the updated review presented in this
ASD investigation, there is insufficient evidence to support the presence of CCR constituents (beryllium,
cobalt, and lithium), as derived from the BSFAP, in groundwater sampled at MW-1603. The ternary plot
does not support temporal changes of MW-1603 groundwater quality. The boron, chloride, and sulfate
ion ratios remain unchanged since September 2019. Therefore, it is unlikely that beryllium, cobalt, and
lithium detected within MW-1603 groundwater are sourced from the BSFAP. It is likely that beryllium,
cobalt, and lithium are sourced from the lithologies in which this monitoring well is screened across,
which includes the Princess coal seams.
EHS Support LLC 19Alternative Source Demonstration Addendum Report for the October 2020 Monitoring Data Big Sandy Fly Ash Pond Summary and Conclusions 5 Summary and Conclusions Using the EPRI (2017) guidance for ASD investigations, the conclusions based on the lines of evidence presented and discussed within Sections 3 and 4 indicate that groundwater in the vicinity of the BSFAP is not being impacted by CCR constituents from the BSFAP. The elevated beryllium, cobalt, and lithium concentrations that triggered the ASD investigation are due to the oxidation of sulfide minerals present in coal seams that have been intersected by well MW-1603, including organic material within the screened interval that is identified as having “a slight coaly texture.” This is supported by the visual evidence recorded during the logging of the core from this location (refer to EHS Support, 2019a), the low pH reported in groundwater, and the subsequent mobilization and leaching of trace metals (beryllium, cobalt, and lithium) into groundwater by the elevated acidity. The elevated pH in the BSFAP water and the corresponding lower concentrations of minor ions in the BSFAP also support the unlikely influence of the BSFAP on groundwater. Therefore, it is concluded that the elevated signatures of beryllium, cobalt, and lithium in MW-1603, as noted in the October 2020 groundwater monitoring data, are related to the dissolution of naturally occurring, coal seam-derived constituents within the shale layers of the Breathitt Group, as supported by the discussion of local and regional geology in Section 2.1 and EHS Support (2019a). In conclusion, this ASD addendum for the BSFAP has determined that Type IV natural variations in groundwater resulted in SSLs of beryllium, cobalt, and lithium detected at MW-1603. EHS Support LLC 20
Alternative Source Demonstration Addendum Report for the October 2020 Monitoring Data
Big Sandy Fly Ash Pond
References

6 References
AEP and EHS Support. (2016). Groundwater Sampling and Analysis Plan. October.

EHS Support. (2019a). Alternative Source Demonstration Report for Beryllium, Cobalt and Lithium, Big
       Sandy Fly Ash Pond, Louisa, Kentucky. February.

EHS Support. (2019b). Alternative Source Demonstration Addendum Report for Beryllium, Cobalt and
       Lithium, Big Sandy Fly Ash Pond, Louisa, Kentucky. September.

EHS Support. (2020). Alternative Source Demonstration Addendum Report for 2019 Monitoring Data,
       Big Sandy Fly Ash Pond, Louisa, Kentucky. January.

EHS Support. (2021). Alternative Source Demonstration Addendum Report for the March and June 2020
       Monitoring Data, Big Sandy Fly Ash Pond, Louisa, Kentucky. January.

EPRI. (2012). Groundwater Quality Signatures for Assessing Potential Impacts from Coal Combustion
        Product Leachate. EPRI, Palo Alto, CA. 1017923.

EPRI. (2017). Guidelines for Development of Alternative Source Demonstrations at Coal Combustion
        Residual Sites. EPRI, Palo Alto, CA. 3002010920.

Geosyntec Consultants, Inc. (2016). Groundwater Monitoring Well Installation Report – Fly Ash Pond.
       October.

Geosyntec Consultants, Inc. (2017). Statistical Analysis Plan. January.

Hood, M.M., Eble, C.F., Hower, J.C. and Dai, S. (2020). Geochemistry, petrology, and palynology of the
       Princess No. 3 coal, Greenup County, Kentucky. International Journal of Coal Science &
       Technology, pp.1-19.

Rice, C. and Hiett, J. (1994). Revised Correlation Chart of the Coal Beds, Coal Zones, and Key
         Stratigraphic Units in the Pennsylvanian Rocks of Eastern Kentucky, USGS Miscellaneous Field
         Studies Map MF-2275.

Ruppert, L., Tewalt, S., Wallack, R., Bragg, L., Brezinski, D., Carlton, R., Butler, D., and Calef, F. (2000). A
       Digital Resource Model of the Middle Pennsylvanian Upper Freeport Coal Bed Allegheny Group,
       Northern Appalachian Basin Coal Region. USGS Professional Paper 1625-C. 101 pages.

Twardowska, I., Szczepanska, J. and Stefaniak, S. (2003). Occurrence and mobilization potential of trace
      elements from disposed coal combustion fly ash. In Chemistry of Trace Elements in Fly Ash (pp.
      13-24). Springer, Boston, MA.

USEPA. (2009). Statistical Analysis of Groundwater Monitoring Data at RCRA Facilities, Unified Guidance.
       March.

EHS Support LLC                                                                                               21
Alternative Source Demonstration Addendum Report for the October 2020 Monitoring Data
Big Sandy Fly Ash Pond
Tables
EHS Support LLCTable 1
MW‐1603 Historical Groundwater Data September 2016 to October 2020
Big Sandy Fly Ash Pond Groundwater Monitoring,
American Electric Power, Kentucky Power Company, Louisa, Kentucky
Analytes Units 9/26/2016 11/9/2016 1/12/2017 2/21/2017 4/26/2017 5/24/2017 6/22/2017 7/13/2017 10/19/2017 1/31/2018 4/26/2018 9/20/2018 10/23/2018 3/13/2019 6/27/2019 8/20/2019 3/17/2020 6/30/2020 8/26/2020 10/6/2020
Antimony, Sb µg/L 0.01 J < 0.01 < 0.01 < 0.01 0.01 J < 0.01 < 0.01 < 0.01 NA NA 0.04 J 0.02 J NA < 0.2 < 0.04 < 0.1 < 0.02 < 0.04 NA < 0.02
Arsenic, As µg/L 1.51 1.19 1.4 1.26 1.3 1.34 1.29 0.89 NA NA 1.6 1.4 NA 1.26 1.36 1.39 0.83 1.12 NA 1.12
Barium, Ba µg/L 13.4 15.4 11.4 10.3 12.4 11.5 11.4 11.3 NA NA 10.5 11.4 NA 12 11 13.6 9.92 12.2 NA 14.6
Beryllium, Be µg/L 18.6 18.3 17.1 18.9 16.7 16.4 16.4 18 NA NA 18.7 19.6 NA 24.4 21.8 25 16.4 21.1 NA 17.5
Boron, B mg/L 0.054 0.053 0.037 0.085 0.052 0.096 0.051 0.039 < 0.002 NA 0.088 0.085 NA 0.05 J 0.05 J < 0.1 < 0.1 0.05 J NA 0.05
Bromide mg/L < 0.05 < 0.05 < 0.05 < 0.05 < 0.05 0.06 J < 0.05 < 0.05 < 0.05 NA < 0.05 < 0.1 NA < 0.1 < 0.04 < 0.04 < 0.04 < 0.04 NA < 0.04
Cadmium, Cd µg/L 0.84 0.93 0.79 0.75 0.87 0.77 0.86 0.8 NA NA 0.74 0.83 NA 0.78 0.7 0.89 0.64 0.85 NA 0.87
Calcium, Ca mg/L 105 94.7 92.7 91.9 90.5 93.9 90.6 90.2 91 82.2 83.6 97.5 NA 84.6 83.3 95.8 NA 96.6 NA 94.5
Chloride, Cl mg/L 3.37 3.22 3.45 2.93 3.28 3.34 3.1 3.32 3.24 NA 4.12 3.92 NA 4.42 4.13 3.93 NA 4.18 NA 4.1
Chromium, Cr µg/L 1.1 1.12 0.731 0.771 0.829 0.62 0.821 0.485 NA NA 0.771 0.713 NA 1 J 0.618 0.8 0.56 0.694 NA 0.743
Cobalt, Co µg/L 101 94.4 89.6 93.2 97.1 85.3 92.4 92.5 NA NA 91.1 93.8 NA 87.9 84.7 96.6 72 93.2 NA 90.5
Comb. Radium 226/228 pCi/L 6.04 6.6 5.86 4.03 5.72 6.4 6 6.36 NA NA 5.09 6.75 NA 4.8 7.149 10.92 7.19 6.22 NA 2.681
Fluoride, F mg/L 1.24 1.1 1.11 0.9 1.04 0.98 0.98 0.93 0.93 0.94 1.16 1.15 NA 0.92 0.87 0.84 0.85 0.71 NA 0.47
Lead, Pb µg/L 9.75 8.18 6.11 6.3 6.41 4.96 6.47 3.72 NA NA 5.27 4.39 NA 4.28 3.68 4.17 3.95 4.67 NA 4.85
Lithium, Li mg/L 0.242 0.237 0.225 0.208 0.216 0.221 0.263 0.217 NA NA 0.187 0.255 NA 0.209 0.192 0.226 0.156 0.192 NA 0.165
Mercury, Hg µg/L < 0.002 < 0.002 < 0.002 < 0.002 0.002 J < 0.002 < 0.002 < 0.002 NA NA < 0.002 NA < 0.002 < 0.002 < 0.002 < 0.002 < 0.002 < 0.002 NA < 0.002
Molybdenum, Mo µg/L 0.15 0.17 0.06 J 0.11 0.18 0.07 J 0.32 0.22 NA NA 0.03 J 0.04 J NAAlternative Source Demonstration Addendum Report for the October 2020 Monitoring Data
Big Sandy Fly Ash Pond
Figures
EHS Support LLC³
Blaine Creek
MW-1607 Valley
MW-1606
!
U MW-1604
!
U
!
U
MW-1602
MW-1601!
U U MW-1611
@
!
A
Horseford
Creek Valley
Main Dam
MW-1605
!
U
MW-1203
!
U
Fly Ash Pond MW-1603
!
U
Saddle Dam
MW-1011 U MW-1608
!
@
A
SITE LAYOUT
!
U FLY ASH POND
MW-1012 AEP BIG SANDY PLANT
Legend LOUISA, KENTUCKY
!
U Monitoring Well (Sampling)
Monitoring Well (Water Level Measurement Only) 0 350 700
So 2,800
s, CNE FIGURE 1
@
A
User Community FeetBla
ine
Cre
ek
MW-1601!
U
MW-1606
!
U
MW-1607
!
U
MW-1602
U MW-1611
@
!
A
MW-1604
!
U
Bl
ain
³
eC
re
ek
MW-1605
!
U
MW-1203
!
U
C r eek MW-1603
e ford !
U
rs
Ho
MW-1011 U MW-1608
!
@
A Ho
rs
ef
or
d
Cr
eek
GROUNDWATER MONITORING WELL LOCATIONS
Legend
!
U Monitoring Well (Sampling) !
U FLY ASH POND
MW-1012 AEP BIG SANDY PLANT
@
A Monitoring Well (Water Level Measurement Only)
LOUISA, KENTUCKY
Background Groundwater Monitoring Location
0 350 700
So 2,800
s, CNE FIGURE 2
Compliance Groundwater Monitoring Location
User Community FeetAlternative Source Demonstration Addendum Report for the October 2020 Monitoring Data
Big Sandy Fly Ash Pond
Appendix A Box Plots
EHS Support LLCAlternative Source Demonstration Addendum Report for the October 2020 Monitoring Data
Big Sandy Fly Ash Pond
Figure A-1 Boron Box Plot
Figure A-2 Sulfate Box Plot
EHS Support LLC
1Alternative Source Demonstration Addendum Report for the October 2020 Monitoring Data
Big Sandy Fly Ash Pond
Figure A-3 Chloride Box Plot
Figure A-4 Fluoride Box Plot
EHS Support LLC
2Alternative Source Demonstration Addendum Report for the October 2020 Monitoring Data
Big Sandy Fly Ash Pond
Figure A-5 Molybdenum Box Plot
Figure A-6 Potassium Box Plot
EHS Support LLC
3Alternative Source Demonstration Addendum Report for the October 2020 Monitoring Data
Big Sandy Fly Ash Pond
Figure A-7 Sodium Box Plot
Figure A-8 pH Box Plot
EHS Support LLC
4Alternative Source Demonstration Addendum Report for the October 2020 Monitoring Data
Big Sandy Fly Ash Pond
Figure A-9 Beryllium Box Plot
Figure A-10 Cobalt Box Plot
EHS Support LLC
5Alternative Source Demonstration Addendum Report for the October 2020 Monitoring Data
Big Sandy Fly Ash Pond
Figure A-11 Lithium Box Plot
EHS Support LLC
6You can also read