Best Western - Azle, TX - Market Study for the Proposed
←
→
Page content transcription
If your browser does not render page correctly, please read the page content below
Market Study for the Proposed
Best Western - Azle, TX

Prepared for:
City of Azle

June 27, 2016
June 27, 2016

Karen Dickson, CEcD
Economic Development Director
City of Azle
613 SE Parkway
Azle, TX 76020

Dear Mrs. Dickson

We have completed our analysis of the hotel market in Azle, Texas, and the
proposed development of a Best Western Hotel. The conclusions reached are based
upon our present knowledge of the competitive market area resulting from our
fieldwork completed May 3, 2016.

As in all studies of this type, the estimated results are based upon competent and
efficient management and presume no significant change in the competitive
position of the hotels from that as set forth in this report. The terms of our
engagement are such that we have no obligation to revise this report to reflect
events or conditions that occur subsequent to the date of the completion of our
fieldwork.

The estimates of property performance are based on an evaluation of the present
general level of the area's economy and make no provision for the effect of any
sharp rise or decline in local or general economic conditions.

In summary, it is our opinion that there is market justification for developing the
subject hotel as a Best Western with 65 guestrooms as described in this report. Our
conclusions are summarized as follows:

                              Performance Summary
                                       2018         2019         2020
         Units                          65            65           65
         Stabilized Occupancy          62%           66%          68%
         Average Daily Rate          $99.75        $104.75      $110.00
         Rooms Revenue              $1,467,000    $1,640,000   $1,774,000
         Net Operating Income         $427,000      $514,000     $575,000
City of Azle                                                              June 27, 2016
Proposed Best Western Hotel                                                      Page 2

Economic Summary of Market
Azle, Texas, is located 16 miles northwest of downtown Fort Worth, and lies in both
northwest of Tarrant County and northeast Parker County. As of 2013, the city
population was 11,334. The leading economic driver for Azle is greater Fort Worth,
which serves as the county seat for Tarrant County. In 2015, Tarrant County had a
population of 1,929,034 with a median household income of $56,178, which is
more than the state average of $50,920.

Downtown Fort Worth is recognized as one of the cleanest, safest, and more
walkable urban areas in the nation and is known for its historic buildings that co-
exist with towering modern skyscrapers. The center of downtown, known as
Sundance Square, comprises 35 square blocks of entertainment, restaurants, bars,
shops, art galleries, and performance venues. City leaders have won numerous
national awards for its successful revitalization.

Also located in downtown is the Fort Worth Convention Center, which offers
250,000 square feet of exhibit space, 60,000 square feet of meeting space and a
28,160-square foot ballroom. There is also an 11,200-seat multi-purpose arena.
The facility hosts approximately 100 major events each year, which include
association meetings with trade shows, consumer exhibitions, concerts, and
graduations.

Greater Fort Worth
Meacham International Airport is the hub for corporate business and general
aviation, located five miles from downtown Fort Worth and 11 miles from Azle.
The airport offers high-quality facilities, such as three full-service fixed based
operators (FBOs), aircraft maintenance facilities, flight schools, and on-site car rental
facilities.

Texas Motor Speedway (TMS) is located in Fort Worth, 30 miles northeast of Azle.
It is a 1.5-mile tri-oval track and is one of NASCAR’s largest facilities. Texas Motor
Speedway hosts two events each year, which are routinely the largest sporting
events in Texas with an average attendance of approximately 138,000. Many of the
hotels in the competitive set receive overflow from event held at TMS.

Fort Worth Alliance Airport is a global hub for cargo, corporate, and military
aviation, and is the cornerstone for one of the nation’s faster-growing industrial
complexes. The Alliance Airport is located 14 miles north of downtown Fort Worth
and 22 miles northeast of Azle.

AT&T Stadium is 16 miles southeast of downtown Fort Worth and serves as the
home of the National Football League’s Dallas Cowboys. The Cowboys football
games draw more than 85,000 fans to each home game.
City of Azle                                                             June 27, 2016
Proposed Best Western Hotel                                                     Page 3

Major Employers
Fort Worth area has many companies in the aeronautics industry, such as American
Airlines, Lockheed Martin, and Bell Helicopter. One of the largest employers in Fort
Worth is American Airlines, owned by AMR Corporation, which employs
approximately 22,170. Fort Worth’s largest employers are listed in the following
table.

While population drives the development of restaurants and retail establishments
that are excellent amenities for hotels, employment drives a significant portion of
the demand for hotels. The following list contains the 10 largest private sector
employers for the Fort Worth area, each of which drives hotel demand in varying
degrees.

                           Top 10 Employers - Fort Worth, TX
 Company                                Industry / Product                 Employees
 AMR/American Airlines                  Air Carrier                            22,169
 Lockheed Martin                        Aerospace Services                     14,988
 NAS Fort Worth JRB                     Navy Reserve                           11,350
 JPS Health Network                     Healthcare Service Provider             4,872
 Cook Children's Health Care System     Acute-care Hospital Operator            4,826
 Texas Health Harris Methodist Hospital Hospital                                3,968
 Bell Helicopter Textron                Rotorcraft Manufacturer                 3,820
 Fidelity                               Investment Service                      3,700
 Alcon Laboratories                     Pharmaceutical Research                 3,346
 Genco ATC                              Logistics Provider                      3,315
 Source: Chamber of Commerce Fort Worth

While mostly seasonal jobs, the entertainment industry represents a significant
source of employment for Tarrant County. Examples include, Six Flags Over Texas,
which also operates Hurricane Harbor. The Texas Rangers Baseball Stadium and
the Dallas Cowboys Stadium also employ a significant number of people. While
these facilities generate significant amounts of hotel demand, it is more the result of
their attendance than their total employment.

While much has been said about the high rates of unemployment nationally, it is
important to note that the unemployment rates are lower in the Dallas Fort worth
MSA than the national average as seen in the following table. Many economists
believe Texas and the Dallas Fort Worth MSA will continue to lead the country with
lower unemployment and in-migration from other states.

                                       Unemployment Rate
                                             2013         2014    2015
                             USA              7.5          6.3     5.5
                             Texas            6.4          5.1     4.3
                             DFW MSA          6.2          4.7     3.8
                             Source: Buerau of Labor Statistics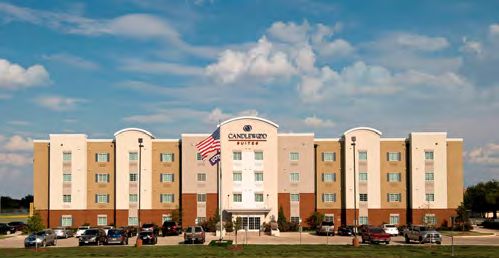
City of Azle June 27, 2016
Proposed Best Western Hotel Page 4
Project Description
Site
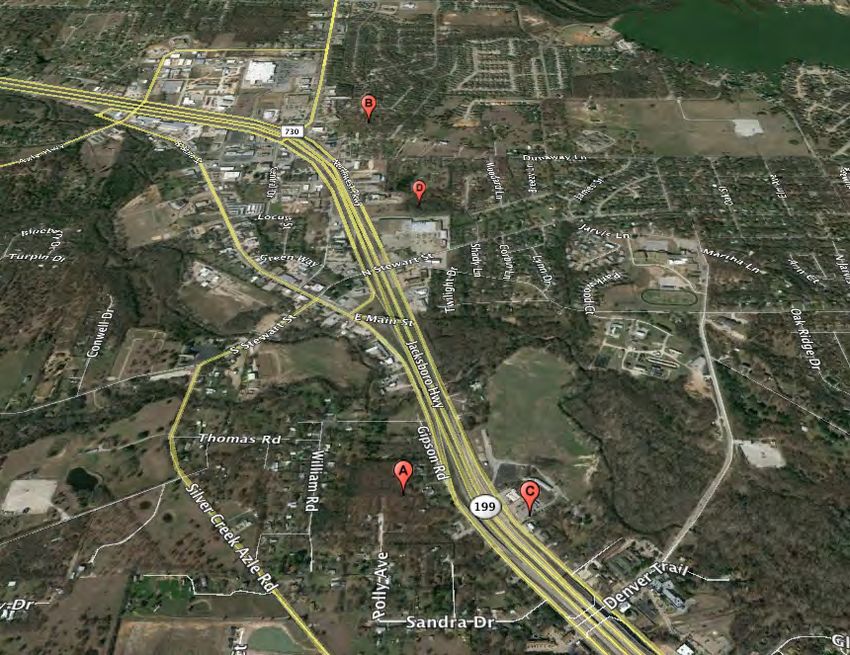
We inspected several sites that could potentially be developed with a hotel. They
are listed in the following table and identified on the following locator map. It has
been our observation that good hotel sites meet the following criteria:
1. Have good visibility from routes frequently traveled by those from out of
town. In the case of Azle, freeway visibility is very important.
2. Not only do travelers need to be able to see the site, they must also be able
to access it with minimal effort.
3. The site must also have the necessary infrastructure to support the hotel such
as water supply, sanitary sewer, 3-phase electricity, and Internet access. If
these are not available to the site, additional costs will be incurred by the
developer.
4. Zoned for intended use.
5. Have stable soil.
6. Have complimentary developments such as food service and entertainment.
7. Have sufficient developable area, in this case +/- 2.0 acres, so as to allow for
parking commercial trucks, recreational vehicles, and trucks pulling
equipment trailers.
Perspective Hotel Sites
Assesed Value
Site Description Acres Per Acre Total
A 512 Southeast Pkwy 2.58 $58,140 $150,000
B Boyd Ct & Inwood Rd 8.86 $76,185 $675,000
C City Hall N/A N/A N/A
D Northwest Pkwy 8.36 $108,900 $910,404
All the perspective hotel sites have good freeway visibility, city water and sewer,
however, Site B does not have a freeway frontage although it has good retail and
good restaurant amenity support.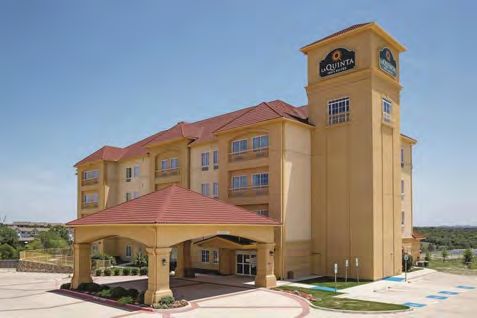
City of Azle                                                            June 27, 2016
Proposed Best Western Hotel                                                    Page 5

       The Project
Our recommendation is a three-story Best Western hotel with 65 rooms and interior
corridors. The hotel should have contemporary finishes that will be attractive to
today’s business and leisure travelers. There should be a balanced mix of room
types including single kings and double queens. Consistent with the brand’s
standards, the guestrooms should have quality bedding and décor.

The hotel should offer a complimentary continental breakfast, free local calls, and
free Internet access with enough bandwidth to drive as many as four devices per
guestroom. As leisure demand will represent a significant source of demand in this
market, we also recommend the hotel have an outdoor pool and splash pad, and
separate fire pit gathering area for adults. In anticipation of guests trailering boats
to Eagle Mountain Lake, the site should have ample trailer parking.

We recommend the hotel have a reception facility that is large enough to hold
approximately 100 people for a banquet reception. As this will likely be the only
hotel-served meeting space in Azle, this meeting room will likely be used for
midweek business meetings seating as many as 80 people in a classroom
configuration. The meeting facility therefore should be divisible in half for greater
flexibility. The facility should also have a pre-function area, restrooms, and a
catering prep kitchen. We anticipate local caterers will contract with the hotel for
food and beverage service.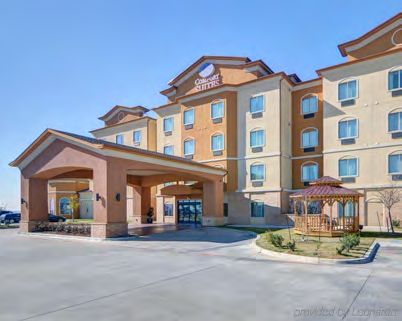
City of Azle June 27, 2016
Proposed Best Western Hotel Page 6
Competitive Supply
The northwest Fort Worth hotel market contains 38 hotels with 3,336 guestrooms of
varying quality. Of those hotels, we defined the competitive set as nationally
branded hotels that generally achieved an ADR above $80, which is consistent with
CBRE Hotels’ description of the upper-priced segment. By using this criterion, we
excluded all budget branded and low quality independent hotels (lower-priced
segment) as the guests they attract seek lower prices than what will likely be offered
at the subject hotel.
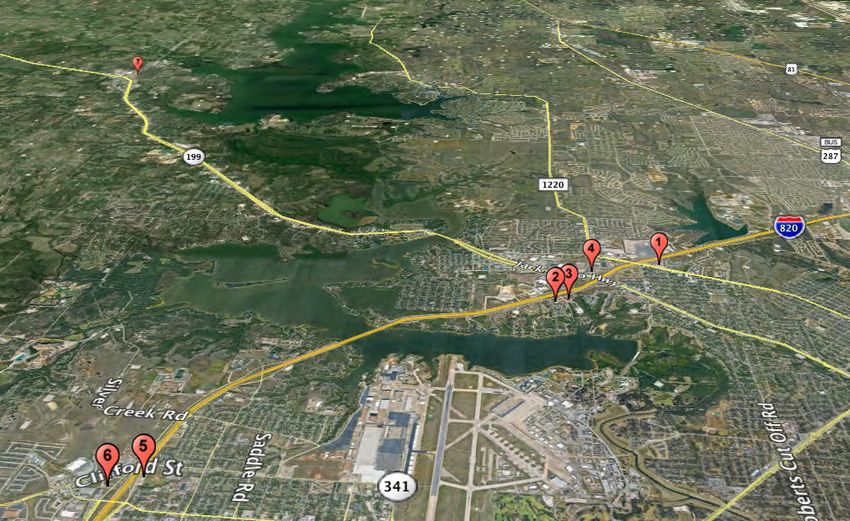
Based on location, the subject hotel will compete primarily with the hotels on Loop
820. The primary competitors are listed in the following table, followed by a
satellite locator map.
SUMMARY OF COMPETITIVE HOTELS
Azle, Texas
Miles from
Properties Rooms Year Opened Corridors
Subject
Competitive Set Hotels
1 Holiday Inn Express & Suites Lake Worth NW Loop 820 69 2005 Limited-Service 11.0
2 Comfort Suites at Lake Worth 68 2012 Limited-Service 11.0
3 La Quinta Inn & Suites Fort Worth - Lake Worth 71 2009 Limited-Service 11.0
4 Best Western Plus Lake Worth Inn & Suites 50 2002 Limited-Service 10.5
5 Candlewood Suites Fort Worth/West 80 2011 Extended-Stay 15.3
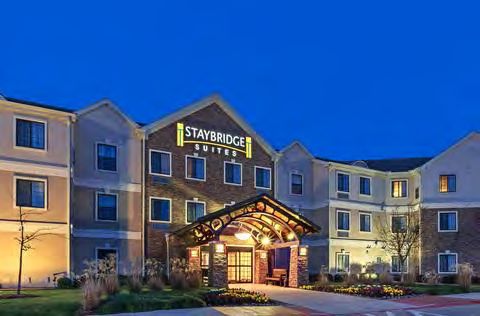
6 Staybridge Suites Fort Worth/West 86 2009 Extended-Stay 15.3
7 Econo Lodge 39 2006 Economy 0.2
Total Hotel Rooms - 2015 463
New Hotels
A Subject - Best Western 65 2018 Limited-Service --
Total Hotel Rooms 528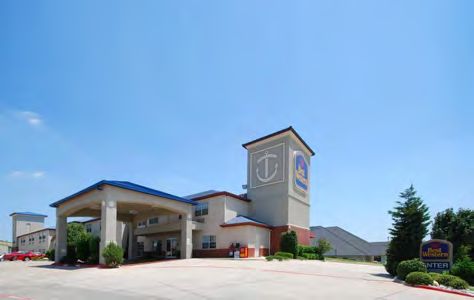
City of Azle                                                          June 27, 2016
Proposed Best Western Hotel                                                  Page 7

The primary competitors along Loop 820 include four limited-service hotels and
two extended-stays with 424 guestrooms. This is a fairly young market where 30%
of the guestrooms are less than 5 years old. The oldest hotel is the 14-year old Best
Western Plus Lake Worth Inn & Suites, but it appear to have received a significant
renovation.

The Holiday Inn Express & Suites Lake Worth NW Loop 820 is the first hotel
travelers would see when they travel to the area. This property opened in 2005
with 69 guestrooms. It appears dated by today’s standard, and will likely need a
renovation.

The 68-room Comfort Suites Lake Worth is the newest hotel in the competitive set,
which opened in 2012. Across the street from the Comfort Suites, it is the 71-room
La Quinta Inn and Suites Fort Worth-Lake Worth. Both hotels have several
restaurants and retail options nearby, and they both offer free Internet and
complimentary breakfast to their guests. The ADR in Comfort Suites is higher due to
its newer condition.
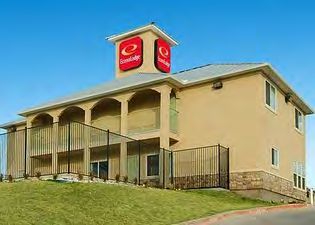
City of Azle                                                         June 27, 2016
Proposed Best Western Hotel                                                 Page 8

Same as the Holiday Inn Express, the 80-unit Candlewood Suites Fort Worth/West
and the Staybridge Suites Fort Worth/West share the same reservation system with
InterContinental Hotel Group. The Staybridge is the largest hotel in the competitive
set, which has 86 units. This hotel is the market leader in terms of ADR and
Occupancy. Some of its success in the market is attributable to its being the
extended-stay hotel in the market. Guests staying more than one week are staying
on the weekends, which are slower in this market on average. Unlike the
Staybridge Suites, the Candlewood Suites does not offer complimentary breakfast,
but guests could check out DVDs at the front desk.

The 50-room Best Western Plus Lake Worth Inn & Suites is the oldest hotel in the
competitive set, which opened in 2002. The hotel has been renovated with a
modern look décor. The Econo Lodge is the only hotel in Azle, and it is the smallest
hotel in the competitive set with 36 guestrooms. The hotel is a two-story exterior
corridor building, and it looks dated. This hotel performs below the market average
in terms of ADR (below $50) and Occupancy (below 60%) due to its economy
orientation.

Sources of Market Demand
Through our research of the competitive set and interviews of hotel operators in the
market, we were able to develop the following analysis that quantifies the primary
sources of demand for the competitive hotels.
City of Azle                                                              June 27, 2016
Proposed Best Western Hotel                                                      Page 9

                      Market Mix - Annual Room Nights of Demand
               Demand Segments              Room Nights           % Mix
                IBT                              70,400            62%
                Group                              3,700            3%
                Leisure                           39,700           35%
               Total Occupied Room Nights       113,800           100%

The hotels we analyzed classified most of their demand as Individual Business
Travelers (IBT), representing approximately 62% of the market demand for the
competitive hotels. As mentioned previously, IBT demand is generated when
corporate employees and engineers, sales people and consultants, visit area
companies, or when area companies bring employees in for meetings.

Leisure demand for the competitive set represents approximately 35% of
competitive hotels. Leisure demand is strongest during the summer, and weekends
during the spring and fall, including all other reasons for travel such as visiting
friends and family or attending a social function. Eagle Mountain Lake also provides
a source of leisure demand.

Group and Convention demand in this market consists primarily of small corporate
meetings during the week and social events on the weekends. Corporate meetings
primarily consist of training and planning. Most of the hotels only have a small
amount of meeting space. Therefore, the hotels with little meeting space typically
host social groups that will also use other meeting venues such as area churches.
We estimate Group demand to comprise only 3% of the overall demand.

Competitive Set Historical Performance
DPC assembled occupancy and ADR information for each competitor for year-end
2011 through year-end 2015 and derived estimated levels of total supply and
demand expressed as room nights per year.

The following table summarizes the historical performance of the Competitive Set.
The additions to supply during the five-year study period have been the opening of
the Candlewood Suites in 2011 and the Comfort Suites in 2012. When expressed
as a compound average over five years, supply increased at 5.2% per year. By
comparison, demand increased at a rate of 8.1% per year. Much of this increase
can be attributed to the ongoing recovery from the national recession of 2008, but it
is also indicative of the strength of the Texas economy. Demand outpacing supply
has caused occupancy to increase from a low of 60.1% in 2011 to a high of 67.2%
in 2015.
City of Azle June 27, 2016
Proposed Best Western Hotel Page 10
HISTORICAL MARKET CONDITIONS - ANNUAL ROOM NIGHTS
Lake Worth, White Oak, Azle
2011 2012 2013 2014 2015 CAC*
Supply - Guestrooms 382 410 467 467 467
Supply - Annual Rooms Nights (x 365) 139,430 149,650 170,455 170,455 170,455 5.2%
Demand
IBT 52,000 59,900 68,900 71,500 70,900 8.1%
Group 2,700 2,900 3,600 3,900 3,700 8.2%
Leisure 29,100 33,700 38,900 40,000 40,000 8.3%
Total Occupied Room Nights 83,800 96,500 111,400 115,400 114,600 8.1%
Occupancy 60.1% 64.5% 65.4% 67.7% 67.2%
Average Daily Rate $81.40 $81.15 $80.39 $85.80 $88.82 2.2%
Revenue per Available Room $48.92 $52.33 $52.54 $58.09 $59.72 5.1%
Change in Supply -- 7.3% 13.9% 0.0% 0.0%
Change in Demand -- 15.2% 15.4% 3.6% -0.7%
*Compounded annual change
ADR increased from a low of $81.40 in 2011 to a high of $88.82 in 2015, for a total
increase of 9.1%. As the market occupancy reached the high 60’s in 2015, hotels
were filling mid-week and allowing hotel managers to push rate increases above
$88, which represents a growth rate of 2.2% per year since 2011. Future increases
are anticipated as the economy continues to expand.
Future Estimated Market Supply and Demand
Our analysis of future supply is based on the addition of the subject hotel with 65
rooms opening in 2018. After the new hotel open, the market will grow to a total of
532 rooms. Expressed as a five-year average, the market will grow at 2.6% per year.
We estimated the future growth rates for demand with the following analysis.
Increases to base demand are stated in compound average growth rates and reflect
the external changes in the market if no other hotels were built. Conversely,
increases to created demand are derived by whole numbers and account for the
room nights that are sold to guests that are no longer displaced from the market. In
addition, created demand includes new groups that come to the market because of
the meeting space being built within the subject hotels.
In terms of changes to the level of base demand, we have accounted for continued
recovery from the national recession by applying a 2.0% per year increase in
demand for IBT, Leisure and Group. With respect to created demand, we see 25%
of the room night inventory as being created by the new supply when they
accommodate guests that no longer have to leave the market during peak periods.
Most of the created demand will come from IBT (40%) and Leisure (20%), and the
rest will be Group. These assumptions calculate a combined growth rate of 3.0%
per year from 2015 to 2020. The resulting analysis shows occupancy growing to
the higher 60%’s until the new supply opens in 2018 and decreases as a result of
the new supply. Thereafter, occupancy will grow and will once again stabilize in
the higher 60%’s.City of Azle June 27, 2016
Proposed Best Western Hotel Page 11
FUTURE MARKET CONDITIONS - ANNUAL ROOM NIGHTS
Lake Worth, White Oak, Azle
2015 2016 2017 2018 2019 2020 CAC*
Supply - Guestrooms 467 467 467 532 532 532
Supply - Annual Rooms Nights (x 365) 170,455 170,455 170,455 194,180 194,180 194,180 2.6%
Demand
Individual Business Traveler - Base 70,900 72,300 73,800 75,300 76,800 78,300 2.0%
Individual Business Traveler - Created -- - - 2,400 2,400 2,400 --
70,900 72,300 73,800 77,700 79,200 80,700 2.6%
Group/Convention - Base 3,700 3,800 3,900 3,900 4,000 4,100 2.1%
Group/Convention - Created -- - - 1,200 1,200 1,200 --
3,700 3,800 3,900 5,100 5,200 5,300 7.5%
Leisure - Base 40,000 40,800 41,600 42,400 43,300 44,200 2.0%
Leisure - Created -- - - 2,400 2,400 2,400 --
40,000 40,800 41,600 44,800 45,700 46,600 3.1%
Total Occupied Room Nights 114,600 116,900 119,300 127,600 130,100 132,600 3.0%
Occupancy 67.2% 68.6% 70.0% 65.7% 67.0% 68.3% --
Change in Supply 0.0% 0.0% 0.0% 13.9% 0.0% 0.0% --
Change in Demand -0.7% 2.0% 2.1% 7.0% 2.0% 1.9% --
*Compounded annual change
Estimated Penetration of the Proposed Hotel
Penetration analysis compares the occupied rooms from each competitor by market
segment and overall. A market penetration above 100% indicates a property is
getting more than its fair share. Likewise, penetration below 100% indicates below
average performance. A property can perform poorly in one segment, but achieve
high penetrations overall. We have performed this analysis on the market
competitors and identified some important trends in the following table. This is a
fairly competitive market where most competitors achieved similar occupancies and
penetration rates of 100%. The market leaders tend to be the newer hotels that
have reputations for providing good service and a clean product.
Penetration Rates of Competitive Set - 2015
Leisure Group IBT Overall
Primary Competitive Set
Holiday Inn Express & Suites Lake Worth NW Loop 820 90% 160% 110% 105%
Comfort Suites at Lake Worth 95% 145% 90% 95%
La Quinta Inn & Suites Fort Worth - Lake Worth 100% 155% 100% 100%
Best Western Plus Lake Worth Inn & Suites 115% 0% 95% 100%
Candlewood Suites Fort Worth/West 100% 0% 105% 100%
Staybridge Suites Fort Worth/West 90% 160% 110% 105%
Econo Lodge 125% 0% 70% 85%
Note: Percentages are rounded to nearest 5% to protect confidential information.
The proposed Best Western will have the following competitive advantages: the first
limited-service hotel in Azle, strong brand, and a good location. Because a portion
of its guests will be staying for social or family events, we estimate this hotel will
achieve slightly above its fair share overall, particularly in Leisure and Group
demand. Being the closest hotel to the Eagle Mountain Lake will also contribute to
above average Leisure demand for the subject hotel. Conversely, the subject hotel
will likely achieve less than its fair share in IBT because its competitors are closer toCity of Azle June 27, 2016
Proposed Best Western Hotel Page 12
the employment centers. The resulting overall penetration of the proposed hotel in
the stabilized year is calculated to be 99%, as shown in the following table.
Proposed Best Western - City of Azle - 65 Units
Estimated Estimated Average
Market Market Fair Market Share 1 Market Penetration 2 Occupancy Room Rate
Year Segment Demand Percent Demand Percent Demand Market Subject Constant $
2018 IBT 77,700 12.2% 9,500 90% 8,600 110.00
Group 5,100 12.2% 600 120% 700 95.00
Leisure 44,800 12.2% 5,500 100% 5,500 85.00
Total 127,600 15,600 95% 14,800 66% 62% 100.00
2019 IBT 79,200 12.2% 9,700 95% 9,200 110.00
Group 5,200 12.2% 600 120% 700 95.00
Leisure 45,700 12.2% 5,600 105% 5,900 85.00
Total 130,100 15,900 99% 15,800 67% 66% 100.00
2020 IBT 80,700 12.2% 9,800 95% 9,300 110.00
Group 5,300 12.2% 600 120% 700 95.00
Leisure 46,600 12.2% 5,700 105% 6,000 85.00
Total 132,600 16,100 99% 16,000 68% 68% 99.97
1
Fair Market Share = 65 Units (Subject) divided by 528 Rooms (in the Market in 2018) = 12.2%
2
Subject penetration into Market above 100% indicates Subject has competitive advantages.
In estimating Average Daily Rate (ADR), we gathered rack rates for each property of
the competitive sets, as shown in Exhibit A. We also collected individual ADR’s
and compared them to the market average for 2015. Based on our observations of
the market, we estimated the average rate anticipated for each demand segment.
Individual business travelers, for example, will pay the highest rate because they
tend to travel during peak periods and are reimbursed for their travel. Leisure
travelers will pay the least because they book during the slower periods. The
following table displays the weighted average (rounded) and applies a 3.0%
inflation rate in order to estimate the future ADR and resulting rooms revenue for
the proposed hotel.
Average Daily Rate and Rooms Revenues
Fiscal Occupancy Average Daily Rate Rooms
Year 2016 Dollars Inflated Dollars Revenue
2018 62% $100.00 $99.75 $1,467,323
2019 66% $100.00 $104.75 $1,640,385
2020 68% $100.00 $110.00 $1,774,300
Financial Pro Forma
Exhibit B located in the Addendum summarizes our departmental revenue and
operating expenses for the subject hotel. In preparing this analysis, we consulted
income and expense ratios for comparable hotels published by CBRE Hotels
(formerly PKF Consulting) in their 2015 USA Trends in the Hotel Industry. The data
presented by CBRE Hotels is expressed in ratios to total revenue as well as dollars
per available room. Exhibit B is expressed in 2016 dollars for the stabilized year of
operation (2020).City of Azle June 27, 2016
Proposed Best Western Hotel Page 13
While most of the budget line items in Exhibits B and C are based on national
averages, further adjustments were made to reflect local insurance costs and
property tax assessments.
Exhibit C restates the stabilized estimates of Exhibit B into stated year dollars for
calendar years 2018 to 2027 making assumptions for operational inefficiencies that
result from the early years that the hotel operates below the stabilized occupancy.
The following table summarizes the resulting analysis using inflated dollars for the
hotel’s pro forma income statement.
Summary Income Statement *
2018 2019 2020 2021 2022
Occupancy 62% 66% 68% 68% 68%
Average Daily Rate * $99.75 $104.75 $110.00 $115.75 $119.00
Rooms Revenue 1,467,000 1,640,000 1,774,000 1,867,000 1,919,000
Other Income 23,000 26,000 27,000 28,000 29,000
Total Revenues 1,490,000 1,666,000 1,801,000 1,895,000 1,948,000
Departmental Expenses 427,000 453,000 474,000 489,000 504,000
Undistributed Expenses 426,000 453,000 476,000 495,000 510,000
Other Fixed Expenses 180,000 196,000 204,000 210,000 216,000
Reserve for Replacement 30,000 50,000 72,000 76,000 78,000
Net Operating Income 427,000 514,000 575,000 625,000 640,000
* Inflated Dollars.
Return on Investment
A project is said to be feasible if investment objectives can be met using reasonable
financing assumptions. In Exhibit D, we summarize the cost of developing and
financing the hotel and derive the equity requirement from which the return will be
based. By comparing the Project’s equity requirement to the potential operating
results after debt service, we can calculate the potential return on the equity
investment. As summarized in Exhibit D, the proposed hotel has a total of 65 keys
and current estimates show the total cost to develop the project will be $6,175,000,
inclusive of land.
We based the amount of the construction loan on 80% of cost, or $4.9 million
(rounded) and the loan terms based on a 25-year amortization schedule at 5.0% per
annum. The resulting equity requirement is approximately $1,275,000.
Because an Internal Rate of Return (IRR) is an expression of equity return over the
life of the investment, our analysis shows an assumed sale of the hotel in the fifth
year based on a reversion analysis. The sales value is based on a theoretical
terminal cap rate of 10%. From the projected sales price for the Project, we
deducted a real estate commission and the outstanding debt at the time of sale. The
resulting proceeds of the sale are added to the distributable cash flow for that year
for potential distribution.City of Azle June 27, 2016 Proposed Best Western Hotel Page 14 The IRR is then calculated over the life of the investment showing cash being invested in 2016 prior to the start of construction and dividends being paid starting in 2018. Our analysis is based on inflated dollars (at 3% per year) and the occupancy estimates derived in our report. Using these assumptions, the IRR for the Project is calculated to be 17.2%. As the hotel development community seeks projects that achieve well above a 20% levered IRR, a variety of incentives will be required to make this project attractive to developers. Limiting Conditions The conclusions in this report are based upon review of published information and information provided by the general managers and/or owners at the competing hotels, and an analysis of historical market area data. The report is based on estimates, assumptions, and other information developed from our analysis of the local hotel market area and characteristics of the proposed property. Since the projections in this letter are based upon estimates and assumptions, which inherently are subject to uncertainty and variation depending upon evolving events, we do not represent them as results that will actually be achieved. This report has been prepared primarily for your use and guidance in determining the risk in developing the proposed property. As is customary in assignments of this nature, neither our name nor the material submitted may be included in any prospectus, in newspaper publicity, or as part of any printed material; or used in offerings or representations in connection with the sale of securities or participation interests to the public. WE MADE NO ATTEMPT TO VERIFY THE ESTIMATES OF PROJECT COSTS PROVIDED BY THE DEVELOPER AND HAVE NO OPINION ON THEIR VALIDITY. IN ORDER TO RELY ON THE RESULTING ESTIMATES OF CASH ON CASH RETURN AND INTERNAL RATE OF RETURN, POTENTIAL INVESTORS MUST CONDUCT THEIR OWN INVESTIGATION AS TO THE RELIABILITY AND COMPLETENESS OF THE COSTS OF DEVELOPING THIS HOTEL. FURTHERMORE, THE TERMINAL CAP RATE WAS NOT DERIVED BY AN APPRAISAL OF RECENT MARKET SALES. A MARKET DERIVATION OF CAP RATES BY A CERTIFIED APPRAISER IS NEEDED IN ORDER TO ACCURATELY EXPRESS POTENTIAL RETURNS. DP Consulting – Qualifications DP Consulting is a hospitality, tourism, and real estate oriented consulting and brokerage firm. We have developed a particular expertise that includes public/private ventures involving public assembly facilities. DPC has also worked extensively on every type of hotel to include limited-service, full-service, conference centers, and resorts with golf.
City of Azle                                                         June 27, 2016
Proposed Best Western Hotel                                                Page 15

The principal of DP Consulting, David Parker, has over 25 years experience in the
hotel industry, to include operations, consulting, and development. Prior to forming
DP Consulting, Mr. Parker was employed by PKF Consulting for nearly a decade
where he developed numerous methodologies for collecting market information on
hotels and meeting facilities, and developed multiple modeling techniques for
projecting utilization, income and expense. Examples included using fax software
and e-mail to disseminate meeting planner surveys and a database to aggregate
survey results. DPC is also experienced with economic impact analysis.

In conjunction with hotel research, Mr. Parker developed the system through which
occupancy data was collected from individual hotels and reported in aggregate on a
monthly basis, known as Trends in the Hotel Industry. In addition, Mr. Parker
developed a database based on Hotel Occupancy Tax receipts collected by the State
of Texas in order to develop a census of hotel performance for various market areas.
Mr. Parker has directed a variety of projects, a summary of which are listed in
Exhibit E in the Addendum.

We would be pleased to hear from you if we may be of further assistance in the
interpretation and application of our findings and conclusions. We express our
appreciation to you and your associates for the cooperation extended to us during
the course of this assignment.

Sincerely,

David S. Parker
Addendum

Competitive Set Table                   Exhibit A
Financial Pro Forma – Stabilized Year   Exhibit B
Financial Pro Forma – 2018 to 2027      Exhibit C
Return on Investment                    Exhibit D
Projects Completed by David Parker      Exhibit E
SUMMARY OF COMPETITIVE HOTELS
                                                                                                                Azle, Texas
                                                                                                                  +                                                                                                         Exhibit A-1
                                                                                                                                          1
                                                                                        Year                           2016 Rack Rates                                                 Miles from
                                 Properties                                Rooms                                                                                                                                 Amenities 2
                                                                                       Opened                Weekday                      Weekend                                       Subject
                                                                                                                                                                 Property Type
Competitive Set Hotels
 1 Holiday Inn Express & Suites Lake Worth NW Loop 820
   3541 NW Loop 820                                                          69           2005              $120 - $130                  $125 - $135            Limited-Service            11.0               HB, SP, FC, LF, MR

 2   Comfort Suites at Lake Worth
                                                                             68           2012               $99 - $179                  $109 - $179            Limited-Service            11.0               HB, SP, FC, LF, MR
     5825 Quebec Street
 3   La Quinta Inn & Suites Fort Worth - Lake Worth
     5800 Quebec Street                                                      71           2009              $105 - $125                  $105 - $125            Limited-Service            11.0               HB, SP, FC, LF, MR

 4   Best Western Plus Lake Worth Inn & Suites
     3920 Boat Club Road                                                     50           2002               $89 - $149                  $103 - $156            Limited-Service            10.5               HB, SP, FC, LF, MR

 5   Candlewood Suites Fort Worth/West
     402 Jim Wright Freeway                                                  80           2011              $110 - $135                  $120 - $150             Extended-Stay            15.25                   FK, FC, LF

 6   Staybridge Suites Fort Worth/West
     229 Clifford Center Dr.                                                 86           2009              $150 - $210                  $145 - $215             Extended-Stay            15.25             FK, HB, SP, FC, LF, MR

 7   Econo Lodge
                                                                             39           2006                $78 - $88                   $78 - $88                 Economy                0.20                    CCB, SP
     624 Boyd Road

     Total Hotel Rooms - 2015                                                463                    2015 Market ADR: $88.76 / Market Occuapncy: 67.3%
New Hotels
 A Subject - Best Western
                                                                             65           2018                   n/a                          n/a               Limited-Service             --                HB, SP, FC, LF, MR
   Azle, TX
     Total Hotel Rooms                                                       528
     1
         Ranged of Published Rates. n/s - Not Shown on Map.
     2
      Amenity Codes: FB - Food and Beverage Outlets, FHB Full Hot Breakfast, CB - Continental Breakfast, FK - Full Kitchen, WB - Wet Bar, SP - Swimming Pool, FC - Fitness Center, LF - Laundry Facility, MMS Major Meeting Space, MR -
     Meeting Room.
Proposed Best Western - Azle, Texas Exhibit C 7/15/16
Representative Year of Operation 11:03 AM
Limited Service Hotels Stabilized Operating Year (2020)
ADR Between $75 and $115 Stated in 2016 Dollars
Number of Units: 104 65
Number of Annual Rooms Available: 37,960 23,725
Number of Rooms Occupied: 26,686 16,133
Annual Occupancy: 70.3% 68.0%
Average Daily Rate: 92.53 $100.00
Revenue Per Available Room: $65.05 $68.00
Ratio Per Room P.O.R. Amount Ratio Per Room P.O.R.
Revenues
Rooms 98.3% 23,743 $92.53 $1,613,000 98.5% $24,815 $99.98
Other Operated Departments 1.7% 403 1.57 24,000 1.5% 369 1.49
Total Revenues 100.0% 24,146 94.10 1,637,000 100.0% 25,185 101.47
Departmental Expenses
Rooms 26.9% 6,398 24.93 403,000 25.0% 6,200 24.98
Other Operated Departments 78.2% 315 1.23 18,000 75.0% 277 1.12
Total Departmental Expenses 27.8% 6,713 26.16 421,000 25.7% 6,477 26.10
Departmental Profit 72.2% 17,433 67.94 1,216,000 74.3% 18,708 75.37
Undistributed Expenses
Administrative & General 9.2% 2,212 8.62 154,000 9.4% 2,369 9.55
Marketing & Franchise 10.3% 2,478 9.66 131,000 8.0% 2,015 8.12
Property Operation and Maintenance 5.4% 1,303 5.08 78,000 4.8% 1,200 4.83
Utility Costs 4.8% 1,154 4.50 65,000 4.0% 1,000 4.03
Total Undistributed Operating Expenses 29.6% 7,147 27.85 428,000 26.1% 6,585 26.53
Gross Operating Profit 42.6% 10,286 40.09 788,000 48.1% 12,123 48.84
Fixed Expenses
Base Management Fee 3.0% 714 2.78 65,000 4.0% 1,000 4.03
Property Taxes 3.8% 925 3.60 96,000 5.9% 1,477 5.95
Insurance 1.5% 358 1.40 23,000 1.4% 354 1.43
Total Fixed Expenses 8.3% 1,997 7.78 184,000 11.2% 2,831 11.41
Net Operating Income 34.3% 8,289 32.30 604,000 36.9% 9,292 37.44
FF&E Reserve 4.0% 966 3.76 65,000 4.0% 1,000 4.03
Net Operating Income After Reserve 30.3% 7,323 28.54 $539,000 32.9% $8,292 $33.41
Source: PKF Consulting Estimated by DP Consulting
DRAFT COPY - SUBJECT TO FINAL REVIEW
Confidential - For Discussion Purposes OnlyProposed Best Western - Azle, Texas Exhibit D-1 7/15/16
Projected Operating Results 11:03 AM
Calendar Years
2018 2019 2020 2021 2022
Number of Units: 65 65 65 65 65
Number of Annual Rooms Available: 23,725 23,725 23,725 23,725 23,725
Number of Rooms Occupied: 14,710 15,660 16,130 16,130 16,130
Annual Occupancy: 62.0% 66.0% 68.0% 68.0% 68.0%
Average Daily Rate: $99.75 $104.75 $110.00 $115.75 $119.00
Revenue Per Available Room: $61.85 $69.14 $74.80 $78.71 $80.92
Amount Ratio Amount Ratio Amount Ratio Amount Ratio Amount Ratio
Revenues
Rooms $1,467,000 98.5% $1,640,000 98.4% $1,774,000 98.5% $1,867,000 98.5% $1,919,000 98.5%
Other Operated Departments 23,000 1.5% 26,000 1.6% 27,000 1.5% 28,000 1.5% 29,000 1.5%
Total Revenues 1,490,000 100.0% 1,666,000 100.0% 1,801,000 100.0% 1,895,000 100.0% 1,948,000 100.0%
Departmental Expenses
Rooms 409,000 27.9% 434,000 26.5% 454,000 25.6% 468,000 25.1% 482,000 25.1%
Other Operated Departments 18,000 78.3% 19,000 73.1% 20,000 74.1% 21,000 75.0% 22,000 75.9%
Total Departmental Expenses 427,000 28.7% 453,000 27.2% 474,000 26.3% 489,000 25.8% 504,000 25.9%
Departmental Profit 1,063,000 71.3% 1,213,000 72.8% 1,327,000 73.7% 1,406,000 74.2% 1,444,000 74.1%
Undistributed Expenses
Administrative & General 151,000 10.1% 162,000 9.7% 171,000 9.5% 178,000 9.4% 183,000 9.4%
Marketing & Franchise 119,000 8.0% 133,000 8.0% 144,000 8.0% 152,000 8.0% 156,000 8.0%
Property Operation and Maintenance 87,000 5.8% 87,000 5.2% 88,000 4.9% 90,000 4.7% 93,000 4.8%
Utility Costs 69,000 4.6% 71,000 4.3% 73,000 4.1% 75,000 4.0% 78,000 4.0%
Total Undistributed Operating Expenses 426,000 28.6% 453,000 27.2% 476,000 26.4% 495,000 26.1% 510,000 26.2%
Gross Operating Profit 637,000 42.8% 760,000 45.6% 851,000 47.3% 911,000 48.1% 934,000 47.9%
Fixed Expenses
Base Management Fee 60,000 4.0% 67,000 4.0% 72,000 4.0% 76,000 4.0% 78,000 4.0%
Property Taxes 96,000 6.4% 104,000 6.2% 106,000 5.9% 108,000 5.7% 111,000 5.7%
Insurance 24,000 1.6% 25,000 1.5% 26,000 1.4% 26,000 1.4% 27,000 1.4%
Total Fixed Expenses 180,000 12.1% 196,000 11.8% 204,000 11.3% 210,000 11.1% 216,000 11.1%
Net Operating Income 457,000 30.7% 564,000 33.9% 647,000 35.9% 701,000 37.0% 718,000 36.9%
FF&E Reserve 30,000 2.0% 50,000 3.0% 72,000 4.0% 76,000 4.0% 78,000 4.0%
Net Operating Income After Reserve $427,000 28.7% $514,000 30.9% $575,000 31.9% $625,000 33.0% $640,000 32.9%
Full Year of Operation
DRAFT COPY - SUBJECT TO FINAL REVIEW
Confidential - For Discussion Purposes OnlyProposed Best Western - Azle, Texas Exhibit D-2 7/15/16
Projected Operating Results 11:03 AM
Calendar Years
2023 2024 2025 2026 2027
Number of Units: 65 65 65 65 65
Number of Annual Rooms Available: 23,725 23,725 23,725 23,725 23,725
Number of Rooms Occupied: 16,130 16,130 16,130 16,130 16,130
Annual Occupancy: 68.0% 68.0% 68.0% 68.0% 68.0%
Average Daily Rate: $122.75 $126.25 $130.25 $134.00 $138.00
Revenue Per Available Room: $83.47 $85.85 $88.57 $91.12 $93.84
Amount Ratio Amount Ratio Amount Ratio Amount Ratio Amount Ratio
Revenues
Rooms $1,980,000 98.5% $2,036,000 98.5% $2,101,000 98.5% $2,161,000 98.5% $2,226,000 98.5%
Other Operated Departments 30,000 1.5% 31,000 1.5% 32,000 1.5% 33,000 1.5% 33,000 1.5%
Total Revenues 2,010,000 100.0% 2,067,000 100.0% 2,133,000 100.0% 2,194,000 100.0% 2,259,000 100.0%
Departmental Expenses
Rooms 496,000 25.1% 511,000 25.1% 526,000 25.0% 542,000 25.1% 558,000 25.1%
Other Operated Departments 22,000 73.3% 23,000 74.2% 24,000 75.0% 24,000 72.7% 25,000 75.8%
Total Departmental Expenses 518,000 25.8% 534,000 25.8% 550,000 25.8% 566,000 25.8% 583,000 25.8%
Departmental Profit 1,492,000 74.2% 1,533,000 74.2% 1,583,000 74.2% 1,628,000 74.2% 1,676,000 74.2%
Undistributed Expenses
Administrative & General 189,000 9.4% 194,000 9.4% 200,000 9.4% 206,000 9.4% 212,000 9.4%
Marketing & Franchise 161,000 8.0% 165,000 8.0% 171,000 8.0% 176,000 8.0% 181,000 8.0%
Property Operation and Maintenance 96,000 4.8% 99,000 4.8% 102,000 4.8% 105,000 4.8% 108,000 4.8%
Utility Costs 80,000 4.0% 82,000 4.0% 85,000 4.0% 87,000 4.0% 90,000 4.0%
Total Undistributed Operating Expenses 526,000 26.2% 540,000 26.1% 558,000 26.2% 574,000 26.2% 591,000 26.2%
Gross Operating Profit 966,000 48.1% 993,000 48.0% 1,025,000 48.1% 1,054,000 48.0% 1,085,000 48.0%
Fixed Expenses
Base Management Fee 80,000 4.0% 83,000 4.0% 85,000 4.0% 88,000 4.0% 90,000 4.0%
Property Taxes 113,000 5.6% 115,000 5.6% 117,000 5.5% 120,000 5.5% 122,000 5.4%
Insurance 28,000 1.4% 29,000 1.4% 30,000 1.4% 31,000 1.4% 31,000 1.4%
Total Fixed Expenses 221,000 11.0% 227,000 11.0% 232,000 10.9% 239,000 10.9% 243,000 10.8%
Net Operating Income 745,000 37.1% 766,000 37.1% 793,000 37.2% 815,000 37.1% 842,000 37.3%
FF&E Reserve 80,000 4.0% 83,000 4.0% 85,000 4.0% 88,000 4.0% 90,000 4.0%
Net Operating Income After Reserve $665,000 33.1% $683,000 33.0% $708,000 33.2% $727,000 33.1% $752,000 33.3%
DRAFT COPY - SUBJECT TO FINAL REVIEW
Confidential - For Discussion Purposes OnlyProposed Best Western - Azle, Texas
Exhibit D
Project Description Cost Assumptions Debt Assumptions
Keys: 65 Land Term 25
Acres 2.000 Interest 5.00%
Net On Site Meeting Space 2,000 $ per SF - Loan to Costs (Estimate) 80%
Land Value -
Pool Outside Per Room - Loan Amount 4,900,000
Land Costs % of Total 0% Monthly Loan Payment 28,645
Employees (Approx.) 25 Annual Debt Service 343,739
Hard / Soft Cost 6,175,000
Amenities: Swimming Pool, Fitness Center, $ Per Room 95,000
Laundry Facility, Meeting Room Equity Requirement 1,275,000
Total Project 6,175,000
Per Room 95,000
Net Operating Income Today's Dollars Year 1 Year 2 Year 3 Year 4 Year 5
Full Year of Operation 2016 2018 2019 2020 2021 2022
Occ% 68% 62% 66% 68% 68% 68%
ADR $100.00 $99.75 $104.75 $110.00 $115.75 $119.00
Room Revenue 1,613,000 1,467,000 1,640,000 1,774,000 1,867,000 1,919,000
Other Income 24,000 23,000 26,000 27,000 28,000 29,000
Total 1,637,000 1,490,000 1,666,000 1,801,000 1,895,000 1,948,000
Total Expenses 1,098,000 1,063,000 1,152,000 1,226,000 1,270,000 1,308,000
Net Operating Income 539,000 427,000 514,000 575,000 625,000 640,000
Less: Debt Service (Year 1 Interest Only) (245,000) (343,739) (343,739) (343,739) (343,739)
Potential Distributable Dividends 182,000 170,261 231,261 281,261 296,261
Debt Coverage Ratio 1.74 1.50 1.67 1.82 1.86
Internal Rate of Return Construction
2016 2017 2018 2019 2020 2021 2022 IRR Total Return
Initial Equity Investment (1,275,000)
Potential Distributable Dividends - 182,000 170,261 231,261 281,261 296,261
Reversion 1,744,219
Total Equity Return (1,275,000) - 182,000 170,261 231,261 281,261 2,040,481 17.2% 2,905,264
Cash on Cash Return - by Year 14% 13% 18% 22% 160%
Reversion Analysis NOTE: DP Consulting made no attempt to verify the estimates of project costs provided by the developer and
Year 5 NOI 640,000 have no opinion on their validity. In order to rely on the resulting estimates of cash on cash return and
Terminal Cap Rate 10.0% internal rate of return, potential investors must conduct their own investigation as to the reliability and
Reversion Value (Sales Price) 6,400,000 completeness of the costs of developing this hotel. Furthermore, the terminal cap rate was not derived by an
Sales Price per Key 98,462 appraisal of recent market sales. A market derivation of cap rates by a certified appraiser is needed in order
RE Commission 3.0% to accurately express potential returns.
Less Sales Cost (192,000)
Net Sale 6,208,000
Less Outstanding Debt (4,463,781)
Net Proceeds to Equity 1,744,219Exhibit E Projects Completed by David Parker Market Studies of Limited-Service Hotels: Dallas Area: Market Study of Proposed Best Western Premier – Denton, Texas (Open 2009) Market Study of Proposed Fairfield Inn – Decatur, Texas Market Study and Valuation of Proposed Comfort Suites – Grapevine, Texas (Open 2005) Market Study of a Hampton Inn and Suites – Alliance Airport, Fort Worth Texas (Open 1999) Due Diligence Analysis of five hotels (Holiday Inn Expresses and Quality Suites) – Dallas, Texas Market Study of Proposed Hampton Inn and Suites – Hurst, Texas (Open 2004) Due Diligence Analysis Wyndham Garden Hotel Los Colinas – Irving, Texas Due Diligence Analysis Wyndham Garden Hotel Market Center – Dallas, Texas Houston Area: Market Study of Proposed Hampton Inn & Suites – Bush Intercontinental Airport – Houston, Texas (Open 2015) Market Study of Proposed Comfort Suites (Westchase) – Houston, Texas (Open 2013) Market Study of Proposed Hampton Inn & Suites – Missouri City, Texas (Open 2013) Market Study of Proposed Courtyard & TownePlace Suites – Galveston, Texas (Open 2013) Market Study of Proposed SpringHill Suites – Houston, Texas Market Study of Proposed Sleep Inn – Clute/Lack Jackson, Texas Market Study of Proposed Microtel Inn & Suites – Port Arthur, Texas Market Study of Proposed SpringHill Suites – Seabrook, Texas Market Study of Proposed La Quinta – West Chase - Houston, TX (Open 2007) Market Study of Proposed Best Western Mini Suites – Texas City, Texas (Open 2005) Market Study of Proposed Bed & Breakfast – Kemah, Texas (Open 2004) Market Study of a Proposed TownePlace Suite – College Station, Texas (Open 1999) Market Study of a Proposed TownePlace Suite – Clear Lake, Texas (Open 1999) Market Evaluations of four Baymont Inns – Houston, Texas Market Study of Proposed Hampton Inn & Suites – League City, Texas (Open 2010) Central Texas: Market Study of Proposed Homewood Suites – (Parmer Lane) Austin, Texas (Open 2015) Market Study of Proposed Home2 Suites – Round Rock, Texas (Open 2015) Market Study of Proposed Bed and Breakfast Cabins – Fredericksburg, Texas (Open 2013) Market Study of Proposed Hampton Inn & Suites – Downtown Austin, Texas (Open 2012) Market Study of Proposed Homewood Suites – Round Rock, Texas (Open 2010) Market Study of Proposed Sleep Inn & Suites – Manor, Texas (Open 2012) Market Study of Proposed Limited-Service Hotel – Marble Falls, Texas Market Study of Proposed Microtel Inn & Suites – Austin, Texas (Airport) (Open 2010) Market Study of Proposed Staybridge Suites – San Antonio, Texas (Open 2008) Market Study of Proposed La Quinta - Medical Center - San Antonio, Texas (Open 2007) South Texas: Market Study of Proposed Microtel – Gonzales, Texas (Open 2013) Market Study of Proposed Home2 Suites – Mission, Texas Market Study of Proposed Holiday Inn Express – South Padre Island, Texas (Open 2005)
Exhibit E

North Texas:
Market Study of Proposed Hampton Inn – Vernon, Texas (Open 2011)
Market Study of Proposed Holiday Inn Express – Vernon, Texas (Open 2006)

West Texas:
Market Study of Proposed Microtel – San Angelo, Texas (Open 2010)
Market Study of Proposed Hawthorn Suites – Lubbock, Texas (Open 2008)
Market Study of Proposed Best Western – Hamilton, Texas (Open 2007)
Market Study of Proposed La Quinta – Lubbock, Texas (Open 2006)

East Texas:
Market Study of Proposed Microtel Inn & Suites – Texarkana, Texas
Market Study of Proposed Hampton Inn – Sulphur Springs, Texas (Open 2010)
Market Study of Proposed Best Western – Mt. Vernon, Texas

Outside of Texas:
Market Study of Proposed Home2 Suites – Tallahassee, Florida (Open 2016)
Market Study of Proposed Home2 Suites – Stillwater, Oklahoma (Open 2016)
Market Study of Proposed Home2 Suites – Tuscaloosa, Alabama (Open 2015)
Market Study of Proposed Home2 Suites – Lexington, Kentucky (Open 2015)
Market Study of Proposed Hilton Garden Inn & Homewood Suites – Oklahoma City, Oklahoma (Open 2014)
Market Study of Proposed Hampton Inn & Suites - Mulvane, Kansas (Open 2012)
Market Study of Proposed Hampton Inn & Suites – Dodge City, Kansas (Open 2012)
Market Study of Proposed Homewood Suites – Nashville, Tennessee (Open 2013)
Market Study of Proposed Fairfield Inn – Maize, KS (Open 2011)
Market Study of Proposed La Quinta Inn & Suites – Olathe, Kansas (Open 2008)
Market Study of Proposed Holiday Inn Express & Suites – Bloomington, Indiana (Open 2006)
Market Study of Converting historic buildings into Residence Inn and Courtyard by Marriott
        – Omaha, NE (Open 1999)
Market Study of Proposed Sleep Inn Limited-Service hotel – Thornton, Colorado (Open 1998)
Market Study and Valuation of Proposed All-Suite Hotel at Isle of Capri Casino –
        Lake Charles, Louisiana (Open 1998)
Market Study and Valuation of Proposed Limited-Service Hotel at Isle of Capri Casino –
        Lake Charles, Louisiana (Open 1997)

Market Studies Select and Full-Service Hotels:

Dallas Area:
Market Study of Proposed Hilton Garden Inn – Hurst, Texas (Open 2016)
Market Study of Proposed Hilton Dallas/Plano Granite Park – Plano, TX (Open 2014)
Market Study of Proposed Cambria Suites – Plano, Texas (Open 2014)
Market Study of Proposed Courtyard Hotel & Conference Center – Carrollton, Texas
Market Study of Renovating the Historic Blackstone Hotel into a Courtyard by Marriott
        – Fort Worth, Texas (Open 1999)
Market Study of Proposed Embassy Suites Galleria – Dallas, Texas (Open 1998)
Evaluation of Converting the Employers Life Insurance Building into a Headquarters Hotel – Dallas, Texas
Exhibit E
Market Study of Proposed Holiday Inn – McKinney, Texas (Open 2008)
Market Study of Proposed Resort Hotel and Water Park – Frisco, Texas
Impact Assessment of Converting Ramada Plaza into Holiday Inn Select (Presently The Sheraton) – Fort Worth, Texas
Houston Area:
Market Study of Proposed Courtyard & TownePlace Suites – Galveston, Texas (Open 2013)
Market Study of Proposed Courtyard by Marriott – Galveston, TX (Open 2013)
Market Study of Proposed Embassy Suites & Water Park – Beaumont, Texas
Market Study of Proposed Embassy Suites – Texas Medical Center – Houston, TX
Market Study of Proposed Holiday Inn – Shenandoah, Texas
Market Study of Proposed Hilton Garden Inn Galleria – Houston, Texas (Open 2005)
Market Study and Economic Impact Assessment of 1,200-Room Hilton Americas
– Downtown Houston, Texas (Open 2004)
Market Study of Converting the Medical Towers into the Marriott Medical Center Expansion – Houston, Texas
Market Study of Converting Historic Texas State Hotel into Sheraton Suites – Downtown Houston, Texas
Market Study and Valuation of Omni Galleria – Houston, Texas
Market Study and Valuation of Red Lion Hotel Galleria – Houston, Texas
Central Texas:
Market Study of Proposed SoCo Hotel – (South Congress) Austin, Texas (Open 2015)
Economic Impact Study of Proposed Hilton Garden Inn – Live Oak, Texas
Market Study of Proposed Select-Service Hotel & Conference Center – Boerne, Texas
Market Study of Proposed Four Points (Now Wyndham Garden Inn Near La Cantera) – San Antonio, Texas (Open 2009)
Market Study of Proposed Boutique Hotel – Fredericksburg, Texas
Market Study of Proposed Cambria Suites – Medical Center – San Antonio, Texas
Market Study of Proposed Westin Riverwalk – San Antonio, Texas (Open 1999)
Market Study of Proposed Full-Service Hotel – New Braunfels, Texas
Market Study and Valuation of St. Anthony Hotel – San Antonio, Texas
South Texas:
Market Study of Proposed Hotel & Conference Center – Port Aransas, Texas
Market Study of Proposed Full-Service Hotel Adjacent to McAllen Convention Center – McAllen, Texas
Market Study of Proposed All-Suite Hotel and Resort on North Padre Island – Corpus Christi, Texas
Market Study, Economic Impact Study, and Financing Recommendations of Proposed Full-Service Hotel
– South Padre Island, Texas
Market Study of Proposed Executive Conference Center – North Padre Island, Corpus Christi, Texas
North Texas:
Market Study of Proposed Hotel Conversion to a Full-Service Wyndham Hotel – Wichita Falls, Texas
West Texas:
Market Study of Proposed Full-Service Hotel & Conference Center – Odessa, Texas
Outside of Texas:
Market Study of Proposed Full-Service Resort with Golf – Franklin, Tennessee
Market Study of Proposed Hilton Garden Inn & Homewood Suites – Oklahoma City, Oklahoma (Open 2014)
Market Study of Proposed Conversion of the Fulton Hotel to a Holiday Inn – Alexandria, Louisiana
Market Study of Proposed Office Building Conversion into Hilton Garden Inn –
Airport - Phoenix, Arizona (Open 2009)
Market Study of Proposed Hilton Garden Inn (Converted Office Building) – Phoenix, AZ at Airport (Open2008)Exhibit E
Market Study of Proposed Full-Service Hotel – Colorado Springs, Colorado
Performance Review of Operating Standards – Radisson Fort McDowell Resort & Casino – Scottsdale, Arizona
Market Study of Proposed Holiday Inn – Colorado Springs, Colorado
Market Study and Valuation of Cypress Bend Golf Resort and Conference Center – Sabine Parish, Louisiana
Market Study of Converting historic buildings into Residence Inn and Courtyard by Marriott
– Omaha, NE (Open 1999)
Market Study of Proposed Full-Service Hotel – Sandy City, Utah
Market Study of Proposed Full-Service Hotel adjacent to Jazz Land Theme Park – New Orleans, LA
Market Study and Valuation of 780-room Regal Riverfront – St. Louis, Missouri
Public Assembly Facility Studies:
Dallas Area:
Market Study of Proposed Dallas County School District Meeting Facility – Dallas, Texas
Market Study of Proposed 500,000-Square foot Exhibition Center – Grapevine, Texas
Market Study of Proposed Conference Center – Hurst, Texas (Open 2007)
Management RFP of Proposed Conference Center – Hurst, Texas
Houston Area:
Market Study of Proposed Convention Center – Stafford, Texas (Open 2003)
Market Study of Proposed Performing Arts Theater – Stafford, Texas (Open 2003)
Market Study and Economic Impact of Proposed Waterway Convention Center –
The Woodlands, Texas (Open 2002)
Citywide occupancy tax collection forecast for City of Houston, used in securing $700 million in bonds for the purpose of
expanding the George R. Brown Convention Center, constructing the 1,200-room Hilton Hotel, parking garage, and
NBA basketball arena – Houston, Texas
Market Study and Economic Impact Study of Expanding the George R. Brown Convention Center
– Downtown Houston, Texas
Market Study of Proposed Convention Center, Mall Conversion – Baytown, Texas
Market Study of Proposed Natatorium – Stafford, Texas
Market Study of Repositioning a portion of Greenspoint Mall into a Convention Center – Houston, Texas
Market Study of Proposed Civic Center – Kemah, Texas
Market Study of Proposed Civic Center – Freeport, Texas
Central Texas:
Market Study of Proposed Convention Center – New Braunfels, Texas
Market Study of Proposed Civic Center & Exhibit Hall – Gonzales, Texas
South Texas:
Market Study of Expanding the Bayfront Convention Center – Corpus Christi, Texas (Completed 1999)
East Texas:
Market Study of Proposed Convention Center – Lufkin, TexasExhibit E
Outside of Texas:
Market Study and Economic Impact Study of Proposed 453,000-square foot Exhibition Center
– Sandy City, Utah
Market Study of Proposed Ballroom Addition to the Welk Resort – Branson, Missouri
Market Study of Proposed Convention Center, Mall Conversion – Tupelo, Mississippi
Other Projects:
Houston’s First Baptist Church – Hunt Retreat – Lodge/Conference Facility – Fulshear, Texas (Open 2013)
Market Study of Proposed Baseball Facility – The Zone – Kingwood, Texas (Open 2012)
Market Study of Proposed Water Park – Beaumont, Texas
Market Study of Proposed Time Share – Lake Havasu, Arizona
Lakeview Methodist Conference Center – Lodge/Conference Facility – Palestine, Texas
Market Study for Three Proposed Buffalo Wild Wings locations – Greater New Orleans, Louisiana
Market Study for Proposed Apartments – Jackson, Tennessee
Developer of five high-end town homes near Texas Medical Center
Developer of three-unit loft project east of Mid-Town - Houston, Texas
Due Diligence of new construction 400-unit Self Storage in southwest Houston
Due Diligence of new construction 400-unit Self Storage in Baytown, Texas
Developer / Investor Prospectus of Pearland Swim Academy – Pearland, TexasYou can also read