Automated determination of cup-to-disc ratio for classification of glaucomatous and normal eyes on stereo retinal fundus images
←
→
Page content transcription
If your browser does not render page correctly, please read the page content below
Automated determination of cup-to-disc
                 ratio for classification of glaucomatous
                 and normal eyes on stereo retinal fundus
                 images

                 Chisako Muramatsu
                 Toshiaki Nakagawa
                 Akira Sawada
                 Yuji Hatanaka
                 Tetsuya Yamamoto
                 Hiroshi Fujita

Downloaded From: https://www.spiedigitallibrary.org/journals/Journal-of-Biomedical-Optics on 07 Jan 2022
Terms of Use: https://www.spiedigitallibrary.org/terms-of-use
Journal of Biomedical Optics 16(9), 096009 (September 2011)

                Automated determination of cup-to-disc ratio for
                classification of glaucomatous and normal eyes on
                stereo retinal fundus images
                Chisako Muramatsu,a Toshiaki Nakagawa,b Akira Sawada,c Yuji Hatanaka,d Tetsuya Yamamoto,c and Hiroshi Fujitaa
                a Gifu University, Graduate School of Medicine, Department of Intelligent Image Information 1-1 Yanagido,
                Gifu 501-1194, Japan
                b Kowa Company, Ltd., Electronics and Optics Division, Research & Development Section, Hamamatsu Factory,
                1-3-1 Shin-Miyakoda, Kita-ku, Hamamatsu-shi, Shizuoka 431-2103, Japan
                c Gifu Universtiy, Graduate School of Medicine, Department of Ophthalmology, 1-1 Yanagido, Gifu 501-1194, Japan
                d University of Shiga Prefecture, School of Engineering, Department of Electronic System Engineering,
                2500 Hassakacho, Hikone, Shiga 522-8533, Japan

                              Abstract. Early diagnosis of glaucoma, which is the second leading cause of blindness in the world, can halt or
                              slow the progression of the disease. We propose an automated method for analyzing the optic disc and measuring
                              the cup-to-disc ratio (CDR) on stereo retinal fundus images to improve ophthalmologists’ diagnostic efficiency and
                              potentially reduce the variation on the CDR measurement. The method was developed using 80 retinal fundus
                              image pairs, including 25 glaucomatous, and 55 nonglaucomatous eyes, obtained at our institution. A disc region
                              was segmented using the active contour method with the brightness and edge information. The segmentation of
                              a cup region was performed using a depth map of the optic disc, which was reconstructed on the basis of the
                              stereo disparity. The CDRs were measured and compared with those determined using the manual segmentation
                              results by an expert ophthalmologist. The method was applied to a new database which consisted of 98 stereo
                              image pairs including 60 and 30 pairs with and without signs of glaucoma, respectively. Using the CDRs, an area
                              under the receiver operating characteristic curve of 0.90 was obtained for classification of the glaucomatous and
                              nonglaucomatous eyes. The result indicates potential usefulness of the automated determination of CDRs for the
                              diagnosis of glaucoma. C 2011 Society of Photo-Optical Instrumentation Engineers (SPIE). [DOI: 10.1117/1.3622755]
                              Keywords: stereo retinal fundus images; glaucoma; cup-to-disc ratio; computer-aided diagnosis.
                              Paper 11035RR received Jan. 20, 2011; accepted for publication Jul. 18, 2011; published online Sep. 2, 2011.

                1 Introduction                                                                     examination by ophthalmologists, which may include fundus
                Glaucoma is the second leading cause of blindness in the world,                    photography, Heidelberg retinal tomography (HRT), scanning
                and its incidence rate is expected to increase because of the aging                laser ophthalmoscopy, and optical coherence tomography. One
                population, affecting approximately 80 million people in 2020.1                    of the glaucoma-associated findings is the deformation of the
                Once loss of a visual field occurs, it cannot be regained, therefore               optic nerve head (ONH), i.e., enlargement of the depression
                early diagnosis and treatment are key to minimizing the chance                     (called cupping), or rim thinning caused by the decrease of reti-
                of significant visual impairment. However, because of the slow                     nal nerve fibers. Although it is not yet in widespread use, a
                progressive nature of glaucoma, patients remain unaware of the                     stereo fundus camera can be an effective tool for examining
                visual disturbance until the disease reaches advanced stages. In                   the three-dimensional (3D) structure of the ONH. Without the
                a population-based prevalence survey of glaucoma in Tajimi,                        stereoscopic view, ophthalmologists must infer the cup defor-
                Japan, it was found that 93% of patients diagnosed with primary                    mation on the basis of the vessel directions (bending points) and
                open-angle glaucoma (POAG) were unaware of their disease,                          faint color change inside the disc. One of the advantages of the
                i.e., previously undiagnosed.2, 3 On the basis of the community-                   stereo fundus photograph is that it can be interchangeably used
                based descriptive study involving 295 patients, whom a majority                    with regular fundus photographs, which are frequently obtained
                (96%) were white, with the mean follow up of 15 years, the                         for the purpose of diagnostic record, screening, and diagnosis of
                cumulative probability of glaucoma patients’ becoming blind in                     glaucoma and other eye diseases such as diabetic retinopathy.
                at least one eye at 20 years is estimated to be 27%.4                                  The cup-to-disc ratio (CDR), defined as the ratio of the di-
                    Although an elevated intraocular pressure (IOP) is a major                     ameters of the cup and the optic disc, is one of the indices for
                risk factor for most glaucoma patients, its measurement fluctu-                    evaluation of cupping. It may be easier to evaluate CDR on the
                ates, and there is variation in the normal ranges between patients.                stereo images than on conventional fundus images.6, 7 However,
                In the Tajimi study, 92% of POAG patients had an IOP within                        manual quantification of CDR is time-consuming and prone to
                the normal range.5 For diagnosis of glaucoma, the results from                     intra- and inter-reader variations. Several research groups have
                several different tests are considered, in addition to the direct                  investigated automated and semi-automated methods to analyze
                                                                                                   the ONH for diagnosis of glaucoma on stereo8–10 and regular
                Address all correspondence to: Chisako Muramatsu, Gifu University, Intelligent
                                                                                                   fundus images.11, 12
                Image Information, 1-1 Yanagido – Gifu, Gifu 501-1194 Japan. Tel: 81-58-230-
                6519; Fax: 81-58-230-6514; E-mail: chisa@fjt.info.gifu-u.ac.jp.                    1083-3668/2011/16(9)/096009/7/$25.00
                                                                                                                                        C 2011 SPIE

                Journal of Biomedical Optics                                                096009-1                                       September 2011 r Vol. 16(9)

Downloaded From: https://www.spiedigitallibrary.org/journals/Journal-of-Biomedical-Optics on 07 Jan 2022
Terms of Use: https://www.spiedigitallibrary.org/terms-of-use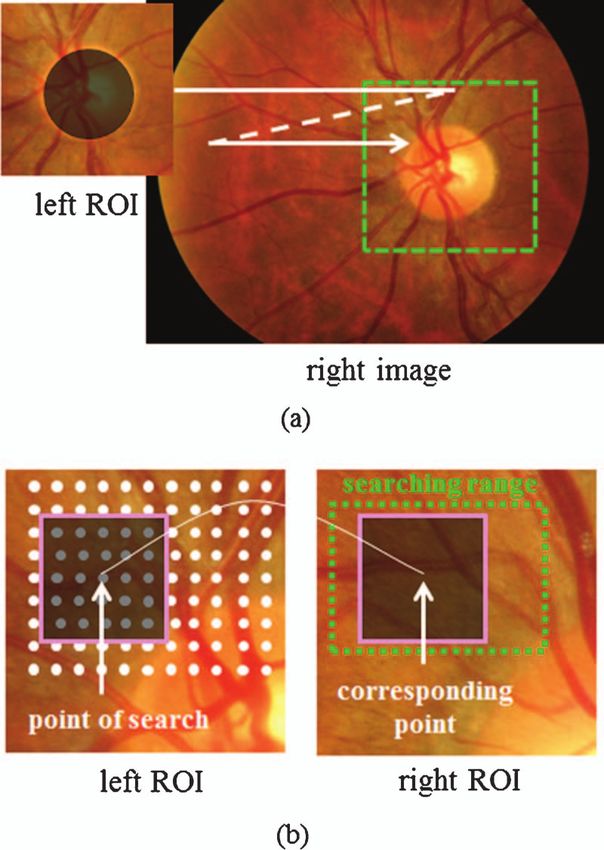
Muramatsu et al.: Automated determination of cup-to-disc ratio for classification...

                     Nayak et al. investigated an automated method for diagno-                      fundus cameras (prototype of the WX-1, Kowa Company, Ltd.,
                 sis of glaucoma on regular fundus images by extracting three                       Tokyo, Japan). The images were saved in JPEG format with
                 features.11 These features include the CDR and two features                        a 1600×1200 pixel matrix. They were captured with an optic
                 characterizing a shift of retinal vessels due to cupping. Their                    angle of 27 deg and the majority were approximately centered
                 system is trained with 46 images and tested on 15 images. The                      at the ONH; in 4 cases, the ONH was off-centered about 1 to
                 effectiveness of these features needs to be evaluated on a larger                  1.5 disc diameter. An ophthalmologist (ophthalmologist A) who
                 database. Wong et al. proposed an improved scheme in deter-                        specializes in glaucoma diagnosis reviewed all 80 cases and pro-
                 mining the CDR on retinal fundus images.12 They developed an                       vided manual outlines of the cup and disc on a stereo display.
                 automated segmentation method for the disc and two segmenta-                       The 80 cases include 25 cases with a glaucomatous optic disc
                 tion methods for the cup on the basis of a level set algorithm and                 and 55 cases without signs of glaucoma assessed by the ophthal-
                 a histogram analysis. It was suggested that no single combina-                     mologist. For a subset of 44 cases including 24 glaucomatous
                 tion works best for all cases. CDRs are determined with mean                       and 20 nonglaucomatous eyes, two other ophthalmologists, who
                 errors of 0.11 for 40 test cases by using a neural network and a                   also specialize in glaucoma diagnosis, provided the outlines of
                 support vector machine for combining these results.                                the cup and disc for evaluation of inter-reader variability.
                     Corona et al. investigated an automated method for gener-
                 ating a 3D map of an optic disc by using stereo image pairs.8
                 Disparities of the stereo pair are found by the cross-correlation                  2.2 Test Dataset
                 of edge-enhanced images for creating the 3D map. Using the 3D                      For evaluating the usefulness of the automated measurement of
                 map, the cup and disc are segmented semi-automatically, and                        the CDR in distinguishing between glaucomatous and normal
                 the length and volumes are measured. Glaucoma progression                          eyes, additional image data were collected. Images were ob-
                 was evaluated in three patients, and the results agreed well with                  tained from patients who visited Gifu University Hospital from
                 manual evaluations. Abramoff et al. proposed an automated cup                      May 2007 to June 2008 by using the same stereo camera. For
                 and disc segmentation method on stereo fundus images by a                          each patient, a pair of images with one eye of better image qual-
                 pixel classification method.9 The k-nearest neighbor algorithm                     ity was selected. The diagnoses and outlines of cup and disc
                 with 12 features is employed for the classification of pixels into                 were provided by ophthalmologist A. This test dataset consists
                 cup, rim, or background. The CDRs are determined by taking                         of 98 cases, including 60 images with signs of glaucoma and 38
                 the ratio of the numbers of pixels classified as the cup to cup-                   images without signs.
                 and-rim, which correlate well with the reference standard on
                 58 cases of glaucoma or suspected glaucoma. Another method
                 for automated assessment of ONH using stereo fundus images
                                                                                                    3 Methodology
                 was proposed by Xu et al.10 In their method, the disparity is de-                  The automated scheme for determination of the CDR consists
                 termined by two matching methods, i.e., cross-correlation and                      of segmentation of the disc by using the canny edge detector and
                 minimum feature difference, for 3D reconstruction of the ONH.                      the active contour method, reconstruction of a depth map based
                 A deformable model is employed for segmenting the optic disc,                      on the stereo disparity, segmentation of cup by polar boundary
                 and the cup margin is located at a certain distance posterior to                   searching, and measurement of the CDR. The flowchart of the
                 the disc margin. Although automated measurement of the disc                        overall scheme is shown in Fig. 1.
                 area agreed well with manual measurements on 54 test cases,
                 correlations for the rim area and the CDR were moderate be-
                                                                                                    3.1 Determination of Disc Outline
                 cause of a strong dependence of cup segmentation on the results
                 of disc segmentation.                                                              The automated schemes for the determination of the disc bound-
                     In our previous study, an automated method for reconstruct-                    ary were investigated and described in detail in our previous
                 ing a depth map by using a stereo fundus image pair was                            study.14 A brief description is provided here. In this study, we
                 investigated.13 In this study, the cup region is automatically
                 segmented using the depth map. With an automatic disc seg-
                 mentation method developed previously,14 the CDRs are de-
                 termined and compared with those determined on the basis of
                 manual segmentations by an ophthalmologist. The method is
                 applied to a new test database, and the usefulness of the CDR
                 for classification of glaucomatous and nonglaucomatous cases
                 is evaluated.

                 2 Image Data
                 2.1 Training Dataset
                 The initial database consists of 80 stereo retinal fundus image
                 pairs, which are used for developing our automated scheme. The
                 images were obtained from volunteers and from patients who
                 visited the ophthalmology department at Gifu University Hos-                       Fig. 1 A flowchart of the overall scheme for measurement of cup-to-
                 pital, Japan from March 2006 to April 2007 using stereo retinal                    disc ratio.

                 Journal of Biomedical Optics                                              096009-2                                        September 2011 r Vol. 16(9)

Downloaded From: https://www.spiedigitallibrary.org/journals/Journal-of-Biomedical-Optics on 07 Jan 2022
Terms of Use: https://www.spiedigitallibrary.org/terms-of-use
Muramatsu et al.: Automated determination of cup-to-disc ratio for classification...

                employed the active contour model, namely Snakes.15 Only the                       three color channels if the contrast, which is defined as the dif-
                first image (left image) of a pair was used for disc segmentation                  ference between the highest and lowest pixel values in a 21
                because the image quality is usually better in the first image.                    ×21 pixel region, is larger than 10. The disparities found in
                First, an approximate location of the disc was detected by a p-                    the three channels are averaged if the cross-correlation coeffi-
                tile thresholding method16 applied on the red channel of RGB                       cients are larger than 0.5. A search for the corresponding point
                images. The Canny edge detector17 was applied to a region of                       is performed within the range of 41×23 pixels, i.e., + 15 and
                interest (ROI) of 600×600 pixels in size extracted about the de-                   -5 pixels in the horizontal direction and ± 1 pixel in the vertical
                tected location. Using the edge information, the disc outline was                  direction. If the corresponding point is not found because of the
                initialized and adjusted by using the Snakes algorithm. Finally,                   low contrast or low cross-correlation coefficient, the disparity
                the outline was fitted by an ellipse for potentially reducing errors               is interpolated by the surrounding points. The depth image is
                on cases with unclear margins and peripapillary chorioretinal at-                  created on the basis of the disparity and smoothed using the
                rophy (PPA).                                                                       median filter and averaging filter for reducing the noise.

                3.2 Reconstruction of Depth Map                                                    3.3 Determination of Cup Outline
                A detailed description for stereo disparity determination can be                   In our previous study,13 a median filter of 5×5 pixels and an
                found elsewhere.13 The process of creating the depth map is                        averaging filter of 3×3 pixels were used for noise reduction
                shown in Fig. 2. First, the right and left images are registered                   on the depth map on the basis of a comparison with the HRT
                to remove disparity due to patients’ motion and to extract ROIs                    topographic images. In this study, larger smoothing kernels of
                from the right images [Fig. 2(a)]. The corresponding ROI is                        11×11 and 5×5 pixels for the median and averaging filters,
                found by cross-correlation of the images calculated without the                    respectively, are employed for determining smooth contours.
                disc region. The disc region is excluded because the “real” dis-                   The median and averaging filters are applied three and two
                parity due to depth exists in this region. Subsequently, at every                  times, respectively. The contrast of the depth maps is linearly
                four pixels in horizontal and vertical directions of the left image,               enhanced between the deepest and shallowest points. Figure 3
                matching points on the right image are identified on the basis                     shows a left image, the HRT topographic image of the same eye,
                of the highest cross-correlation coefficients in regions of 21                     and the depth maps before and after the noise reduction.
                ×21 pixels [Fig. 2(b)]. The cross-correlation is calculated in                        The cup margin is determined by searching for edges in
                                                                                                   radial directions on the depth maps. The algorithm starts by
                                                                                                   determining the center of the cup. First, a binary image is created
                                                                                                   with a threshold of depth at 0.9 of the deepest depth inside
                                                                                                   the disc region. The centroid of the binarized region, which
                                                                                                   includes the deepest point, is determined as the center of the
                                                                                                   cup. By setting the center pixel as an origin, the depth map is

                Fig. 2 Process of reconstructing the depth map. (a) Identification of
                corresponding ROI position by scanning the left image. Disc region
                (black circle) was disregarded in order to account for disparity due
                to motion and not for real disparity due to depth. (b) Determination               Fig. 3 Depth maps of the optic nerve head. (a) Original left image,
                of disparity by finding the corresponding points at every four pixels              (b) topographic image obtained by Heidelberg retina tomograph,
                (white dots) based on the correlation coefficient for 21×21 pixel ROIs             (c) depth map reconstructed on the basis of the stereo disparity without
                (squares) within the searching range (dotted rectangle).                           noise reduction, and (d) depth map after the noise reduction process.

                Journal of Biomedical Optics                                              096009-3                                          September 2011 r Vol. 16(9)

Downloaded From: https://www.spiedigitallibrary.org/journals/Journal-of-Biomedical-Optics on 07 Jan 2022
Terms of Use: https://www.spiedigitallibrary.org/terms-of-use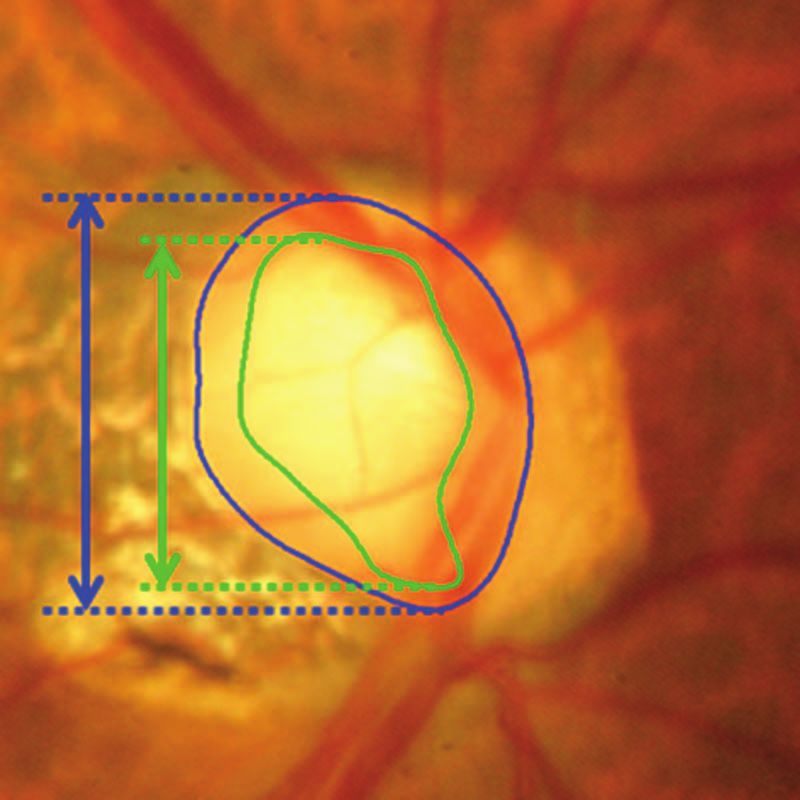
Muramatsu et al.: Automated determination of cup-to-disc ratio for classification...

                                                                                                    Fig. 5 Measurement of cup-to-disc ratio for a tilted disc. The outlines
                                                                                                    of cup and disc are provided by ophthalmologist A.

                                                                                                    and disc regions,18 as shown in Fig. 5. The CDRs are measured
                 Fig. 4 Cup determination process by polar boundary searching.                      in the same manner using the outlines determined by the ophthal-
                 (a) Depth map, (b) depth map transformed to the polar coordinate                   mologists for the training dataset (“reference standard”) and by
                 system, (c) radial edge image, (d) initial cup boundary, (e) boundary              the automated scheme for the training and test datasets. There-
                 after interpolation, (f) boundary after smoothing, and (g) final disc and          fore, the reference standard CDRs are not directly measured
                 cup outlines determined by the automated scheme.
                                                                                                    by the ophthalmologists, but rather are indirectly determined
                                                                                                    from the outlines. The diagnostic ability of the CDR is tested
                 transformed to a polar coordinate system, as shown in Fig. 4(b),                   for classifying the glaucomatous and nonglaucomatous eyes.
                 where the horizontal axis corresponds to the radial angles with                    The classification performance is evaluated using the receiver
                 an increment of about 0.45 deg and the vertical axis corresponds                   operating characteristic (ROC) analysis by using the software
                 to the distance from the origin up to 255 pixels. Note that the                    (PROPROC, The University of Chicago).19
                 pixel values are inverted in Fig. 4 so that the deeper the points,
                 the whiter the pixels. The pixels outside the disc region are
                                                                                                    4 Result
                 disregarded (black pixels in Fig. 4).
                     A radial edge image is produced simply by subtracting the                      4.1 Inter-reader Variability on Cup and Disc
                 pixel values at a distance of 10 pixels away in the vertical (radial)                  Determination
                 direction, as shown in Fig. 4(c). In each column, the position of                  For 44 cases in the training set, manual outlines of the cup and
                 the maximum radial gradient point with the edge strength above                     disc were provided by three ophthalmologists. The agreement
                 a prespecified value, if it exists, is searched and considered as                  of the cup and disc regions was evaluated by an overlap mea-
                 the cup boundary. The threshold edge strength is experimentally                    sure, which is defined as a ratio of the area of intersection to the
                 set at 50. For columns where a boundary is not found, it is inter-                 area of union. Table 1 summarizes the inter-reader variability.
                 polated using 5 columns from the first boundary found in each                      The agreements for the disc regions between the three ophthal-
                 direction. For interpolation, the average of the radial distances                  mologists were high and equivalent for the glaucomatous and
                 weighted by the edge strengths is employed to account for more                     nonglaucomatous cases. On the other hand, the agreements for
                 reliable boundary points. Finally, the boundary is smoothed by                     the cup regions were lower, especially for the nonglaucomatous
                 taking the running average. Figures 4(d)–4(f) show the initial
                 boundary points, the boundary after the interpolation, and the
                                                                                                    Table 1 Average overlap measures for cup and disc regions manually
                 smoothed boundary, respectively. The cup boundary determined
                                                                                                    determined by three ophthalmologists.
                 in the polar coordinate is translated back to the Cartesian coor-
                 dinate system, as shown in Fig. 4(g).
                                                                                                                                 Disc                       Cup

                                                                                                    Ophthalmologist    A vs B   B vs C   A vs C   A vs B   B vs C   A vs C
                 3.4 Measurement of CDR
                 In early stages of glaucoma, thinning of the rim often appears in                  Glaucoma           0.92     0.92     0.92      0.73    0.84      0.71
                 the upper or lower parts of an optic disc. Therefore, ophthalmol-
                 ogists usually evaluate the CDR in a vertical direction. In this                   Non-glaucoma       0.92     0.92     0.92      0.52    0.76      0.48
                 study, the CDR is defined as a ratio of vertical distances between
                                                                                                    All                0.92     0.92     0.92      0.63    0.80      0.60
                 pixels at the highest and lowest vertical positions inside the cup

                 Journal of Biomedical Optics                                              096009-4                                         September 2011 r Vol. 16(9)

Downloaded From: https://www.spiedigitallibrary.org/journals/Journal-of-Biomedical-Optics on 07 Jan 2022
Terms of Use: https://www.spiedigitallibrary.org/terms-of-use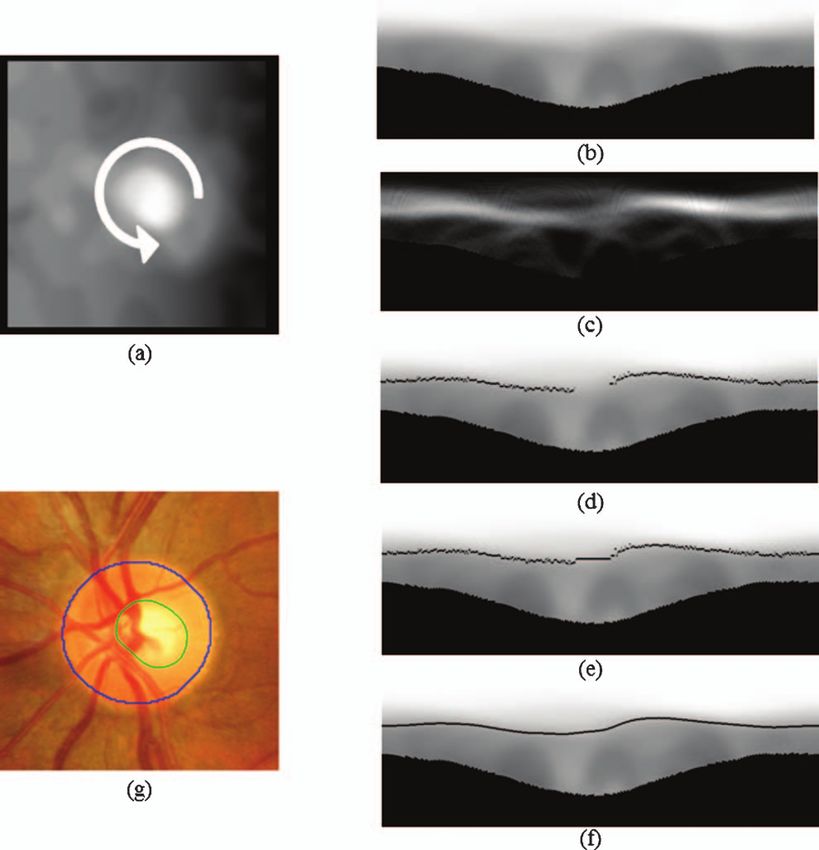
Muramatsu et al.: Automated determination of cup-to-disc ratio for classification...
Table 2 Average differences in vertical cup-to-disc ratios (CDRs) by
three ophthalmologists.
CDR
Ophthalmologist A vs B B vs C A vs C
Glaucoma 0.09 0.05 0.08
Non-glaucoma 0.20 0.08 0.21
All 0.14 0.06 0.14
cases. The average differences in the CDR were determined
using the three ophthalmologists’ outlines which are shown in
Table 2. The same trend was observed in these results. The Pear-
son’s correlation coefficients between the CDRs determined by
ophthalmologist A and B, B and C, and A and C are 0.90, 0.83,
and 0.87, respectively.
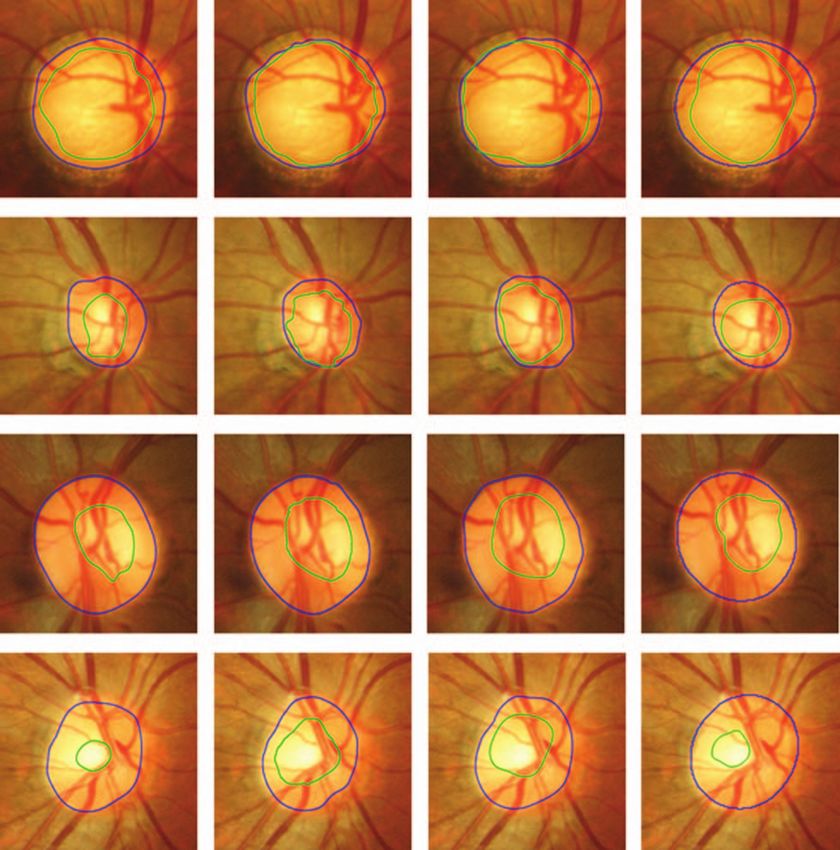
4.2 Results of Cup and Disc Segmentation on the
Fig. 6 Cup and disc outlines determined by the three ophthalmologists
Training Dataset and automated scheme. The left three columns are ones by the ophthal-
The results for the automatic segmentation of the cup and disc mologists. First row: glaucomatous eye with good agreement. Second
regions on the 80 training cases are summarized in terms of row: glaucomatous eye with large variation. Third row: nonglaucoma-
tous eye with good agreement. Fourth row: nonglaucomatous eye with
the average overlap measures and errors in CDRs with respect
large variation.
to the reference standard in Table 3. The average overlap mea-
sure for the disc regions was slightly lower than those between
the three ophthalmologists, whereas the average overlap mea- calculates the ROC curve by varying the threshold on the like-
sure for the cup regions was comparable to those between oph- lihood ratio, which is the function of the CDR. The threshold is
thalmologists A and B, and A and C. Note that while the num- gradually changed to create smooth curves, and the areas under
ber of cases for these results are different, the similar results the ROC curve (AUC) for distinction between glaucomatous
were obtained for the subset of 44 cases. Figure 6 shows the and nonglaucomatous eyes was determined, which was 0.91 for
cup and disc outlines provided by the three ophthalmologists the training dataset.
and the automated scheme for the glaucomatous and nonglau-
comatous eyes. The correlation coefficient between the CDRs
determined by ophthalmologist A and the automated scheme 4.3 Classification between Glaucomatous and
was 0.74. The results of automated and semi-automated meth- Nonglaucomatous Eyes
ods by the other groups in terms of correlation coefficients be- Automated segmentation techniques were applied to the test
tween manual CDRs and computer-determined CDRs ranged dataset. Because the reference standard for the cup and disc out-
from 0.67 and 0.99;8–10 however, the results cannot be directly lines in the test dataset does not exist, the segmentation accuracy
compared because the cases used are different, and the difficul- cannot be evaluated. Figure 7 shows the box plot of the automati-
ties of the cases are unknown. Note that in one of the studies,8 cally determined CDRs for the glaucomatous and nonglaucoma-
the correlation coefficient was determined for each patient for tous eyes. The result indicates the CDRs for most glaucomatous
the three longitudinal changes, which could apparently yield a cases are higher than those for nonglaucoma cases. Using the
higher correlation. When the CDRs are inputted, the software CDRs, an AUC of 0.90 was obtained. With a threshold of 0.7
according to the Japanese guideline, a sensitivity of 87% and a
specificity of 82% were obtained.
Table 3 Average overlap measures for the cup and disc segmentation
results and errors in CDR in the 80 training cases.
5 Discussion
Overlap measure
In this study, an automated scheme for measuring the CDR
Disc Cup Error in CDR on stereo retinal fundus images and its ability to discriminate
eyes with and without glaucoma-associated signs were inves-
Glaucoma 0.86 0.67 0.10 tigated. For the measurement of the CDR, the cup and disc
regions were automatically segmented using a depth map based
Non-glaucoma 0.88 0.58 0.11 on stereo disparity, and the brightness and edge information
All 0.88 0.61 0.11 on the plain photographs. The manual outlines of the cup and
disc regions were provided by an expert ophthalmologist for
Journal of Biomedical Optics 096009-5 September 2011 r Vol. 16(9)
Downloaded From: https://www.spiedigitallibrary.org/journals/Journal-of-Biomedical-Optics on 07 Jan 2022
Terms of Use: https://www.spiedigitallibrary.org/terms-of-useMuramatsu et al.: Automated determination of cup-to-disc ratio for classification...
ble. The over-extraction of PPA in the disc segmentation often
causes over-extraction in the cup segmentation. In the future,
detection of the PPA region should be considered for improving
segmentation accuracy. For cases with a small cup and/or disc,
a small shift of segmented regions with respect to the reference
standard can strongly degrade the overlap measure, and a small
difference in diameters can result in a large error in the CDR.
This is one of the reasons that the average overlap measure was
lower for the nonglaucoma cases.
The proposed method was applied to the test cases, and the
ability of automatically-determined CDRs to distinguish glau-
comatous and nonglaucomatous eyes was evaluated. A high
AUC of 0.90 was obtained, indicating the potential utility of
computer analysis in screening glaucoma when a glaucoma spe-
Fig. 7 Box plots for the CDRs of the glaucomatous and nonglaucoma-
tous eyes in the test cases. The bars specify the ranges of CDRs, and the cialist is absent. Computer analysis may increase the diagnostic
boxes specify the first and third quartiles with the medians represented efficiency and improve intra- and inter-reader consistency for
by the center lines. follow-up monitoring by providing the quantitative data. How-
ever, the actual practicality and diagnostic utility of the proposed
method must be assessed by the observer performance study and
the training dataset, which were used as the reference standard clinical study. The comparable AUCs obtained for the training
for tuning the automated scheme. For the subset of 44 cases, and test cases indicate that consistent results can be expected in
outlines were also provided by two other experts. There were segmenting cup and disc regions in images with similar qual-
good agreements for the disc regions determined by the three ity. Note that distinction of glaucomatous and nonglaucomatous
ophthalmologists, while the agreements for the cup regions were eyes may be more difficult for the test cases than for the training
not as high. When manual outlines were obtained, there was no cases, because the training cases include images acquired from
specific guideline as to where the outlines should be placed. the student volunteers. One limitation of this study is that one
Therefore, one could delineate the bottom of the cup, while an- ophthalmologist determined the diagnosis based only on the im-
other could select the entrance of the cup as the margin. It may age findings, rather than on more concrete data such as those
have caused the observed differences especially for cases with from visual field tests. However, the purpose of the computer
“sloping cup” whose depth changes gradually. This is a prob- analysis is not an automatic diagnosis, but to provide quantita-
able reason for the lower agreements for the nonglaucomatous tive data or to suggest a possible disease condition to doctors for
cases than for the glaucomatous cases. The results summarized cases in which an expert ophthalmologist would be alerted to.
in Tables 1 and 2 suggest that the judgment by ophthalmologist In the future, an acquisition of definite diagnosis or diagnosis
A is slightly different from those of the other two ophthalmol- by multiple experts is desirable.
ogists. However, the inter-reader correlation coefficients on the
CDRs determined by ophthalmologists A and B and by ophthal-
mologists A and C were higher than that by ophthalmologists 6 Conclusion
B and C, indicating consistent diagnostic assessments between An automated analysis of ONH on stereo fundus images was
the ophthalmologists. investigated. The disc region was segmented on the basis of
For the 80 training cases, good agreement for the disc outlines the image brightness and edge information. The segmentation
determined by ophthalmologist A and the automated scheme of the cup region was performed using the depth map, which
was obtained. For some cases with PPA, no clear edge was was reconstructed using the disparity in the stereo image pairs.
detected at the disc margin. As a result, the disc region was A relatively high agreement for the disc regions determined by
over-extracted. This is likely the main reason for the slightly the ophthalmologist and the automated scheme was obtained,
lower overlap measures for glaucomatous cases than those for whereas the agreement for the cup regions was moderate, but
nonglaucomatous cases. On the other hand, the presence of PPA within the range of the inter-reader agreement. When the method
apparently did not affect the experts’ decisions on where the was applied to the test dataset, most images of glaucomatous
margin lies. Because PPA frequently appears on the tempo- eyes could be correctly distinguished from those without signs
ral side of the optic disc, the over-extraction of the disc did of glaucoma using the CDR. The automated determination of
not strongly affect the measurement of the vertical CDR. The the CDR can be useful for improving the diagnostic efficiency
agreement for the cup regions determined by ophthalmologist by providing the quantitative data especially to doctors with
A and the automated scheme was lower, but within the range of limited experience in the diagnosis of glaucoma.
the inter-reader agreements. The successes in reconstructing the
depth maps and segmenting the disc region partly account for
the success in the cup segmentation. When there is no appar- References
ent landmark for matching ROIs because of saturation of pixel
values or an absence of noticeable blood vessels, an accurate 1. H. A. Quigley and A. T. Broman, “The number of people with glau-
coma worldwide in 2010 and 2020,” Br. J. Ophthalmol. 90, 262–267
disparity measurement becomes difficult. Unfortunately, in the (2006).
absence of reference depth data such as HRT data, quantita- 2. A. Iwase, Y. Suzuki, M. Araie, T. Yamamoto, H. Abe, S. Shirato,
tive evaluation of the depth map reconstruction was not possi- Y. Kuwayama, H. K. Mishima, H. Shimizu, G. Tomita, Y. Inoue, and
Journal of Biomedical Optics 096009-6 September 2011 r Vol. 16(9)
Downloaded From: https://www.spiedigitallibrary.org/journals/Journal-of-Biomedical-Optics on 07 Jan 2022
Terms of Use: https://www.spiedigitallibrary.org/terms-of-useMuramatsu et al.: Automated determination of cup-to-disc ratio for classification...
Y. Kitazawa, “The prevalence of primary open-angle glaucoma in 10. J. Xu, H. Ishikawa, G. Wollstein, R. A. Bilonick, K. R. Sung, L.
Japanese; the Tajimi Study,” Ophthalmol. 111(9), 1641–1648 (2004). Kagemann, K. A. Townsend, and J. S. Schuman, “Automated assess-
3. T Yamamoto, A. Iwase, M. Araie, Y. Suzuki, H. Abe, S. Shirato, ment of the optic nerve head on stereo disc photographs,” Invest. Oph-
Y. Kuwayama, H. K. Mishima, H. Shimizu, G. Tomita, Y. Inoue, and thalmol. Visual Sci. 49(6), 2512–2517 (2008).
Y. Kitazawa, “The Tajimi Study report 2: prevalence of primary angle 11. J. Nayak, Rajendra Acharya U., P. S. Bhat, N. Shetty, and T. C. Lim,
closure and secondary glaucoma in a Japanese population,” Ophthal- “Automated diagnosis of glaucoma using digital fundus images,” J.
mol. 112(19), 1661–1669 (2005). Med. Syst. 33, 337–346 (2009).
4. M. G. Hattenhauer, D. H. Johnson, H. H. Ing, D. C. Herman, D. O. 12. D. W. K. Wong, J. Liu, J. H. Lim, N. M. Tan, Z. Zhang, S. Lu, H. Li,
Hodge, B. P. Yawn, L. C. Butterfield, and D. T. Gray, “The probability M. H. Teo, K. L. Chan, and T. Y. Wong, “Intelligent fusion of cup-to-
of blindness from open-angle glaucoma,” Ophthalmol. 105, 2099–2104 disc ratio determination methods for glaucoma detection in ARGALI,”
(1998). Conf. Proc. IEEE Eng. Med. Biol. Soc. 2009, 5777–5780 (2009).
5. Y. Suzuki, A. Iwase, M. Araie, T. Yamamoto, H. Abe, S. Shirato, 13. T. Nakagawa, T. Suzuki, T. Hayashi, Y. Mizukusa, Y. Hatanaka,
Y. Kuwayama, H. K. Mishima, H. Shimizu, G. Tomita, Y. Inoue, and K. Ishida, T. Hara, H. Fujita, and T. Yamamoto, “Quantitative depth
Y. Kitazawa, “Risk factors for open-angle glaucoma in a Japanese pop- analysis of optic nerve head using stereo retinal fundus image pair,”
ulation,” Ophthalmol. 113(9), 1613–1617 (2006). J. Biomed. Opt. 13(6), 064026 (2008).
6. R. Varma, G. L. Spaeth, W. C. Steinmann, and L. J. Katz, “Agreement 14. C. Muramatsu, T. Nakagawa, A. Sawada, Y. Hatanaka, T. Hara,
between clinicians and an image analyzer in estimating cup-to-disc T. Yamamoto, and H. Fujita, “Automated segmentation of optic disc
ratios,” Arch. Ophthalmol. 107(4), 526–529 (1989). region on retinal fundus photographs: comparison of contour modeling
7. J. M. Tielsch, J. Katz, H. A. Quigley, N. R. Miller, and A. Sommer, and pixel classification methods,” Comput. Methods Programs Biomed.
“Intraobserver and interobserver agreement in measurement of optic 101, 23–32 (2011).
disc characteristics,” Ophthalmol. 95(3), 350–356 (1988). 15. M. Kass, A. Witkin, and D. Terzopoulos, “Snakes: active contour mod-
8. E. Corona, S. Mitra, M. Wilson, T. Krile, Y. H. Kwon, and P. Soliz, els,” Int. J. Comput. Vis. 1, 321–331 (1988).
“Digital stereo image analyzer for generating automated 3-D measures 16. J. R. Parker, Algorithms for Image Processing and Computer Vision,
of optic disc deformation in glaucoma,” IEEE Trans. Med. Imaging pp. 116–127, Wiley Computer Publishing, New York (1997).
21(10), 1244–1253 (2002). 17. J. Serra, “Introduction to mathematical morphology,” Comput. Vis.
9. M. D. Abramoff, W. L. M. Alward, E. C. Greenlee, L. Shuba, C. Y. Graph. Image Process. 35, 283–305 (1986).
Kim, J. H. Fingert, and Y. H. Kwon, “Automated segmentation of the 18. J. Gloster and D. G. Parry, “Use of photographs for measuring cupping
optic disc from stereo color photographs using physiologically plausible in the optic disc,” Br. J. Ophthalmol. 58, 850–863 (1974).
features,” Invest. Ophthalmol. Vis. Sci. 48(4), 1665–1673 (2007). 19. Available at: http://metz-roc.uchicago.edu/MetzROI/software.
Journal of Biomedical Optics 096009-7 September 2011 r Vol. 16(9)
Downloaded From: https://www.spiedigitallibrary.org/journals/Journal-of-Biomedical-Optics on 07 Jan 2022
Terms of Use: https://www.spiedigitallibrary.org/terms-of-useYou can also read