Attributable human-induced changes in the magnitude of flooding in the Houston, Texas region during Hurricane Harvey
←
→
Page content transcription
If your browser does not render page correctly, please read the page content below
Climatic Change (2021) 166: 20
https://doi.org/10.1007/s10584-021-03114-z

Attributable human-induced changes in the magnitude
of flooding in the Houston, Texas region
during Hurricane Harvey

Michael Wehner 1          & Christopher Sampson
                                                        2

Received: 2 October 2020 / Accepted: 26 April 2021 / Published online: 19 May 2021
# The Author(s) 2021

Abstract
The human influence on precipitation during tropical cyclones due to the global warming
is now well documented in the literature. Several studies have found increases in
Hurricane Harvey’s total precipitation over the Greater Houston area ranging from the
Clausius-Clapeyron limit of 7% to as much as 38% locally. Here we use a hydraulic
model to translate these attribution statements about precipitation to statements about the
resultant flooding and associated damages. We find that while the attributable increase in
the total volume of flood waters is the same as the attributable increase in precipitation,
the attributable increase in the total area of the flood is less. However, we also find that in
the most heavily flooded parts of Houston, the local attributable increases in flood area
and volume are substantially larger than the increase in total precipitation. The results of
this storyline attribution analysis of the Houston flood area are used to make an intuitive
best estimate of the cost of Hurricane Harvey attributable to anthropogenic global
warming as thirteen billion US dollars.

Keywords Hurricane Harvey . Flooding . Global warming . Economic cost of climate change

1 Introduction

At an estimated cost of 85–125 billion USD (https://coast.noaa.gov/states/fast-facts/hurricane-
costs.html), Hurricane Harvey is the 2nd most expensive US tropical cyclone after adjustment
for inflation. Damages were principally due to freshwater inland flooding resulting from the
copious amounts of precipitation endured during the storm’s extended stall over the greater
Houston, Texas region from 26 to 31 August 2017. According to a report by the Harris County

* Michael Wehner
  mfwehner@lbl.gov

1
    Lawrence Berkeley National Laboratory, 1 Cyclotron Rd, Berkeley, California 94720, USA
2
    Fathom, Engine Shed, Bristol BS1 6QH, UK
20 Page 2 of 13                                                       Climatic Change (2021) 166: 20

Flood Control District, over 154,000 structures and 600,000 cars were flooded with 37,000
people relocated to shelters (Abbot et al. 2018). Furthermore, although well forecasted, most of
the 70+ direct deaths were due to drowning in deep floodwaters (Halverson 2018; Jonkman
et al. 2018). Soon after the event, a number of rapid attribution studies were published finding
that the effects of anthropogenic global warming on the storm’s precipitation totals were
significant (Emanuel 2017; Risser and Wehner 2017; van Oldenborgh et al. 2017; Wang et al.
2018). The latter three of these studies concluded that estimated lower bound on the anthro-
pogenic increase in precipitation over the entire area was at least in accordance with Clausius-
Clapeyron (C-C)-scaled increases (6–7%/C) of saturation specific humidity from the ~1C of
attributable warming in the Gulf of Mexico (Stone et al. 2019). However, best estimates of the
effect of this warming on Harvey’s precipitation in these studies were considerably larger (up
to 24%). Trenberth et al. (2018) also concluded that record high ocean heat content, partly
attributable to human consumption of fossil fuels, led to increased evaporation and hence
precipitation. Kossin (2018) recently found that the translational speeds of North Pacific and
North Atlantic tropical cyclones have significantly slowed since 1949. However, whether this
slowdown is attributable to global warming is presently unknown, and Harvey’s stall was
indeed a rare and very different phenomena. Finally, Patricola and Wehner (2018) recently
found that while the expected anthropogenically induced increases in tropical cyclone maxi-
mum winds speeds may not have yet emerged, a human influence on precipitation has likely
emerged in the most intense tropical cyclones. They also found locally super Clausius-
Clapeyron scaling in the heaviest precipitation regions of some storms due to storm structural
changes. This provides a plausible physical explanation for the magnitude of these best
estimate Harvey attribution statements as the greater Houston area had the misfortune of being
in that part of the storm.
    However, changes in flood properties may not be linearly proportional to changes in
extreme precipitation due to the complexities of the local hydrological properties. This study
uses the previously published estimates of Harvey’s attributable precipitation increase due to
global warming as a forcing factor to a series of hydraulic model simulations to more directly
investigate the anthropogenic influence on the Harvey flood. The hydraulic simulations in this
study are undertaken using the Fathom-US large-scale hydraulic modeling framework. The 30-
m resolution US variant of the hydraulic modeling framework employed here is described by
Wing et al. (2017), with the US variant itself being a development of the original global
hydraulic model framework of Sampson et al. (2015). The model is able to represent both
fluvial (riverine), pluvial (rainfall), and surge (coastal) flood hazards by generating (or being
provided with) appropriate boundary conditions before solving simplified forms of the Saint-
Venant shallow water equations over a regular 2D grid to simulate the flow of water across the
land surface (Bates et al. 2010). The model explicitly represents both floodplain and in-channel
flows using a subgrid method based on the principles outlined by Neal et al. (2012)).
    The US-variant of the model has been extensively validated against the entire FEMA flood
hazard catalog for the conterminous USA, demonstrating its ability to approach the accuracy
of traditional local scale flood models (Wing et al. 2017). The specifics of the model setup
deployed here for the Hurricane Harvey scenario simulations, and a detailed assessment of
model performance relative to observations, are fully presented in Wing et al. (2019)). In
summary, Wing et al. (2019) show the baseline simulation to describe the observed flooding of
the greater Houston area well, with 78% of the observed wet pixels correctly identified as
flooded, and only 17% of observed dry pixels are incorrectly identified as flooded. Overall, the
ratio of type I to type II errors is 1.42, indicating that the hydraulic model tends to slight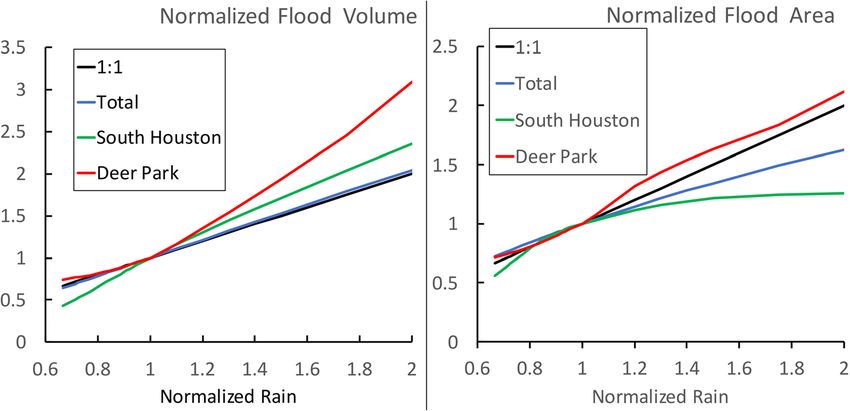
Climatic Change (2021) 166: 20 Page 3 of 13 20
overprediction of flooding. Furthermore, the simulated high-water marks are on average about
1 m lower than observed (itself with an estimated confidence interval of ±0.5 m). For context,
these errors compare favorably to the NOAA NWM-HAND model (Arctur 2018), which
correctly identified only 46% of wet pixels while identifying 16% of observed dry pixels as
wet to yield a large negative error bias of 0.31 under the same conditions (Wing et al. 2019).
The extensively validated nature of the underlying model physics, coupled with the previously
published validation of this particular model configuration against observations in the after-
math of Hurricane Harvey, demonstrates this model to be an appropriate tool with which to
explore the sensitivity of the Greater Houston area flooding to perturbations in precipitation.
The design of our numerical experiments is straightforward. As a baseline flood, the
hydraulic model is forced by observed 5-day accumulated precipitation estimates (26–30
August inclusive) obtained from the NOAA National Weather Service Advanced Hydrologic
Prediction Service (https://water.weather.gov/precip/about.php). The effect of climate change
on the Harvey flood is then explored by uniformly reducing the observed precipitation by a
factor inversely proportional to the published attribution statements on precipitation
magnitude. For instance, Risser and Wehner (2017) wrote that their best estimate was that
climate change increased the total accumulated precipitation across the region by 24%. The
simulated non-anthropogenic flood associated with this attribution statement is obtained by
reducing the observed precipitation used to drive the hydraulic model by a factor of 1/1.24 = 0.
81. We explore the sensitivity of Harvey flood statistics to a range of precipitation totals
spanning 2/3 to twice the observed amount. A set of attribution statements about the simulated
Harvey flood properties on 31 August 2017 can be then be made from those simulations
corresponding to the published Harvey precipitation attribution statements.
Baseline river flows were set to 50% of bankfull discharge, and initial soil conditions were
dry at the start of each simulation. Given the overwhelmingly extreme nature of Hurricane
Harvey precipitation, model sensitivity to antecedent conditions such as soil saturation is
minimal as soil infiltration capacity is almost immediately exceeded due to the very high
rainfall intensities and total rainfall volumes. The antecedent conditions are kept the same for
every simulated scenario. Of course, under climate change, it may be the case that the
probability of wetter or drier antecedent conditions will change; however, there are so many
degrees of freedom to antecedent conditions that they are currently beyond the scope of
experiment within this study.
This type of extreme event attribution study is often termed a “storyline” approach
(Shepherd 2016) as only a portion of the relevant factors is investigated. In addition to
precipitation increases from climate change, other anthropogenic influences such as urbaniza-
tion (Zhang et al. 2018; Sebastian et al. 2019) and land subsidence (Miller and Shirzaei 2019)
are important factors in assessing overall flood risk. As a result, the attribution statements in
this study are high conditional on only the climate change aspects of the total change in flood
risk (Wehner et al. 2019). There are a few other studies completing the chain of attribution
from extreme precipitation to flooding to financial losses. Kay et al. (2018) examined the
change in flood risk in Great Britain during the winter of 2013/2014 by driving a nationwide
hydrological model by very large ensembles of a regional climate model under realistic
conditions and a variety of counterfactual conditions with the effects of anthropogenic
climate change removed. Earlier, Schaller et al. (2016) used the same set of regional model
simulations to drive a hydrological model of the Thames river catchment rather than the
entirety of Great Britain. These analyses, as is the Frame et al. (2020) analysis of Hurricane
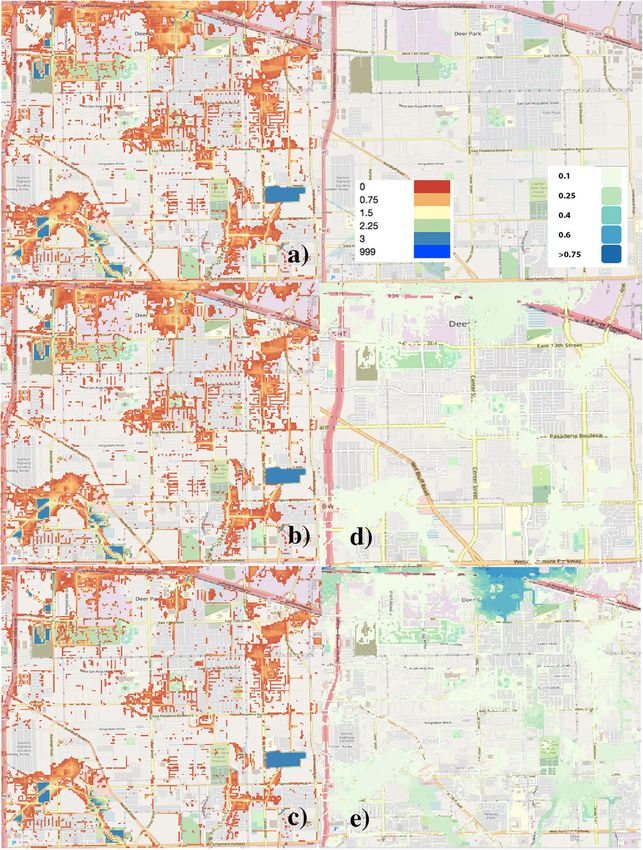
Harvey attributable economic costs, used the change in probability and the associated20 Page 4 of 13 Climatic Change (2021) 166: 20 fractional attributable risk of the flood properties of these events to estimate the damages resulting from the human interference in the climate system. The present study differs in that it uses a hydraulic model and perturbations to observed precipitation to estimate the detailed geographical changes in flood area and associated economic costs. All of these studies find that the attributable changes in flood damages depend greatly on the assumptions made about how much anthropogenic climate change has affected the precipitation responsible for the flood. 2 Large-scale results Figure 1 shows the simulated floodwater volume and area as a function of rainfall with each axis normalized by the amounts in the experiment driven by observed precipitation. The left panel of Fig. 1 reveals that the total volume of floodwater (blue line) across the flooded region corresponds to the precipitation amount throughout the range of values explored with a nearly 1:1 relationship. This close correspondence is a result of two circumstances. First, precipitation rates in these simulations are very large causing the soil to be completely saturated very early in the storm. Second, due to the flat Houston topography, the floodplain drains to the sea relatively slowly compared to these large precipitation rates. Flood area is more complex because it describes the distribution of the floodwater volume around the domain. The right panel of Fig. 1 shows that the total area flooded (blue line) to a depth greater than 20 cm as function of normalized precipitation is sub-linear due to the non- uniform topography of the Greater Houston area and the mix of fluvial and pluvial flooding. Note that we choose to exclude flood depths less than 20 cm as this is the typical threshold at which damages start to occur for residences (UK Environment Agency 2019). Table 1 summarizes large-scale attribution statements about flooding corresponding to the previously published attribution statements about Hurricane Harvey precipitation. Correspond- ing to Fig. 1, the attributable increase in floodwater volume is nearly equal to the attributable increase in storm total precipitation, while the attributable increase in flood area at depths greater than 20 cm is somewhat less. Fig. 1 Hurricane Harvey floodwater normalized volume (left) and normalized area (right) as a function of normalized precipitation over the entire greater Houston area (blue), the South Houston neighborhood (green), and the Deer Park neighborhood (red). A 1:1 line is shown in black for reference
Climatic Change (2021) 166: 20                                                            Page 5 of 13 20

Table 1 Attributable large-scale flood area and volume increases associated with published precipitation
magnitude attribution statements (units: volume = 106 m3; area = km2). RW Risser and Wehner 2017, VO van
Oldenborgh et al. 2017, W Wang et al. 2018

Source                             Attributable        Rainfall      Attributable flood
                                   precipitation       coefficient
                                   increase                          Greater      South     Deer Park
                                                                     Houston      Houston &
                                                                                  Pasadena

                                                                     Vol. Area Vol. Area Vol. Area

RW Best estimate (small region);   38%                 0.72          39% 29% 87% 52% 25% 31%
   W upper bound
RW Best estimate large region)     24%                 0.81          25% 18% 48% 25% 18% 21%
W best estimate                    20%                 0.83          20% 15% 38% 20% 16% 18%
RW likely lower bound (small       19%                 0.84          19% 14% 36% 18% 15% 18%
   region); VO upper bound
W lower bound                      13%                 0.88          13% 10% 23% 11% 11% 12%
VO lower bound                     8%                  0.93          8% 6% 14% 6% 7% 7%
RW likely lower bound; large       7%                  0.93          7% 5% 12% 5% 6% 6%
   region
actual                             0%                  1.00          0%    0%     0%      0%   0%   0%

3 Flooding at local scales

While the large-scale flood characteristics are of academic interest and perhaps useful for
assessing aggregated damages, the increase in risk at very fine local scales is of a more practical
use in assessing the causes of damages to individual homes or neighborhoods. Despite the
relative flatness of the Houston region, complexities of the drainage topography are significant
enough that the effect of climate change on the flood varies considerably at such fine scales.
Some neighborhoods would be flooded even in the absence of climate change, while others
remain dry even if the precipitation was to be significantly increased from the actual amounts, as
should be expected if a similar storm were to occur in a future warmer climate. To illustrate this,
we consider three cases, the actual flood, the lowest attributable precipitation change as dictated
by Clausius-Clapeyron scaling (7%), and the highest attributable precipitation change of 38%
(Risser and Wehner 2017; Wang et al. 2018) for two different neighborhoods.

3.1 South Houston and Pasadena

The South Houston and Pasadena neighborhoods were among the most severely impacted
with 8920 structures flooded (Lindner and Fitzgerald 2018). Figure 2 shows hydraulic model
simulations in these neighborhoods of the actual flood (Fig. 2a) and counterfactual floods
under the best-case scenario of the 7% Clausius-Clapeyron (C-C) scaling of precipitation with
temperature (Fig. 2b) and a worst-case climate change scenario where precipitation was
increased by 38% by climate change (Fig. 2c). This most extreme case best illustrates the
sensitivity of the flood properties but is not necessarily the best estimate of the human effect on
the flood. The amounts of flooding attributable to human influences are the difference of the
perturbed rainfall simulations from the observed rainfall simulation and is shown in Fig. 2d for
the C-C scaling case and in Fig. 2e for the worst-case scenario considered. In both cases, the
depth of additional flooding is fairly uniform in the interior of the inundated region.
20 Page 6 of 13 Climatic Change (2021) 166: 20 This neighborhood contains substantial drainage where floodwater tends to accumulate. Hence, the volume of flood water increases at a greater rate than rainfall in our set of simulations, and the slope of the green line in the left panel of Fig. 1 is greater than unity. Also as a result of this relatively complicated topography compared to the entire domain, the dependence of South Houston flood area on rainfall amount is more nonlinear than Greater Houston. The columns labeled “South Houston” in Table 1 reveal that attribution statements about the flooding in these low-lying neighborhoods (the entire area shown in Fig. 2) are substantially larger than for the entire region. Consistent with Fig. 1, the degree of human influence on the flood in this neighborhood increases at a superlinear rate with the human influence on Harvey’s total precipitation. Comparison of Fig. 2b to Fig. 2a reveals that the anthropogenic increase in the areal extent of the flood due only to Clausius-Clapeyron scaling is rather minor and confined to the perimeter of the flooded area although some of the deeper parts of the flood are made noticeably deeper. However, in the worst-case scenario, large swaths of flooded regions, particularly between the two branches of the Sims Bayou in the center of Fig. 2c, would not be flooded without climate change. Fig. 2 Simulation of the actual and counterfactual flood in the South Houston and Pasadena neighborhoods. a The actual flood that was. b The counterfactual flood that might have been in the absence of climate change if human activities increased Harvey storm total precipitation by 7%. c Same as b except precipitation increased by 38%. d Attributable flooding if human activities increased Harvey storm total precipitation by 7%. e Same as d except precipitation increased by 38%. Rainbow scale is for panels a, b, and c. Blue scale is for panels d and e. Units: meters. 999 denotes areas of permanent water
Climatic Change (2021) 166: 20                                                       Page 7 of 13 20

3.2 Deer Park

Although the Deer Park neighborhood is just to the east of South Houston and Pasadena,
flood damage was considerably less with 820 flooded houses. Figure 3 shows the
hydraulic model simulations in this neighborhood under the same precipitation change
scenarios as in Fig. 2. The flatter terrain in this neighborhood resulted in shallower
floodwater than in South Houston and Pasadena (Fig. 3a–c). The attributable additional
floodwater is also less in this neighborhood (Fig. 3d,e). The columns labeled “Deer Park”
in Table 1 reveal that attribution statements for this less impacted neighborhood are similar
in magnitude to those for the entire region. Figure 1 also shows that for rainfall amounts
less than observed, the flood volume and area scale at similar rates in Deer Park (red line)
as they do for the Greater Houston area (blue line). However, for rainfall amounts greater
than observed, the neighborhood is more severely flooded, and the scaling of flood volume
and area with rainfall amounts exceeds that of the larger region. Again, at the lower bound
of C-C scaling for the anthropogenic precipitation increase, the change in flooding is
minor. Even for the uppermost bound of precipitation increase, the change in flooding is
largest towards the northern part of the neighborhood where the flooding is deepest.
Outside of that part of the region, the effect of climate change on flooding in this
neighborhood was minimal.

4 Economic costs

In addition to the loss of life, Hurricane Harvey was among the most financially expensive
weather disasters in US history. Estimates range from US$85Bn according to the reinsurance
estimates (https://www.munichre.com/topics-online/en/climate-change-and-natural-disasters/
natural-disasters/storms/hurricane-harvey-2017.html) to US$95Bn from the Centre for
Research on the Epidemiology of Disasters database of disaster damages (EMDAT www.
emdat.be) to as high as US$125Bn according to NOAA (https://www.ncdc.noaa.gov/billions/
events.pdf). A recent paper (Frame et al. 2020) attributed the climate change portion to be 3/4
of the actual total cost. As a conservative cost estimate, they used the average of the
reinsurance and EMDAT values, US$90Bn, which we also use for sake of comparison. The
Frame et al. (2020) cost estimate was based on a probabilistic attribution framework and
posited that the fractional attributable risk (FAR) is equivalent to the fraction of the total cost of
the storm due to climate change. The FAR is defined from the ratio of probabilities of an event
both with and without climate change by the following formula

                                  FAR ¼ 1P0 =P1 ¼ 11=PR

                                           PR ¼ P1 =Po
where P1 is the estimated probability of the simulated actual event and P0 is estimated
probability of the simulated event without climate change and ranges from 0 (no human
influence) to 1 (entirely caused by humans). Alternatively, the so-called risk or probability
ratio (PR), ranging from 1 to infinity, provides a more direct measure of the change in risk due
to climate change.
20 Page 8 of 13 Climatic Change (2021) 166: 20 Fig. 3 Simulation of the actual and counterfactual flood in the Deer Park neighborhood. a The actual flood that was. b The counterfactual flood that might have been in the absence of climate change if human activities increased Harvey storm total precipitation by 7%. c Same as b except precipitation increased by 38%. d Attributable flooding if human activities increased Harvey storm total precipitation by 7%. e) Same as d except precipitation increased by 38%. Rainbow scale is for panels a, b, and c. Blue scale is for panels d and e. Units: meters. 999 denotes areas of permanent water This usage of FAR to estimate the fractional attributable cost was based on a similar analysis quantifying the number of fatalities during the 2003 European heat wave due to
Climatic Change (2021) 166: 20                                                                     Page 9 of 13 20

climate change (Mitchell et al. 2016). Frame et al. (2020) constructed a FAR best estimate of
0.75 by averaging the best estimates of the so-called risk or probability ratio (RR) from the two
papers that provided them (Risser and Wehner 2017; van Oldenborgh et al. 2017).
    The mechanistic flooding attribution statements of this study presents an alternative and
more intuitive approach to quantifying costs, either economic or mortality, due to climate
change subject to the conditions of the storylines. The damages suffered during Hurricane
Harvey were largely direct consequences of flooding of structures and motor vehicles (Abbot
et al. 2018). With the simplifying assumption that structures and motor vehicles were
uniformly distributed in value throughout the flooded area, then the additional number of
them damaged by climate change is the same as the attributable increase in flood area from
climate change. We also assume that damages are not highly dependent on the depth or
duration of the flood. These assumptions could be removed by careful application of real estate
value upon flood maps enabled by our line of analysis.
    Table 2 summarizes the differences between the Frame et al. (2020) probabilistic cost
estimates and the mechanistic storyline cost estimates for each case considered by the three
available Harvey precipitation attribution studies. We note that the economic costs using our
attributable flood area estimates are much less than that obtained by using FAR estimates. Best
estimates from the FAR approach are US$67Bn, while from the flood area approach are
US$14bn. The equivalence between mechanistic and probabilistic framing of the human
influence on individual extreme events is quite clear (Otto et al. 2012; Easterling et al.
2016). However, the discrepancy in cost estimates between using FAR or the attributable area
magnitude change would suggest otherwise.
    So which is the correct interpretation of the costs of climate change? We note that the
attributable magnitude change, whether it be in area flooded in a low compared to high
precipitation storm or the number deaths in a cooler compared to a warmer heat wave as in
Mitchell et al. (2016), is an intuitive and direct interpretation of cost increases. It also could
permit incorporating information about the non-uniform distribution of real estate values, flood

Table 2 Cost estimates of Hurricane Harvey attributable to climate change presuming an actual total cost of
US$90Bn using mechanistic and probabilistic attribution statements from previous publications. RW Risser and
Wehner 2017, VO van Oldenborgh et al. 2017, W Wang et al. 2018

Source                     Greater Houston           Mechanistic    PR/             Fractional        Probabilistic
                           attributable flood area   attributable   probability     attributable      attributable
                           increase                  cost           ratio (P1/P0)   risk: FAR         cost

Best estimate as defined   14%                       US$13Bn        4               0.75              US$67Bn
  by Frame et al.
RW Best estimate           29%                       US$26Bn        8               0.88              US$79Bn
  (small region); W
  upper bound
RW Best estimate large     18%                       US$16Bn        5               0.80              US$72Bn
  region)
W best estimate            15%                       US$14Bn                        –                 –
RW likely lower bound      14%                       US$13Bn        3.5             0.71              US$64Bn
  (small region
VO upper bound             14%                       US$13Bn        5               0.80              US$72Bn
W lower bound              10%                       US$9Bn                         –                 –
VO lower bound             6%                        US$5Bn         1.5             0.33              US$30Bn
RW likely lower            5%                        US$5Bn         1.7             0.41              US$37Bn
  bound; large region
20 Page 10 of 13 Climatic Change (2021) 166: 20
depth, and flood duration. On the other hand, FAR is just that, the fractional attributable risk of
an event of a given magnitude, which in the Hurricane Harvey case is a loss of US$90Bn. A
FAR value of 0.75 is equivalent to a PR of 4, leading to the statement: “The probability of a
US$90Bn hurricane loss in Texas was quadrupled due to climate change.”
Frame et al. (2020) obtained their best estimate that the chances of Harvey precipitation was
quadrupled by averaging the probability ratios (Table 2) of the Risser and Wehner (2017) large
region best estimate with the average of the two van Oldenborgh et al. (2017) bounds.
Performing the same calculation on the corresponding attributable precipitation estimates from
Table 2 yields a best estimate of a 19% attributable precipitation increase. This precipitation
increase results in a 14% increase in attributable flood area from our hydraulic simulations.
Using this method of obtaining a best estimate from multiple publications leads to the
following statement: “Our best estimate is that climate change increased the cost of Hurricane
Harvey by about 14% or US$13Bn”. Wang et al. (2018) did not publish a probability ratio;
thus Frame et al. (2020) could not use their results in their cost estimate. However, their best
estimate of the attributable precipitation change is coincidentally 19% so the magnitude of our
cost estimate is not affected by its inclusion.
We stress that our cost estimate attribution statement of US$13Bn is entirely consistent with
the attribution statement about quadrupling of the risk of a US$90Bn hurricane loss as
explained by Otto et al. (2012). And as noted in Frame et al. (2020), even this lower cost
estimate is high enough to be inconsistent with macroeconomic estimates of the cost of climate
change. But our mechanistic cost estimate is much lower than the probabilistic cost estimate of
Frame et al. (2020) with very different policy implications. It is unlikely that accounting for
heterogeneities in real estate values, flood depth and flood duration will increase this mech-
anistic cost estimate enough to accommodate this difference demonstrating the importance of
attribution methodologies. We hope that our arguments here lead to a best practices discussion
in the wider detection and attribution community as to how to better communicate the costs of
climate change.
5 Conclusions
The extent of Hurricane Harvey’s freshwater flood that is attributable to anthropogenic global
warming can be quantified and to first order depends on how much of the storm total
precipitation over land is similarly attributable. Three previous independent studies provide a
range of this human influence on precipitation ranging from the thermodynamically constrained
Clausius-Clapeyron results of about a 7% increase to substantially higher increases of 3 to 4
times this amount. A one-degree attributable warming of the Gulf of Mexico surface waters
suggests that available moisture for Harvey would be increased by global warming by only
about 7% as the Gulf is the source of the storm’s moisture. However, a recent dynamical
modeling analysis of 15 different tropical cyclones revealed that while precipitation over the
entire duration and spatial extent of such storms may be similarly constrained, locally the
anthropogenic precipitation increase can be much larger (Patricola and Wehner 2018). Hence
the larger than C-C scaling estimates in the three Harvey precipitation attribution studies are
credible.
Human-induced percent changes in intense tropical cyclone precipitation have been shown to
be significantly non-uniform (Risser and Wehner 2017; Patricola and Wehner 2018), and this may
be important in quantifying changes in flooding. However, in this study, we simply perturbedClimatic Change (2021) 166: 20 Page 11 of 13 20
precipitation uniformly in the hydraulic model being constrained by the information available
from the three precipitation studies. This simplification is a reasonable first effort as flooding is an
integrative effect influenced both by local and non-local precipitation over a wide area.
Figures 2c and 3c show the flood extent presuming a 38% attributable increase in total
precipitation during Hurricane Harvey and should be interpreted as an upper bound. Figures 2b
and 3b show the flood extent presuming the lower bound of Clausius-Clapeyron-scaled
precipitation increases (7%). Best estimates in the range of 19–24% on the attributable increase
in precipitation are more defensible as are the associated flood increases of Table 1 and the
flood data provided in the Supplement.
Over the entire flooded region, we find that the total volume of water in Harvey’s flood is
close to a 1:1 relationship with the total amount of precipitation during the storm. As the region
is very flat, drainage to the Gulf of Mexico is slow compared to the rate at which precipitation
fell. However, the topography is complex enough that the total flood area scales at less than
one to one with total precipitation amount.
Attributable increases in local flooding are considerably complicated by local topography.
We find that in the more severely flooded parts of the region, the human influence on both
flood volume and area is larger than over the entire region and can scale superlinearly with
precipitation amount. In shallower parts of the flood, the human influence is less pronounced.
This should not be surprising as in general; the areas most prone to flooding are likely to be
areas into or through which water from a wider surrounding catchment area is funneled. This
“concentrating” effect means that any change in rainfall over the wider area will inevitably be
amplified in terms of absolute water volume in such areas.
The quantitative estimates of the attributable anthropogenic contribution to flooding and
damages provided by this study should be considered unique to Hurricane Harvey. Indeed, the
human influence on precipitation during other tropical storms varies (Patricola and Wehner
2018; Reed et al. 2020, 2021). Furthermore, the mix of freshwater flooding (from precipita-
tion) and saltwater flooding (from storm surge) depends on many factors, including coastal
bathymetry, windspeed direction, and distance from the coast as exemplified by the damages
of Hurricanes Sandy and Florence. Nonetheless, much of the US Gulf Coast is similar to the
Greater Houston area both in flatness of the local topography and exposure to the risk of
intense tropical cyclones. The methods presented here, including the hydraulic flood model,
are widely applicable to inform estimates of the human influence on flood properties and
associated damages of recent storms as well as the risk posed by the effect of global warming
on storms yet to come.
Assessing the human influence on Harvey’s flood for every neighborhood in the greater
Houston area is outside of the scope of this paper. However, in order to aid such detailed
analysis, output data for each of the attribution results in Table 1 are described in the online
supplement and publically available at https://portal.nersc.gov/cascade/Harvey/ along with
instructions to visualize it with freely available software. Even casual browsing of these
datasets reveals that many neighborhoods and homes would have been flooded in the
absence of climate change even if the human influence on precipitation is very large.
Likewise, some neighborhoods, especially those hardest hit, suffered significantly increased
damages due human interference in the climate system.
Flood maps produced by these datasets, combined with local knowledge of the structure
type, density, and value, can provide intuitive estimates of the human and financial costs due to
climate change during Hurricane Harvey subject to the conditions, caveats, and assumptions of
the original precipitation attribution statements.20 Page 12 of 13 Climatic Change (2021) 166: 20
Supplementary Information The online version contains supplementary material available at https://doi.org/
10.1007/s10584-021-03114-z.
Acknowledgements This research was partially supported by the Director, Office of Science, Office of
Biological, and Environmental Research of the US Department of Energy under Contract No. DE340AC02-
05CH11231 under the ICoM SFA project. This document was prepared as an account of work sponsored by the
US Government. While this document is believed to contain correct information, neither the US Government nor
any agency thereof, nor the Regents of the University of California, nor any of their employees, makes any
warranty, express or implied, or assumes any legal responsibility for the accuracy, completeness, or usefulness of
any information, apparatus, product, or process disclosed, or represents that its use would not infringe privately
owned rights. Reference herein to any specific commercial product, process, or service by its trade name,
trademark, manufacturer, or otherwise does not necessarily constitute or imply its endorsement, recommendation,
or favoring by the US Government or any agency thereof or the Regents of the University of California.
Declarations
Disclaimer The views and opinions of authors expressed herein do not necessarily state or reflect those of the
US Government or any agency thereof, the Lawrence Berkeley National Laboratory or the Regents of the
University of California.
Open Access This article is licensed under a Creative Commons Attribution 4.0 International License, which
permits use, sharing, adaptation, distribution and reproduction in any medium or format, as long as you give
appropriate credit to the original author(s) and the source, provide a link to the Creative Commons licence, and
indicate if changes were made. The images or other third party material in this article are included in the article's
Creative Commons licence, unless indicated otherwise in a credit line to the material. If material is not included
in the article's Creative Commons licence and your intended use is not permitted by statutory regulation or
exceeds the permitted use, you will need to obtain permission directly from the copyright holder. To view a copy
of this licence, visit http://creativecommons.org/licenses/by/4.0/.
References
Abbot G et al (2018) Hurricane Harvey. Impact and Response in Harris County, Harris County Flood Control
District. https://www.hcfcd.org/media/3108/harvey-impact-and-response-book-final.pdf. Accessed
12 May 2020
Arctur, D. (2018) NOAA NWC - Harvey National Water Model Streamflow Forecasts. https://www.hcfcd.org/
Portals/62/Downloads/Hurricane%20Harvey/Harvey%20Impact%20and%20Response%20Book.pdf.
Accessed 12 May 2021
Bates PD, Horritt MS, Fewtrell TJ (2010) A simple inertial formulation of the shallow water equations for
efficient two-dimensional flood inundation modelling. J Hydrol 387:33–45. https://doi.org/10.1016/j.
jhydrol.2010.03.027
Easterling DR, Kunkel KE, Wehner MF, Sun L (2016) Detection and attribution of climate extremes in the
observed record. Weather Clim Extrem:11. https://doi.org/10.1016/j.wace.2016.01.001
Emanuel K (2017) Assessing the present and future probability of Hurricane Harveys rainfall. Proc Natl Acad Sci
114:12681–12684. https://doi.org/10.1073/pnas.1716222114
Frame DJ, Wehner MF, Noy I, Rosier SM (2020) The economic costs of Hurricane Harvey attributable to climate
change. Clim Chang 160:271–281. https://doi.org/10.1007/s10584-020-02692-8
Halverson JB (2018) The costliest hurricane season in U.S. history. Weatherwise 71:20–27. https://doi.org/10.
1080/00431672.2018.1416862
Jonkman SN, Godfroy M, Sebastian A, Kolen B (2018) Brief communication: loss of life due to Hurricane
Harvey. Nat Hazards Earth Syst Sci 18:1073–1078. https://doi.org/10.5194/nhess-18-1073-2018
Kay AL, Booth N, Lamb R, Raven E, Schaller N, Sparrow S (2018) Flood event attribution and damage
estimation using national-scale grid-based modelling: winter 2013/2014 in Great Britain. Int J Climatol 38:
5205–5219. https://doi.org/10.1002/joc.5721
Kossin JP (2018) A global slowdown of tropical-cyclone translation speed. Nature 558:104–107. https://doi.org/
10.1038/s41586-018-0158-3Climatic Change (2021) 166: 20 Page 13 of 13 20
Lindner, J., Fitzgerald, S. (2018) Immediate Report – Final. Hurricane Harvey - Storm and Flood Information.
Harris County Flood Control District memorandum June 4, 2018. https://www.hcfcd.org/Portals/62/Harvey/
immediate-flood-report-final-hurricane-harvey-2017.pdf. Accessed 12 May 2021
Miller MM, Shirzaei M (2019) Land subsidence in Houston correlated with flooding from Hurricane Harvey.
Remote Sens Environ 225:368–378. https://doi.org/10.1016/j.rse.2019.03.022
Mitchell D, Heaviside C, Vardoulakis S, Huntingford C, Masato G, Guillod P, B., et al. (2016) Attributing
human mortality during extreme heat waves to anthropogenic climate change. Environ Res Lett 11:74006.
https://doi.org/10.1088/1748-9326/11/7/074006
Neal J, Schumann G, Bates P (2012) A subgrid channel model for simulating river hydraulics and floodplain
inundation over large and data sparse areas. Water Resour Res 48. https://doi.org/10.1029/2012WR012514
van Oldenborgh GJ, van der Wiel K, Sebastian A, Singh R, Arrighi J, Otto F et al (2017) Attribution of extreme
rainfall from Hurricane Harvey, August 2017. Environ Res Lett 12:124009. https://doi.org/10.1088/1748-
9326/aa9ef2
Otto FEL, Massey N, van Oldenborgh GJ, Jones RG, Allen MR (2012) Reconciling two approaches to
attribution of the 2010 Russian heat wave. Geophys Res Lett 39:L04702. https://doi.org/10.1029/
2011GL050422
Patricola CM, Wehner MF (2018) Anthropogenic influences on major tropical cyclone events. Nature. https://
doi.org/10.1038/s41586-018-0673-2
Reed KA, Stansfield AM, Wehner MF, Zarzycki CM (2020) Forecasted attribution of the human influence on
Hurricane Florence. Sci Adv 6. https://doi.org/10.1126/sciadv.aaw9253
Reed K, Wehner MF, Stansfield AM, Zarzycki CM (2021) Anthropogenic influence on hurricane Dorian’s
extreme rainfall. Bull Am Meteorol Soc 102:S9–S15. https://doi.org/10.1175/BAMS-D-20-0160.1
Risser MD, Wehner MF (2017) Attributable human-induced changes in the likelihood and magnitude of the
observed extreme precipitation during Hurricane Harvey. Geophys Res Lett 44:12,412–457,464. https://doi.
org/10.1002/2017GL075888
Sampson CC, Smith AM, Bates PD, Neal JC, Alfieri L, Freer JE (2015) A high-resolution global flood hazard
model. Water Resour Res 51:7358–7381. https://doi.org/10.1002/2015WR016954
Schaller N, Kay AL, Lamb R, Massey NR, van Oldenborgh GJ, Otto FEL et al (2016) Human influence on
climate in the 2014 southern England winter floods and their impacts. Nat Clim Chang 6:627–634. https://
doi.org/10.1038/nclimate2927
Sebastian A, Gori A, Blessing RB, van der Wiel K, Bass B (2019) Disentangling the impacts of human and
environmental change on catchment response during Hurricane Harvey. Environ Res Lett 14:124023.
https://doi.org/10.1088/1748-9326/ab5234
Shepherd TG (2016) A common framework for approaches to extreme event attribution. Curr Clim Chang Rep 2:
28–38. https://doi.org/10.1007/s40641-016-0033-y
Stone DA, Christidis N, Folland C, Perkins-Kirkpatrick S, Perlwitz J, Shiogama H et al (2019) Experiment
design of the International CLIVAR C20C+ Detection and Attribution project. Weather Clim Extrem 24:
100206. https://doi.org/10.1016/j.wace.2019.100206
Trenberth K, Lijing C, Peter J, Yongxin Z, John F (2018) Hurricane Harvey links to ocean heat content and
climate change adaptation. Earth’s Futur 6:730–744. https://doi.org/10.1029/2018EF000825
UK Environment Agency (2019) What is the updated flood map for surface water? Version 2.0. Available at:
https://assets.publishing.service.gov.uk/government/uploads/system/uploads/attachment_data/file/842485/
What-is-the-Risk-of-Flooding-from-Surface-Water-Map.pdf. Accessed 12 May 2020
Wang SYS, Zhao L, Yoon JH, Klotzbach P, Gillies RR (2018) Quantitative attribution of climate effects on
Hurricane Harvey’s extreme rainfall in Texas. Environ Res Lett. https://doi.org/10.1088/1748-9326/aabb85
Wehner MF, Zarzycki CM, Patricola CM (2019) Estimating the human influence on tropical cyclone intensity as
the climate changes. In: Collins J, Walsh KJE (eds) Hurricane Risk. Springer, pp 235–260
Wing OEJ, Bates PD, Sampson CC, Smith AM, Johnson KA, Erickson TA (2017) Validation of a 30 m
resolution flood hazard model of the conterminous United States. Water Resour Res 53:7968–7986. https://
doi.org/10.1002/2017WR020917
Wing OEJ, Sampson CC, Bates PD, Quinn N, Smith AM, Neal JC (2019) A flood inundation forecast of
Hurricane Harvey using a continental-scale 2D hydrodynamic model. J Hydrol X 4:100039. https://doi.org/
10.1016/j.hydroa.2019.100039
Zhang W, Villarini G, Vecchi GA, Smith JA (2018) Urbanization exacerbated the rainfall and flooding caused by
hurricane Harvey in Houston. Nature 563:384–388. https://doi.org/10.1038/s41586-018-0676-z
Publisher’s note Springer Nature remains neutral with regard to jurisdictional claims in published maps
and institutional affiliations.You can also read