Isotopic differences in soil-plant-atmosphere continuum composition and control factors of different vegetation zones on the northern slope of the ...
←
→
Page content transcription
If your browser does not render page correctly, please read the page content below
Biogeosciences, 19, 877–889, 2022
https://doi.org/10.5194/bg-19-877-2022
© Author(s) 2022. This work is distributed under
the Creative Commons Attribution 4.0 License.

Isotopic differences in soil–plant–atmosphere continuum
composition and control factors of different vegetation
zones on the northern slope of the Qilian Mountains
Yuwei Liu1,2 , Guofeng Zhu1,2 , Zhuanxia Zhang1,2 , Zhigang Sun1,2 , Leilei Yong1,2 , Liyuan Sang1,2 , Lei Wang1,2 , and
Kailiang Zhao1,2
1 School   of Geography and Environmental Science, Northwest Normal University, Lanzhou 730070, Gansu, China
2 Shiyang   River Ecological Environment Observation Station, Northwest Normal University, Lanzhou 730070, Gansu, China

Correspondence: Guofeng Zhu (gfzhu@lzb.ac.cn)

Received: 14 May 2021 – Discussion started: 2 June 2021
Revised: 14 November 2021 – Accepted: 15 December 2021 – Published: 11 February 2022

Abstract. Understanding the differences and control factors       1   Introduction
of stable water isotopes in the soil–plant–atmosphere contin-
uum (SPAC) of different vegetation zones is of great signifi-     The relative abundance changes of hydrogen and oxygen iso-
cance in revealing hydrological processes and regional wa-        topes in water can indicate the water cycle and the water use
ter cycle mechanisms. From April 2018 to October 2019,            mechanism in plants, so isotope technology has become an
we collected 1281 samples to investigated the stable wa-          increasingly important method to study the water cycle (Gao
ter isotopes’ changes in the SPAC of three different veg-         et al., 2009; Song et al., 2002; Coplen, 2013; Shou et al.,
etation zones (alpine meadows, forests, and arid foothills)       2013). The stable water isotopic composition is considered to
in the Shiyang River basin. The results show the follow-          be the “fingerprint” of water, which records a large amount
ing: (1) precipitation plays a major control role in the SPAC.    of environmental information that comprehensively reflects
From alpine meadows to arid foothills, the temperature ef-        the geochemical process of each system and links the com-
fect of precipitation isotopes increases as altitude decreases.   position characteristics of each link (Darling et al., 2003;
(2) From the alpine meadow to the arid foothills, soil water      Raco et al., 2013; Nlend et al., 2020). As an effective tool,
isotopes are gradually enriched. (3) Alpine meadow plants         stable-isotope technology is widely applied in studying the
are mainly supplied by precipitation in the rainy season,         relationship between environmental factors and the water cy-
and forest plants mainly utilize soil water in the dry season     cle (Araguás-Araguás et al., 1998; Christopher et al., 2009),
and precipitation in the rainy season. The soil water in the      water transportation and distribution mechanisms (Gao et al.,
arid foothills is primarily recharged by groundwater, and the     2011), and ways of tracing water use by plants (Detjen et al.,
evaporation of plant isotopes is strong. (4) Temperature and      2015). The understanding of the relationship between the in-
altitude are potential factors that control the isotopic compo-   fluence of plant characteristics, water use efficiency, and wa-
sition of the SPAC. This research will help in understanding      ter sources (Ehleringer, 1991; Sun et al., 2005; Li et al., 2019)
of the SPAC system’s water cycle at different altitudes and       provides a new observation method for revealing the mech-
climates in high mountains.                                       anism of the water cycle in the hydrological ecosystem (Nie
                                                                  et al., 2014; Yu et al., 2007; Wang et al., 2019).

Published by Copernicus Publications on behalf of the European Geosciences Union.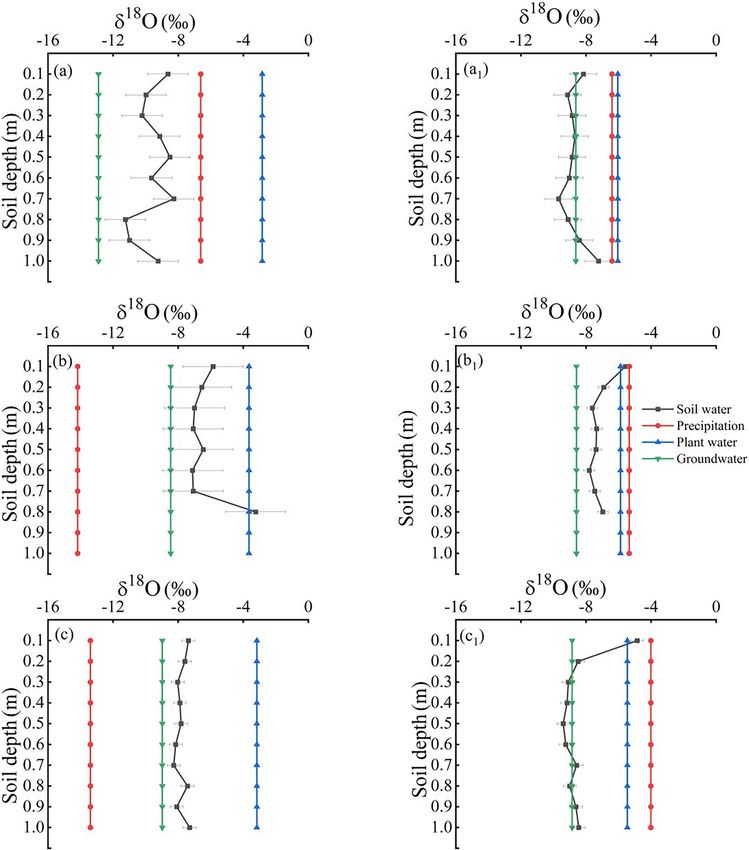
878                                               Y. Liu et al.: Isotopic differences in SPAC composition and control factors

    Although the isotopic ratio in soil water varies with depth,   theoretical basis for the reasonable use of water resources in
it remains stable when transferred from plant roots to stems,      arid areas.
leaves, or young unbolted branches (Rodriguez-Iturbe, 2001;
Meissne et al., 2014). Precipitation infiltration and runoff
generation processes (Bam and Ireso, 2018; Hou et al., 2008)       2     Materials and methods
and groundwater recharge and regeneration capacity (Smith
et al., 1992; Cortes and Farvolden, 1989) can be determined        2.1    Study area
combining the isotopic composition changes of surface wa-
ter, soil water, and groundwater. Regional meteorological          The Shiyang River basin is located at the northern foot of the
and hydrological conditions and the contribution of various        Qilian Mountains, east of the Hexi region, Gansu Province
environmental factors can be evaluated (Hua et al., 2019)          (Zhu et al., 2018) (Fig. 1). The Shiyang River originates
by comparing different waterline equations and analyzing           from the snowcapped mountains on the north side of the
changes in various water bodies. Furthermore, doing this           Lenglongling in the eastern section of the Qilian Mountains.
has laid a foundation for studying the deep mechanism of           The river’s total length is about 250 km, with a basin area
the water cycle (Gao et al., 2009). As an important compo-         of 4.16 × 10⁴ km2 , and the annual average runoff is about
nent of the global water cycle, plants control 50 %–90 % of        1.58 × 10⁸ km3 . Rivers are supplied by precipitation from
transpiration (Jasechko et al., 2013; Coenders-Gerrits et al.,     mountain and alpine ice and snow meltwater. The runoff
2014; Schlesinger and Jasechko, 2014). The plant’s roots do        area is about 1.10 × 10⁴ km2 , and the drought index is 1 to 4
not have isotope fractionation when absorbing water (White         (Zhou et al., 2020). The soil is classified as grey-brown desert
et al., 1985; Song et al., 2013), so the water isotopic composi-   soil, eolian sandy soil, saline soil, and meadow soil. The
tion of plant roots and stems reflects the isotope composition     Shiyang River basin has a continental temperate arid climate
of water available for plants (Dawson et al., 1991).               with strong sunlight. The annual average sunshine hours are
    The research of the water cycle based on the soil–plant–       2604.8–3081.8 h; the annual average temperature is −8.2 to
atmosphere continuum (SPAC) plays a vital role in the study        10.5 ◦ C; the temperature difference between day and night
of water and the sources of plant water use in arid areas          is 25.2 ◦ C; the annual average precipitation is 222 mm; and
(Price et al., 2012; Shou et al., 2013). Hydrogen and oxygen       the annual average evaporation is 700–2000 mm. The vegeta-
isotopes have been used to study the water cycle at the in-        tion coverage in the upper and middle alpine regions is better
terfaces of “soil–root”, “soil–plant”, and “soil–atmosphere”,      than that of the lower reaches, with trees, shrubs, and grass-
but only a few parameters play an important role in the com-       covered vegetation categories (Wan et al., 2019). The down-
plex interactions between the various surfaces (Durand et al.,     stream vegetation coverage is poor under the strong influence
2007; Li et al., 2006; West et al., 2010). Previous studies        of long-term human production, mainly desert vegetation.
have shown that local factors, especially temperature, mainly
control stable-isotope precipitation changes in mid-latitudes      2.2    Sample collection
(Dai et al., 2020). Through research on the composition of
hydrogen and oxygen isotopes in different water bodies, we         From April 2018 to October 2019, samples were collected at
can further understand the mechanism of water use by veg-          Lenglong (alpine meadow), Hulin (forest), and Xiying (arid
etation (Yang et al., 2015) and provide a scientific basis for     foothills) in the Shiyang River basin (Table 1). We collected
vegetation restoration in arid and semi-arid areas. In the ex-     1281 samples in the Shiyang River basin, including 472 pre-
isting research, how to extend the results of the small-scale      cipitation samples, 570 soil samples, 119 plant samples, and
SPAC water cycle research to the large-scale area has be-          120 groundwater samples.
come a difficult hot spot. In inland arid areas, due to the lack      The precipitation samples were collected with a rain
of water resources, the exchange of energy and water with          bucket. The rain measuring cylinder consists of a funnel and
the outside world is small, and the water cycle is mainly the      a storage part. After each precipitation event, we immedi-
vertical circulation of groundwater–soil–atmospheric water.        ately transferred the liquid precipitation to a 100 mL high-
Therefore, studying the changes in SPAC isotopic composi-          density sample bottle. The sample bottle was sealed with a
tion in arid regions is significant for ecological restoration.    sealing film and stored at low temperature. Simultaneously,
    The Shiyang River basin is under the greatest ecological       the polyethylene bottle sample was labeled with the date and
pressure and has the most severe water shortage in China.          type of precipitation (rain, snow, hail, and rain).
The purpose of this study is to (1) analyze the SPAC water            The soil samples were collected at intervals of 10 cm at a
cycle process in different vegetation zones and (2) identify       depth of 100 cm with a soil drill. Part of the soil sample was
the potential factors that control the SPAC water cycle. This      put into a 50 mL glass bottle. The bottle’s mouth was sealed
research is helpful to clarify the water resource utilization      with parafilm and transported to the observation station for
mechanism and the local water cycle mechanism of differ-           cryopreservation within 10 h of sampling. The remaining soil
ent vegetation areas in high mountainous areas and provide a       sample was placed in a 50 mL aluminum box, and we used
                                                                   the drying method to measure the soil water content (swc).

Biogeosciences, 19, 877–889, 2022                                                      https://doi.org/10.5194/bg-19-877-2022
Y. Liu et al.: Isotopic differences in SPAC composition and control factors                                                                  879

Figure 1. Study area and observation system.

Table 1. Basic information table of sampling points.

  Sampling station             Geographical parameters                                         Meteorological parameters
                     Latitude (N)   Longitude (E)      Altitude (m)    Average annual temperature (◦ C)      Average annual precipitation (mm)
  M1     Lenglong    37◦ 330        101◦ 500                  3647                                 −0.20                               595.10
  M2     Hulin       37◦ 410        101◦ 530                  2721                                  3.24                               469.44
  M3     Xiying      38◦ 290        102◦ 180                  2097                                  7.99                               194.67

   The vegetation samples were collected with a sampling                   with Los Gatos’ LWIA spectral pollutant identification in-
shear. First, we peeled off the bark and put the stem into a               strument V1.0 spectral analysis software, and then we estab-
50 mL glass bottle. After that, we sealed the bottle mouth                 lished calibration methods for δD and δ 18 O spectral contami-
and kept it frozen before the experimental analysis.                       nants (Meng et al., 2012; Liu et al., 2015). For the broadband
   The groundwater samples were collected with polyethy-                   metric value NB metric of the methanol calibration result, its
lene bottles, and the samples were brought back to the re-                 logarithm has a significant quadratic-curve relationship with
frigerator at the test station for cryogenic preservation within           1δD and 1δ 18 O, and the formulas are, respectively,
10 h.
                                                                           1δD = 0.018(ln NB)3 + 0.092(ln NB)2 + 0.388 ln NB
2.3    Sample treatment
                                                                                        + 0.785 (R 2 = 0.991; p < 0.0001),                       (2)
All water samples were tested using a liquid-water isotope                       18                    3                   2
                                                                           1δ O = 0.017(ln NB) − 0.017(ln NB) + 0.545 ln NB
analyzer (LWIA; DLT-100, Los Gatos Research, USA) at
the Northwest Normal University laboratory. Each sample                                  + 1.358 (R 2 = 0.998; p < 0.0001).                      (3)
and isotopic standard were analyzed by six consecutive in-                  For ethanol calibration results, the broadband metric value
jections. To eliminate the memory effect of the analyzer, we               BB metric has a quadratic curve and a linear relationship with
discarded the values of the first two injections and used the              1δD and 1δ 18 O, and the formulas are, respectively,
average of the last four injections as the final result value.
Isotopic measurements are given with the symbol “δ” and                    1δD = −85.67BB + 93.664
are expressed as a difference of thousandths relative to Vi-
enna Standard Mean Ocean Water:                                                               (R 2 = 0.747; p = 0.026) (BB < 1.2),               (4)
                                                                                 18                    2
                                                                           1δ O = −21.421BB + 39.9356
δ(‰) = [(δ/δv-smow ) − 1)] · 1000,                               (1)
                                                                                              (R 2 = 0.769; p < 0.012).                          (5)
where δ is the ratio of 18 O/16 O or D/1 H in the collected
sample and δv-smow is the ratio of 18 O/16 O or D/1 H in the               2.4        Data analysis
Vienna standard sample.
   Due to the existence of methanol and ethanol in plant                   Since the isotopic data are generally normally distributed
water samples, it is necessary to calibrate the raw data of                according to the Kolmogorov–Smirnov (KS) test, we used
plant samples. To determine the methanol (NB) and ethanol                  Pearson correlation to describe the various correlations be-
(BB) pollution degree, we used different concentrations of                 tween different water types (precipitation, soil water, plant
pure methanol and ethanol mixed deionized water, combined                  water, and groundwater) and the control factors in different

https://doi.org/10.5194/bg-19-877-2022                                                                     Biogeosciences, 19, 877–889, 2022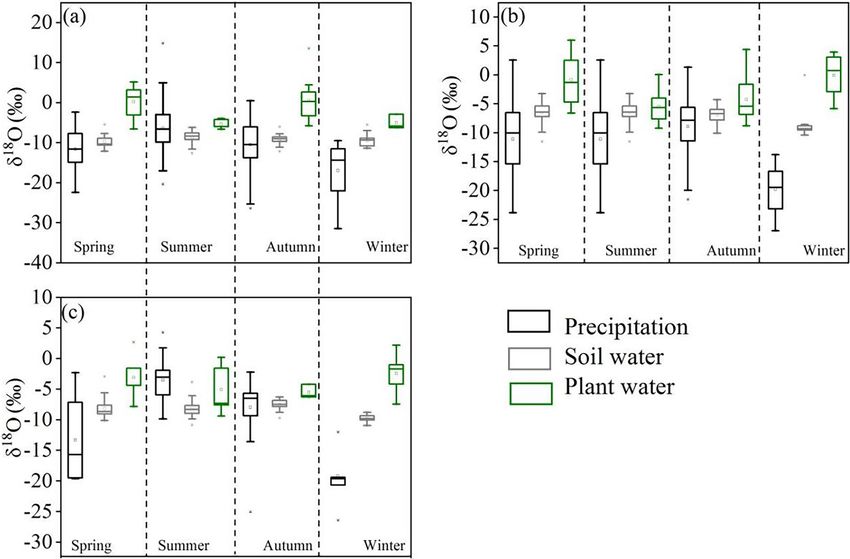
880                                                   Y. Liu et al.: Isotopic differences in SPAC composition and control factors

                                                                        3.2   The relationship between stable water isotopes in
                                                                              different vegetation zones

                                                                        According to the definition of the global meteoric water line
                                                                        (GMWL) (Craig, 1961), the linear relationship of δ 18 O and
                                                                        δD in local precipitation, soil water, plant water, and ground-
                                                                        water is defined as LMWL, SWL, PWL, and GWL, respec-
                                                                        tively.
                                                                           As shown in Fig. 3, there are some differences in the local
                                                                        meteoric waterline equations of different vegetation zones.
                                                                        The slopes of the LMWL of alpine meadows (7.88), forests
                                                                        (7.82), and arid foothills (7.72) are all smaller than that of
                                                                        the GMWL (8.00); this is because the study area is located
                                                                        in northwestern China’s arid area, where the climate is dry,
                                                                        and the isotopes have undergone strong fractionation. The
                                                                        slope of the SWL in the alpine meadow is the largest (6.07),
                                                                        and the slope of the SWL in the forest (5.10) is greater than
                                                                        the slope of the SWL in the arid foothills (3.94); the intercept
                                                                        has the same characteristics, indicating that the arid foothills’
                                                                        soil evaporation is the largest. According to the Investigation
                                                                        Report on Natural Resources in the Shiyang River basin in
Figure 2. Diurnal variation in relative humidity, precipitation, tem-   2020, the vegetation coverage rate of the alpine meadow is
perature, and swc (%) from April 2018 to October 2019. The date         25.95 % and that of the arid foothills is 8.48 %. The vegeta-
is given in the format year/month/day.                                  tion coverage rate of the alpine meadow is higher than that
                                                                        of the arid foothills, and it has better water retention abil-
                                                                        ity and less evaporation of soil water (Wan et al., 2019; Wei
vegetation zones. The significance level for all statistical tests      et al., 2019). The slope of the PWL in the arid foothills is the
was set to the 95 % confidence interval. All statistical analy-         largest (2.45), and the slope of the PWL in the alpine meadow
ses were completed using SPSS software.                                 (1.90) is greater than that of the forest (1.69).
                                                                           According to the weighted average value of stable oxygen
3     Results                                                           isotopes of various water bodies (Table 2), alpine meadows’
                                                                        soil water δ 18 O is −9.16 ‰, which is the most depleted and
3.1    Changes in meteorological parameters over time                   the closest to the precipitation δ 18 O (−9.44 ‰). The average
                                                                        δ 18 O of groundwater is −8.84 ‰, which is between the δ 18 O
Figure 2 shows the changes in daily precipitation, relative             of plant (−1.68 ‰) and δ 18 O of precipitation (−9.44 ‰),
humidity, temperature, and swc from April 2018 to October               indicating that precipitation is the primary source of alpine
2019. Meteorological data are obtained from the meteorolog-             meadow replenishment. The average δ 18 O of groundwater
ical station in the Shiyang River basin. During the summer              (−8.56 ‰) is between soil water δ 18 O (−7.01 ‰) and pre-
monsoon (April to September), the accumulated precipita-                cipitation δ 18 O (−8.63 ‰), but it is closer to precipitation
tion accounts for 90.4 % of the total precipitation, and the            δ 18 O, indicating that forest groundwater is replenished by
daily average precipitation is 3.98 mm. During the winter               soil water and precipitation. The mean δ 18 O values of soil
monsoon (October to March), the accumulated precipitation               water (−8.23 ‰) in the arid foothills are between precipita-
accounts for 9.60 % of the total precipitation, with average            tion δ 18 O (−7.50 ‰) and groundwater δ 18 O (−8.88 ‰) but
daily precipitation of 0.13 mm. During the summer monsoon,              closer to groundwater δ 18 O, indicating that the soil water in
the relative humidity of the Shiyang River basin is 43.78 %,            the arid foothills is mainly supplied by groundwater.
while during the winter monsoon it is 35.78 %. During the
observation period, the temperature is −16.2 and 32 ◦ C, and            3.3   Relationship between soil water and plant water
the average temperatures of the summer monsoon and winter                     isotopes in different vegetation zones
monsoon are 20.20 and −0.69 ◦ C, respectively. The average
swc value of the 0–100 cm soil layer vary from 2.58 % to                By analyzing the isotopic composition of soil and plant
89.96 %, and the low swc value usually appears in summer,               xylem, it is possible to preliminarily determine whether there
which is related to strong soil evaporation.                            is an overlap between soil moisture and plant moisture at dif-
                                                                        ferent depths (Javaux et al., 2016; Dawson et al., 1993; Roth-
                                                                        fuss et al., 2017; Tetzlaff et al., 2017; McCole et al., 2007;
                                                                        Zhou et al., 2015; Schwendenmann et al., 2015). Soil water

Biogeosciences, 19, 877–889, 2022                                                           https://doi.org/10.5194/bg-19-877-2022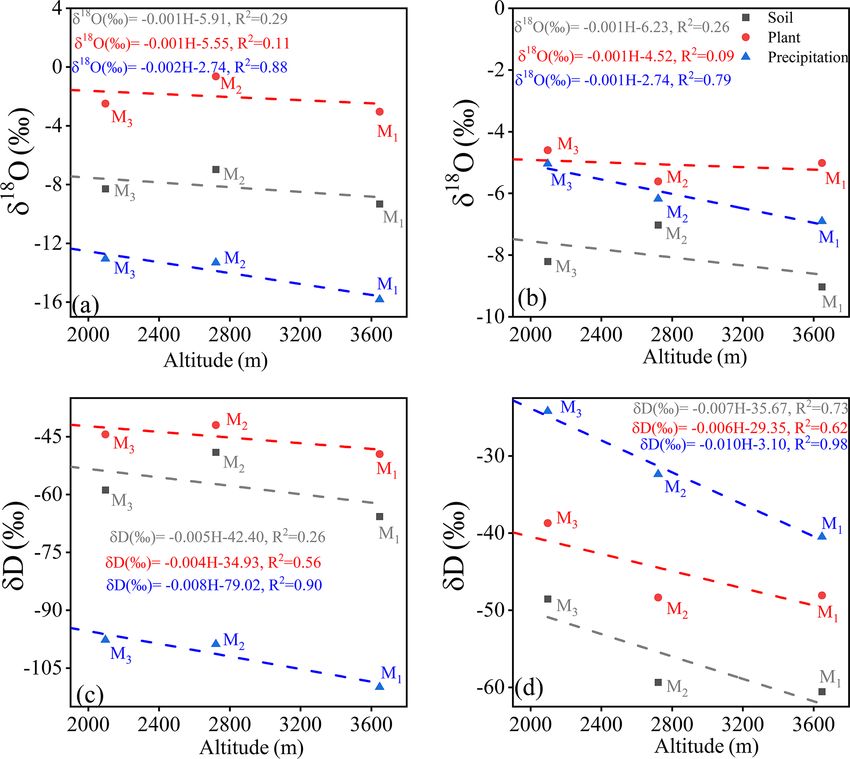
Y. Liu et al.: Isotopic differences in SPAC composition and control factors 881
Figure 3. Relationship of stable isotopes in different water bodies in alpine meadow (a), forest (b), and arid foothills (c).
Table 2. Comparison of stable isotopes of water in different vegetation zones.
Vegetation zone Water types δ 18 O (‰) δD (‰)
types
Min Max Average Coefficient of variation Min Max Average Coefficient of variation
Alpine meadow Precipitation −31.49 14.79 −9.44 −0.70 −238.62 63.43 −59.43 −0.84
Soil water −12.62 −5.46 −9.16 −0.16 −83.86 −26.13 −62.92 −0.16
Plant water −6.68 5.12 −1.68 −2.18 −60.22 −12.14 −41.14 −0.28
Groundwater −10.07 −7.71 −8.84 −0.07 −68.55 43.72 −54.85 −0.10
Forest Precipitation −26.96 4.38 −8.63 −0.74 −205.40 41.35 −60.24 −0.87
Soil water −11.96 −0.07 −7.01 −0.25 −78.43 −18.48 −48.68 −0.21
Plant water −9.24 5.98 −5.44 −1.31 −63.29 −23.77 −45.12 −0.24
Groundwater −10.25 −7.43 −8.56 −0.09 −68.80 −43.75 −53.46 −0.12
Arid foothills Precipitation −26.47 4.24 −7.50 −0.87 −194.34 38.62 −48.62 −1.04
Soil water −10.98 −2.96 −8.23 −0.15 −74.22 −8.79 −59.17 −0.12
Plant water −9.41 2.67 −3.61 −0.88 −74.90 −29.39 −48.79 −0.23
Groundwater −10.34 −7.43 −8.88 −0.07 −71.67 −44.26 −55.12 −0.09
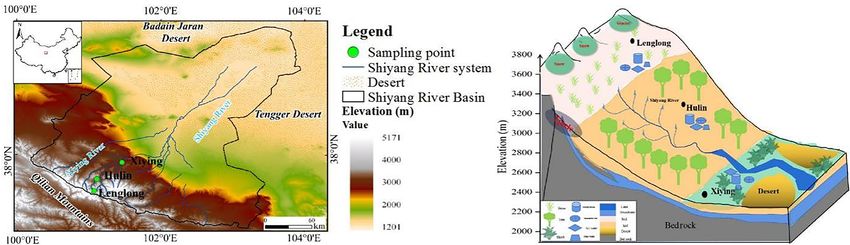
may evaporate before being absorbed by plants, which leads indicating that forest plants mainly use deep soil water dur-
to an increase in δD and δ 18 O values of soil water (Chen ing the dry season and shallow soil water during the rainy
et al., 2014). Therefore, it can be well explained that the sur- season. In the rainy season, the surface layer of soil water
face soil water isotope in Fig. 4 is more enriched than the intersects with plant water and the groundwater and soil wa-
deep soil water isotope. ter’s surface and deep layers intersect, showing that the plant
According to the study area’s precipitation, the current ex- water preferentially uses the surface layer water of the soil in
periment is divided into the dry season (October–April of the the arid foothills. In the dry season, plant water oxygen is the
following year) and the rainy season (May–September) for most enriched, and the isotopic values of groundwater and
analysis (Fig. 4). In the dry season, alpine meadow plants soil water are close, indicating that the soil water is mainly
have the highest value of δ 18 O (−2.84 ‰), and there is recharged by the groundwater. According to the Natural Re-
no overlap between soil and plant water. In the rainy sea- sources Survey Report of the Shiyang River basin, the buried
son, the plant water δ 18 O (−6.04 ‰) and precipitation δ 18 O groundwater level in the arid foothills is 2.5–15 m, and the
(−6.40 ‰) are close and the groundwater and soil water’s groundwater table is relatively shallow, making the soil wa-
surface and deep layers intersect, indicating that plant water ter in the arid foothills mainly recharged by groundwater in
is mainly supplied by precipitation in the rainy season, while the dry season.
the groundwater is supplied by soil water. In the dry season,
due to the low temperature (average temperature 0.30 ◦ C),
there is a lot of ice and snow in alpine meadows, and plants
do not directly use soil water. As temperature increases (av-
erage temperature 8.72 ◦ C), precipitation and surface runoff
increase and water infiltrates groundwater from soil. Forest
plant water intersects with deep soil during the dry season
and intersects with the soil surface during the rainy season,
https://doi.org/10.5194/bg-19-877-2022 Biogeosciences, 19, 877–889, 2022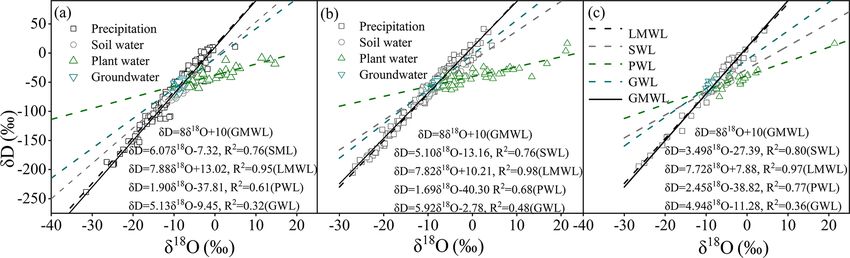
882                                                    Y. Liu et al.: Isotopic differences in SPAC composition and control factors

Figure 4. Panels (a–c) represent the variation in δ 18 O of soil, plant, precipitation, and groundwater with soil depth in the alpine meadow,
forests, and arid foothills in the dry season, and panels (a1–c1) represent the variation in δ 18 O of soil, plant, precipitation, and groundwater
in the alpine meadow, forests, and arid foothills in the rainy season.

4     Discussion                                                           foothills (average θ of 17.05 %), and the swc of alpine mead-
                                                                           ows increases with the increase in soil depth (from 43.78 %
4.1    Variation in soil water isotopes and swc between                    to 49.27 %), while that of forests decreases with the soil
       different vegetation zones                                          depth (from 26.10 % to 25.41 %). Compared with forests,
                                                                           plants in alpine meadows have shallower root systems and
In Fig. 5, along the three vegetation zones of alpine meadow,              smaller canopies, so transpiration and water consumption are
forest, and arid foothills, soil water isotopes are gradually              lower and swc is higher (Csilla et al., 2014; Li et al., 2009;
enriched. The coefficient of variation of the arid foothills               Western et al., 1998). On the one hand, with improvement
is the largest (−0.15), while that of the forest is the small-             in vegetation restoration, the ability of alpine meadows to
est (−0.25), indicating that from forest to arid foothills, the            retain soil water has been enhanced and soil water evapo-
closer to arid regions, the greater the coefficient of variation           ration has reduced. On the other hand, Lenglong, a repre-
and the greater the instability of soil water isotopes. The soil           sentative of alpine meadows, has average annual precipita-
water isotopes of different vegetation zones showed the same               tion of 595.10 mm and a low temperature (average annual
characteristics as the soil depth changed; that is, they were all          temperature of −0.20 ◦ C), making the soil water evaporation
depleted in May and August and enriched in October.                        intensity weak. The swc of the alpine meadows (86.95 %)
   The swc of alpine meadows (average θ of 42.21 %) is                     and forests (53.45 %) is the largest in August, while the arid
higher than that of forests (average θ of 26.98 %) and arid                foothills’ swc (11.13 %) is the smallest in August; this is be-

Biogeosciences, 19, 877–889, 2022                                                                 https://doi.org/10.5194/bg-19-877-2022
Y. Liu et al.: Isotopic differences in SPAC composition and control factors                                                                  883

Figure 5. The variation in δ 18 O and soil water content (θ, %) with soil depth. Panels (a–c) represent alpine meadow, forests and arid foothills,
respectively.

cause the northern slope of the Qilian Mountains is a wind-                is 9.80 ◦ C), the soil water δ 18 O of alpine meadows is rela-
ward slope. In August, a lot of precipitation falls on the high-           tively depleted. In the arid foothills, in summer, especially in
altitude alpine meadows and forests, while the arid foothills              August, although the temperature is relatively high (the av-
have little precipitation and low swc.                                     erage temperature is 23.92 ◦ C), the swc is low, evaporation
                                                                           is weak, and δ 18 O is relatively depleted. This phenomenon
4.2     Control factors of the SPAC in different vegetation                shows that precipitation plays a major control role in the wa-
        zones                                                              ter cycle of precipitation–soil–plants. When the temperature
                                                                           is below 0 ◦ C, the air will expand adiabatically, and the water
4.2.1    The influence of temperature on SPAC                              vapor will change adiabatic cooling (Rozanski, 1992). When
                                                                           the temperature is between 0 and 8 ◦ C, the influence of lo-
As shown in Fig. 6, with the changes in the water cycle                    cal water vapor circulation is greater. When the temperature
of precipitation–soil water–plant water, the δ 18 O of forests             is below 8 ◦ C, the below-cloud evaporation is very strong
is gradually enriched, while the soil water δ 18 O values of               (Zhu et al., 2021a). Therefore, we divided the temperature
arid foothills and alpine meadows are the most depleted in                 into three gradients (below 0 ◦ C, between 0 and 8 ◦ C, and
summer. In other seasons, δ 18 O is gradually enriched along               above 8 ◦ C) for analysis. From the alpine meadow to forest
with precipitation–soil water–plant water. In summer, there                to arid foothills, the correlations between temperature and
is much precipitation and high swc in alpine meadows, but                  soil δ 18 O are 0.41, 0.30, and 0.19, respectively, and the cor-
due to the low temperature (average temperature in summer

https://doi.org/10.5194/bg-19-877-2022                                                                  Biogeosciences, 19, 877–889, 2022
884 Y. Liu et al.: Isotopic differences in SPAC composition and control factors
Figure 6. Seasonal variations in different water isotopes in alpine meadow (a), forests (b), and arid foothills (c).
Table 3. Correlation between precipitation isotopes and different temperatures in different vegetation zones.
Vegetation zone type Correlation below 0 ◦ C Correlation between 0– Correlation above 8 ◦ C Correlation during
(δ 18 O/δD) 8 ◦C (δ 18 O/δD) the study period
(δ 18 O/δD) (δ 18 O/δD)
Alpine meadow 0.51∗ /0.59∗ 0.30∗ /0.24∗ 0.15/0.12 0.59∗ /0.61∗
Forest 0.95∗ /0.94∗ 0.66∗ /0.69∗ 0.14/0.10 0.69∗ /0.65∗
Arid foothills 0.47/0.51 0.79∗ /0.71∗ 0.31/0.14 0.83∗ /0.81∗
∗ A significant correlation (two-tailed) at a confidence level of 0.05.
relations with plant δ 18 O are 0.24, 0.27, and 0.25, respec- and δ 18 O = 2.27T − 22.78, respectively. When the tempera-
tively, and the temperature effect is not significant compared ture is above 8 ◦ C, there is no correlation between the precip-
with precipitation. As shown in Table 3, from the alpine itation δ 18 O and the temperature, but the precipitation δ 18 O
meadow to the arid foothills, the temperature effect of the is the most enriched, which may be related to the δ 18 O en-
precipitation isotope increased, and there is a significant pos- richment caused by the below-cloud evaporation. The re-
itive correlation with temperature and all correlations have lationships between δ 18 O and temperature in alpine mead-
passed the significance test. With the increase in temperature, ows, forests, and arid foothills are δ 18 O = 0.48T − 10.82,
the linear relationship between temperature and precipita- δ 18 O = 0.13T − 7.76, and δ 18 O = 0.27T − 10.13, respec-
tion isotopes in each vegetation zone became weaker. When tively.
the temperature is lower than 0 ◦ C, the correlation between
precipitation δ 18 O and the temperature in the arid foothills 4.2.2 The influence of altitude on the SPAC
fails to pass the significance test. The relationships between
δ 18 O and temperature in alpine meadows, forests, and arid In Fig. 7, the altitude effect of precipitation δ 18 O is the
foothills are δ 18 O = 0.62T − 10.84, δ 18 O = 1.58T − 12.14, strongest and the relationship between plant water δ 18 O and
and δ 18 O = 1.29T − 11.78, respectively. When the tempera- altitude is the weakest, showing that in the SPAC, precipi-
ture is between 0 and 8 ◦ C, the temperature effect of precipi- tation isotopes are most affected by altitude and plant water
tation weakens with the temperature increases, which may be isotopes are least affected by altitude. From the arid foothills
related to the weakening of the local water cycle and the en- to alpine meadows, the elevation increases from 2097 to
richment of precipitation isotopes. The relationships between 3647 m, and the change rate of δ 18 O and δD is −0.11 and
δ 18 O and temperature in alpine meadows, forests, and arid −0.41 ‰ (100 m)−1 . As the water vapor quality increases
foothills are δ 18 O = 0.51T − 11.41, δ 18 O = 2.46T − 22.84, along the hillside, the temperature continues to decrease and
the isotopic values of precipitation continue to deplete. In
Biogeosciences, 19, 877–889, 2022 https://doi.org/10.5194/bg-19-877-2022Y. Liu et al.: Isotopic differences in SPAC composition and control factors 885
Figure 7. Relationship between different isotopes and altitudes in the dry season (a, c) and in the rainy season (b, d); M1 stands for alpine
meadows; M2 stands for forests; and M3 stands for arid foothills.
the rainy season, the squares of the correlation coefficients on the δ 18 O of the SPAC. It can be seen from Fig. 8 and
between precipitation δ 18 O and altitude and between precip- Table 4 that the greatest impact of relative humidity on the
itation δD and altitude are 0.79 and 0.98, and the change isotope composition of the SPAC appears in the arid foothills
rates of δ 18 O and δD are −0.12 and −1.05 ‰ (100 m)−1 , in the dry season, with a correlation coefficient of 0.38. Al-
respectively. In the dry season, the correlation coefficient though in the dry season, the square of the correlation coeffi-
squares between precipitation δ 18 O and altitude and be- cient between forest precipitation isotope and relative humid-
tween precipitation δD and altitude are 0.88 and 0.90, re- ity is 0.78, there is an inverse humidity relationship between
spectively, and the rate of δ 18 O and δD change is −0.18 and the two, which may be related to the lack of precipitation
−0.79 ‰ (100 m)−1 , respectively. We can see that the alti- samples in the dry season. The largest impact of precipitation
tude effect of precipitation δ 18 O is stronger in the dry season on the isotopic composition of the SPAC occurs in the arid
(R 2 = 0.88) than in the rainy season (R 2 = 0.79). The results foothills in the rainy season, and the square of the correlation
show that as the temperature increases, the temperature ef- coefficient is 0.14. It can also be seen from Fig. 8 that the in-
fect of precipitation δ 18 O masks the altitude effect, which fluence of relative humidity and precipitation on precipitation
leads to the weakening of the altitude effect of precipitation isotopes is greater than that on plant water isotopes and soil
δ 18 O. The relationship between soil water δ 18 O and altitude water isotopes. The influence of relative humidity and pre-
is stronger in the dry season (R 2 = 0.26) than in the rainy sea- cipitation on the isotopic composition of the SPAC in alpine
son (R 2 = 0.28). The relationship between plant water δ 18 O meadows is greater than that in arid foothills and greater than
and altitude is stronger in the dry season (R 2 = 0.11) than that in forests. In general, the SPAC isotopic composition of
in the rainy season (R 2 = 0.10); this is consistent with the alpine meadows, forests, and arid foothills has a weak pre-
changes in the altitude effect of precipitation isotopes. cipitation effect, and the correlation with relative humidity is
also weak.
4.2.3 The influence of relative humidity and By comparing the correlation of temperature, altitude, rel-
precipitation on the SPAC ative humidity, and precipitation with SPAC isotope compo-
sition in different vegetation zones, we can see that the cor-
To find out the potential factors that control the isotope com- relation between temperature and altitude and SPAC isotope
position of the SPAC in different vegetation zones, we also composition is stronger than that of relative humidity and
analyzed the influence of relative humidity and precipitation precipitation. Temperature and altitude are potential factors
https://doi.org/10.5194/bg-19-877-2022 Biogeosciences, 19, 877–889, 2022886 Y. Liu et al.: Isotopic differences in SPAC composition and control factors
Figure 8. Relationship between different isotopes and relative humidity and precipitation; M1 stands for alpine meadows; M2 stands for
forests; and M3 stands for arid foothills.
Table 4. Correlation between different isotopes’ δ 18 O and relative humidity and precipitation in different vegetation zones.
Meteorological Isotope types Rainy season Dry season
parameters
Alpine meadow Forest Arid foothills Alpine meadow Forest Arid foothills
Relative Soil y = −0.001x − 8.89; y = −0.03x − 5.21; y = −0.002x − 8.01; y = −0.01x − 8.39; y = 0.01x − 7.21; y = −0.04x − 6.38;
humidity R 2 = 0.07
R 2 = 0.001 R 2 = 0.13 R 2 = 0.002 R 2 = 0.03 R 2 = 0.38
Plant y = −0.11x + 6.11; y = 0.08x − 10.53; y = 0.05x − 7.68; y = −0.09x + 3.78; y = −0.02x − 0.28; –
R 2 = 0.13 R 2 = 0.04
R 2 = 0.11 R 2 = 0.10 R 2 = 0.004
Precipitation y = −0.22x + 9.45; y = 0.02x − 9.50; y = 0.13x + 3.57; y = 0.02x − 16.47; y = 0.16x + 4.33; y = 0.08x − 20.23;
R 2 = 0.002 R 2 = 0.29 R 2 = 0.002 R 2 = 0.72 R 2 = 0.02
R 2 = 0.28
Precipitation Soil y = 0.04x − 9.55; y = 0.02x − 7.36; – y = −0.13x − 8.94; – y = 0.06x − 8.73;
R 2 = 0.15 R 2 = 0.01 R 2 = 0.06
R 2 = 0.18
Plant y = −0.07x − 1.09; y = −0.06x − 5.01; y = 0.18x − 6.00; y = 0.07x − 2.75; y = −0.41x − 0.32; –
R 2 = 0.05 R 2 = 0.03
R 2 = 0.002 R 2 = 0.01 R 2 = 0.06
Precipitation y = −0.30x − 5.21; y = −0.17x − 6.17; y = −0.28x − 2.84; y = −0.14x − 14.24; y = 0.17x − 9.41; y = 0.14x − 16.49;
R 2 = 0.11 R 2 = 0.02
R 2 = 0.09 R 2 = 0.05 R 2 = 0.14 R 2 = 0.002
that control the isotope composition of the SPAC. However, creases. When the temperature is lower than 0 ◦ C, the tem-
in the dry season, there is a phenomenon that the temperature perature effect of the vegetation zone is the strongest. In the
effect conceals the altitude effect. dry season, there is a phenomenon that the temperature effect
masks the altitude effect. With the increase in the soil depth,
the soil water isotopes are gradually depleted. The soil wa-
5 Conclusions ter content of alpine meadows is the largest and increases
with the soil depth, while the soil water content in forest de-
This paper uses the hydrogen and oxygen isotope method creases with the soil depth, and the soil water content of the
to study the differences in and control factors of the SPAC arid foothills is the lowest in August. In the rainy season,
in different vegetation zones. Temperature and altitude are plants mainly use precipitation, while forest plants mainly
the main control factors for the isotopic composition of the use soil water in the dry season. Alpine meadow plants do
SPAC. From alpine meadows to forests to arid foothills, as not directly use soil water because of the abundant precipi-
the altitude decreases, the temperature effect of precipitation tation and meltwater in the growing season. The groundwa-
isotopes increases and the influence of temperature also in-
Biogeosciences, 19, 877–889, 2022 https://doi.org/10.5194/bg-19-877-2022Y. Liu et al.: Isotopic differences in SPAC composition and control factors 887
ter table exposed in the arid foothills can provide water for Bam, E. and Ireson, A. M.: Quantifying the wetland wa-
plants in the dry season. Forests and grasslands affect inter- ter balance: a new isotope-based approach that includes
cepting rainfall: they delay or hinder the formation of surface precipitation and infiltration, J. Hydrol., 570, 185–200,
runoff and convert part of the surface runoff into soil flow and https://doi.org/10.1016/j.jhydrol.2018.12.032, 2018.
groundwater, which can provide part of the water resources Chen, X. L., Chen, Y. N., and Chen, Y. N P.: Water use
relationship of desert riparian forest in lower reaches of
for plants. To better understand the water cycle of the SPAC
Heihe River, Chinese Journal of Eco-Agriculture, 22, 972–979,
at different temperatures and altitudes in high mountain ar- https://doi.org/10.1007/s11430-013-4680-8, 2014.
eas, long-term observations of different plants are needed to Christopher, T., Solomon, J, J., Cole, R. R., and Doucett, M.:
provide a theoretical basis for the rational and practical use The influence of environmental water on the hydrogen stable
of water resources in arid mountainous areas. isotope ratio in aquatic consumers, Oecologia, 161, 313–324,
https://doi.org/10.1007/s00442-009-1370-5, 2009.
Coenders-Gerrits, A. M, J., van der Ent, R. J., Bogaard, T. A., Wang-
Data availability. The data that support the findings of this Erlandsson, L., Hrachowitz, M., Savenije, and Savenije, H. H.
study are openly available at https://data.mendeley.com/datasets/ G.: Uncertainties in transpiration estimates, Nature, 506, 74–87,
d5kzm92nn3/1 (Zhu et al., 2021b). https://doi.org/10.1038/nature12925, 2014.
Coplen, T.: Stable isotope hydrology: Stable isotope
hydrology: deuterium and oxygen 18 in the wa-
Author contributions. GZ and YL conceived the idea of the study; ter cycle, EOS T. Am. Geophys. Un., 63, 861–862,
ZZ analyzed the data; ZS and LY were responsible for field sam- https://doi.org/10.1029/EO063i045p00861, 2013.
pling; LS participated in the experiment; KZ participated in the Cortes, A. and Farvolden, R. N.: Isotope studied of precipitation and
drawing; YL wrote the paper; LS and LW checked and edited groundwater in the Sierra de las Cruces, Mexico, J. Hydrol., 107,
the language. All authors discussed the results and revised the 147–153, https://doi.org/10.1016/0022-1694(89)90055-3, 1989.
manuscript. Craig, H.: Isotopic variations in meteoric water, Science,
133, 1702–1703, https://doi.org/10.1126/science133.3465.1702,
1961.
Competing interests. The contact author has declared that neither Csilla, F., Györgyi, G., Zsófia, B., and Eszter, T.: Impact
they nor their co-authors have any competing interests. of expected climate change on soil water regime under
different vegetation conditions, Biologia, 69, 1510–1519,
https://doi.org/10.2478/s11756-014-0463-8, 2014.
Dai, J. J., Zhang, X. P., Luo, Z. D., Wang, R., Liu, Z. L., He, X. G.,
Disclaimer. Publisher’s note: Copernicus Publications remains
and Guan, H. D.: Variation of the stable isotopes of water in the
neutral with regard to jurisdictional claims in published maps and
soil–plant–atmosphere continuum of a Cinnamomum camphora
institutional affiliations.
woodland in the East Asian monsoon region, J. Hydrol., 589,
125199, https://doi.org/10.1016/j.jhydrol.2020.125199, 2020.
Darling, W. G., Bath, A. H., and Talbot, J. C.: The O and H stable
Acknowledgements. This research was financially supported by isotope composition of freshwaters in the British Isles. 2. Surface
the National Natural Science Foundation of China (41661005, waters and groundwater, Hydrol. Earth Syst. Sci., 7, 183–195,
41867030, 41971036). The authors sincerely thank their colleagues https://doi.org/10.5194/hess-7-183-2003, 2003.
at Northwest Normal University for their help in fieldwork, labora- Dawson, T. E.: Water sources of plants as determined from xylem-
tory analysis, and data processing. water isotopic composition: perspectives on plant competition,
distribution, and water relations stable isotopes and plant car-
bon water relations, stable isotopes and plant carbon-water re-
Financial support. This research has been supported by the Na- lations, Stable Isotopes and Plant carbon-water relations. Aca-
tional Natural Science Foundation of China (grant nos. 41661005, demic Press, 465–496, 1993.
41867030, 41971036). Dawson, T. E. and Ehleringer, J. R.: Streamside trees
that do not use stream water, Nature, 350, 335–337,
https://doi.org/10.1038/350335a0, 1991.
Review statement. This paper was edited by Aninda Mazumdar and Detjen, M., Sterling, E., and Gómez, A.: Stable isotopes in barna-
reviewed by two anonymous referees. cles as a tool to understand green sea turtle (Chelonia mydas)
regional movement patterns, Biogeosciences, 12, 7081–7086,
https://doi.org/10.5194/bg-12-7081-2015, 2015.
Durand, J.-L., Bariac, T., Ghesquière, M., Biron, P., Richard,
P., Humphreys, M., and Zwierzykovski, Z.: Ranking of the
References depth of water extraction by individual grass plants, using nat-
ural 18 O isotope abundance, Environ. Exp. Bot., 60, 137–144,
Araguás-Araguás, L., Froehlich, K., and Rozanski, K.: Sta- https://doi.org/10.1016/j.envexpbot.2006.09.004, 2007.
ble isotope composition of precipitation over south-
east Asia, J. Geophys. Res.-Atmos., 103, 28721–28742,
https://doi.org/10.1029/98JD02582, 1998.
https://doi.org/10.5194/bg-19-877-2022 Biogeosciences, 19, 877–889, 2022888 Y. Liu et al.: Isotopic differences in SPAC composition and control factors
Ehleringer, L.: Stable isotope composition of stem and leaf water: in different karst habitats of southwest China, Plant. Ecol., 215,
applications to the study of plant water use, Funct. Ecol., 5, 270– 1099–1109, https://doi.org/10.1007/s11258-014-0369-0, 2014.
277, https://doi.org/10.2307/2389264, 1991. Nlend, B., Celle-Jeanton, H., Risi, C., Pohl, B., Huneau, F., Ngo
Gao, J., Tian, L, D., Liu, Y, Q., and Gong, T. L.: Oxygen iso- Boum-Nkot, S., Seze, G., Roucou, P., Camberlin, P., Etame,
tope variation in the water cycle of the Yamzho lake Basin J., and Ketchemen-Tandia, B.: Identification of processes that
in southern Tibetan Plateau, Chinese Sci. Bull., 2758–2765, control the stable isotope composition of rainwater in the
https://doi.org/10.1007/s11434-009-0487-6, 2009. humid tropical west-central Africa, J. Hydrol., 584, 124650,
Gao, J., Yao, T., Tian, L. D., Risi, C., and Hoffmann, G.: https://doi.org/10.1016/j.jhydrol.2020.124650, 2020.
Precipitation water stable isotopes in the south Tibetan Price, R. M., Skrzypek, G., Grierson, P. F., Swart, P. K , and
Plateau: observations and modeling, J. Climate, 24, 3161–3178, Fourqurean, J. W.: The use of stable isotopes of oxygen and
https://doi.org/10.1175/2010JCLI3736.1, 2011. hydrogen to identify water sources in two hypersaline estuar-
Hou, S. B., Song, X. F., Jie, Y. J., Liu, X., and Zhang, G. Y.: Stable ies with different hydrologic regimes, Mar. Freshwater Res., 63,
isotopes characters in the process of precipitation and infiltration 952–966, https://doi.org/10.1071/MF12042, 2012.
in taihang mountainous region, Resources Science, 23, 86–92, Raco, B., Dotsika, E., Feroni, A. C., Battaglini, R., and
http://hdl.handle.net/2268/90707, 2008. Poutoukis, D.: Stable isotope composition of italian
Hua, M. Q., Zhang, X. P., Yao, T. C., Luo, Z. D., Zhou, bottled waters, J. Geochem. Explor., 124, 203–211,
H., Rao, Z. G., and He, X. G.: Dual effects of precipita- https://doi.org/10.1016/j.gexplo.2012.10.003, 2013.
tion and evaporation on lake water stable isotope composi- Rodriguez-Iturbe, I., Porporato, A., Laio, F., and Ridolfi, L.:
tion in the monsoon region, Hydrol. Process., 33, 2192–2205, Plants in water-controlled ecosystems: active role in hydrologic
https://doi.org/10.1002/hyp.13462, 2019. processes and response to water stress, Adv. Water. Resour.,
Jasechko, S., Sharp, Z. D., Gibson, J. J., Birkes, S. J., Yi, Y., and 24, 707–723, https://doi.org/10.1016/S0309-1708(01)00005-7,
Fawcett, P. J.: Terrestrial water fluxes dominated by transpira- 2001.
tion, Nature, 496, 347–351, https://doi.org/10.1038/nature11983, Rothfuss, Y. and Javaux, M.: Reviews and syntheses: Iso-
2013. topic approaches to quantify root water uptake: a review
Javaux, M., Rothfuss, Y., Vanderborght, J., Vereecken, H., and and comparison of methods, Biogeosciences, 14, 2199–2224,
Brüggemann, N.: Isotopic composition of plant water sources, https://doi.org/10.5194/bg-14-2199-2017, 2017.
Nature, 536, E1–E3, https://doi.org/10.1038/nature18946, 2016. Rozanski, K., Araguas-Araguas, L., and Gonfifiantini, R.: Re-
Li, C. C., Huang, M. S., Liu, J., Ji, S. P., and Zhao, R. lation between long-term trends of oxygen-18 isotope com-
Q.: Isotope-based water-use efficiency of major greening position of precipitation and climate, Science, 258, 981–985,
plants in a sponge city in northern China, PloS one, 14, https://doi.org/10.1126/science.258.5084.981, 1992.
https://doi.org/10.1371/journal.pone.0220083, 2019. Schlesinger, W. H. and Jasechko, S.: Transpiration in the
Li, L. F., Yan, J. P., Liu, D. M., Chen, F., and Ding, J. M.: Changes in global water cycle, Agr. Forest Meteorol., 189, 115–117,
soil water content under different vegetation conditions in arid- https://doi.org/10.1016/j.agrformet.2014.01.011, 2014.
semi-arid areas and analysis of vegetation construction methods, Schwendenmann, L., Pendall, E., Sanchez-Bragado, R., Kunert,
Bulletin of Soil and Water Conservation, 29, 18–22, 2009. N., Hölscher, D.: Tree water uptake in a tropical planta-
Li, S. G., Maki, T., Atsuko, S., and Michiaki, S.: Sea- tion varying in tree diversity: Interspecific differences, sea-
sonal variation in oxygen isotope composition of waters for sonal shifts and complementarity, Ecohydrology, 8, 1–12,
a montane larch forest in Mongolia, Trees, 20, 122–130, https://doi.org/10.1002/eco.1479, 2015.
https://doi.org/10.1007/s00468-005-0019-1, 2006. Shou, W. K., Hu, F. L., Alamusa., and Liu, Z. M.: Methods for
Liu, W., Wang, P., Li, J., Liu, W., and Li, H.: Plasticity of studying water cycle and water sources in arid regions based on
source-water acquisition in epiphytic, transitional and terrestrial spac system, Chinese Journal of Ecology, 32, 2194–2202, 2013.
growth phases of Ficus tinctoria, Ecohydrology, 7, 1524–1533, Smith, G. I., Friedman, I., Gleason, J. D., and Warden,
https://doi.org/10.1002/eco.1475, 2015. A.: Stable isotope composition of waters in southeast-
McCole, A. A. and Stern, L. A.: Seasonal water use pat- ern California: 2. groundwaters and their relation to mod-
terns of Juniperus ashei on the Edwards Plateau, Texas, ern precipitation, J. Geophys. Res-Atmos., 97, 5813–5823,
based on stable isotopes in water, J. Hydrol., 342, 238–248, https://doi.org/10.1029/92JD00183, 1992.
https://doi.org/10.1016/j.jhydrol.2007.05.024, 2007. Song, X., Barbour, M. M., Farquhar, G. D., Vann, D. R., and Hel-
Meissner, K., Schwendenmann, H., and Dyckmans.: Soil water up- liker, B. R.: Transpiration rate relates to within and across species
take by trees using water stable isotopes (δD and δ 18 O) – a variations in effective path length in a leaf water model of oxy-
method test regarding soil moisture, texture and carbonate, Plant gen isotope enrichment, Plant Cell Environ., 36, 1338–1351,
Soil., 376, 327–335, https://doi.org/10.1007/s11104-013-1970-z, https://doi.org/10.1111/pce.12063, 2013.
2014. Song, X. F., Xia, J., Yu, J. J., and Liu, C. M.: Application of en-
Meng, X. Q., Wen, X. F., Zhang, X. Y., Han, J. Y., Sun, X. M., and vironmental isotope techniques to study the hydrological cycle
Li, X. B.: Influence of organics on the determination of δ 18 O mechanism of typical watersheds in North China, Advances in
and δD of plant leaves and stalk water by infrared spectroscopy, Geographical Sciences, 21, 527–537, 2002.
Chinese Journal of Eco-Agriculture, 20, 1359–1365, 2012. Sprenger, M., Tetzlaff, D., and Soulsby, C.: Soil water stable iso-
Nie, Y. P., Chen, H. S., Wang, K, L., and Ding, Y. L.: Rooting char- topes reveal evaporation dynamics at the soil–plant–atmosphere
acteristics of two widely distributed woody plant species growing interface of the critical zone, Hydrol. Earth Syst. Sci., 21, 3839–
3858, https://doi.org/10.5194/hess-21-3839-2017, 2017.
Biogeosciences, 19, 877–889, 2022 https://doi.org/10.5194/bg-19-877-2022Y. Liu et al.: Isotopic differences in SPAC composition and control factors 889 Sun, S. F., Huang, J. H., Lin, G. H. , Zhao, W., and Han, Yang, B., Wen, X., and Sun, X.: Seasonal variations in depth of X. G.: Application of stable isotope technique in the study water uptake for a subtropical coniferous plantation subjected to of plant water use, Acta Ecologica Sinica, 25, 2362–2371, drought in an east Asian monsoon region, Agr. Forest Meteorol., https://doi.org/10.1360/982004-755, 2005 (in Chinese). 201, 218–228, https://doi.org/10.1016/j.agrformet.2014.11.020, Wan, Q. Z., Zhu, G. F., Guo, H. W., Zhang, Y., Pan, H. X., and Yong, 2015. L. L.: Influence of vegetation coverage and climate environment Yu, J. J., Song, X. F., Liu, X. C., Yang, C., Tang, C. Y., and Li, F. D.: on soil organic carbon in the Qilian mountains, Sci. Rep.-UK, 9, A study of groundwater cycle in yongding river basin by using 17623. https://doi.org/10.1038/s41598-019-53837-4, 2019. δD, δ 18 O and hydrochemical data, Journal of Natural Resources, Wang, S. Y., Wang, Q. L., Wu, J, K., He, X. B., and Wang, L. 22, 415–423, 2007. H.: Characteristics of stable isotopes in precipitation and mois- Zhou, H., Zhao, W. Z., Zheng, X. J., and Li, S. J.: Root distribution ture sources in the headwaters of the Yangtze River, Environm. of Nitraria sibirica with seasonally varying water sources in a Sci., 40, 2615–2623, https://doi.org/10.13227/j.hjkx.201811140, desert habitat, J. Plant Res., 128, 613–622, 2015. 2019. Zhou, J. J., Zhao, Y. R., Huang, P., and Liu. C. F.: Impacts of eco- Wei, W., Xie, B., Zhang, X., and Zhang, J.: Spatial heterogene- logical restoration projects on the ecosystem carbon storage of ity of soil moisture and vegetation cover in Shiyang river inland river basin in arid area, China, Ecol. Indic., 118, 106803, basin, northwest China, IOP Conference Series: Earth and Envi- https://doi.org/10.1016/j.ecolind.2020.106803, 2020. ronmental Science., 237, 052003, https://doi.org/10.1088/1755- Zhu, G. F., Guo, H. W., Qin, D. H., Pan, H. X., and Ma, X. G.: Con- 1315/237/5/052003, 2019. tribution of recycled moisture to precipitation in the monsoon West, A. G., Patrickson, S. J., and Ehleringer, J. R.: Water marginal zone: estimate based on stable isotope data, J. Hydrol., extraction times for plant and soil materials used in stable 569, 423–435, https://doi.org/10.1016/j.jhydrol.2018.12.014, isotope analysis, Rapid Commun. Mass Sp., 20, 1317–1321. 2018. https://doi.org/10.1002/rcm.2456, 2010. Zhu, G. F., Zhang, Z. X., Guo H. W., Zhang, Y., Yong, L. L., Wan, Western, A. W. and Grayson, R. B.: The tarrawarra data set: Q. Z., Sun, Z. G., and Ma, H. Y.: Below-Cloud Evaporation of soil moisture patterns, soil characteristics, and hydrologi- Precipitation Isotope over Mountain–oasis–desert in Arid Area, cal flux measurements, Water. Resour. Res., 34, 2765–2768. J. Hydrometeorol., 22, 2533-2545, https://doi.org/10.1175/JHM- https://doi.org/10.1029/98WR01833, 1998. D-20-0170.1, 2021a. White, J., Cook, E., Lawrence, J. R., and Broecker, W. S.: The Zhu, G. F.: Stable water isotope monitoring network of dif- D/H ratios of sap in trees: implications for water sources and ferent water bodies in Shiyang River Basin, a typical arid tree ring D/H ratios, Geochim. Cosmochim. Acta, 49, 237–246, river in China (Supplemental Edition 20210808) [data set], https://doi.org/10.1016/0016-7037(85)90207-8, 1985. https://doi.org/10.17632/d5kzm92nn3.1, 2021b. https://doi.org/10.5194/bg-19-877-2022 Biogeosciences, 19, 877–889, 2022
You can also read